0428
Toward quantitative inhomogeneous magnetization transfer (qihMT) using a general Matrix Exponential Model1Aix Marseille Univ, CNRS, CRMBM UMR 7339, Marseille, France, 2Department of Radiology, Division of MR Research, Beth Israel Deaconess Medical Center, Harvard Medical School, Boston, MA, United States, Boston, MA, United States
Synopsis
Inhomogeneous magnetization transfer is becoming an important tool in the detection of demyelinating pathologies, as well as in the understanding of the molecular mechanisms engaged in demyelinating/remyelinating processes. Although ihMT ratio delivers a reproducible index sensitive to the dipolar order underpinning the ihMT effect, advanced approaches analogous to quantitative MT could allow estimation of quantitative parameters directly related to the underlying biophysical model of myelin. This study proposes a general framework based on the Matrix Exponential Model allowing fast fitting of ihMT data. Demonstration of qihMT is performed ex-vivo on rat spinal cord specimen and in-vivo on mouse brain.
Introduction
Inhomogeneous magnetization transfer (ihMT) is an endogenous contrast mechanism driven by proton-proton dipolar interactions and weighted by the associated dipolar relaxation time T1D. Although the usual ihMT ratio delivers a reproducible index sensitive to the intrinsic dipolar order, advanced approaches analogous to quantitative MT could allow estimation of quantitative parameters directly related to the biophysical model of tissues.
A theoretical understanding of the fundamental mechanisms of ihMT has been provided by the inclusion of a dipolar reservoir in the existing two pool model for MT (Fig.1). Two analytical approaches1,2 allowing the extraction of quantitative parameters pertaining to the ihMT signal from a non-linear fitting process have been developed so far. The first model1 assumed a long continuous wave for irradiation as opposed to the RF pulsed scheme typically employed in experimental ihMT protocol and a stationary RF irradiation regime. Furthermore, the model considered a simultaneous dual-offset irradiation, thereby preventing correct description of frequency-alternated pulsed-based approach employed for enhanced specificity in myelin3. The second model2, dedicated to T1D measurements, was based on a modified ihMT sequence with frequency-alternated pulses approach and considered that MZA, the free pool longitudinal magnetization, is constant whichever the timing between two alternated frequency saturations. Moreover, the two models explore different dimensions of the ihMT signal in the fitting process (frequency and power for model 1, time between two consecutive frequency alternations or dt for model 2) and therefore are not compatible with each other.
In this work, a general qihMT model capable of exploring simultaneously all dimensions of the ihMT responses is proposed to extract biophysical parameters. This approach is based on the matrix formalism and is using minimal approximations4.
Materials and methods
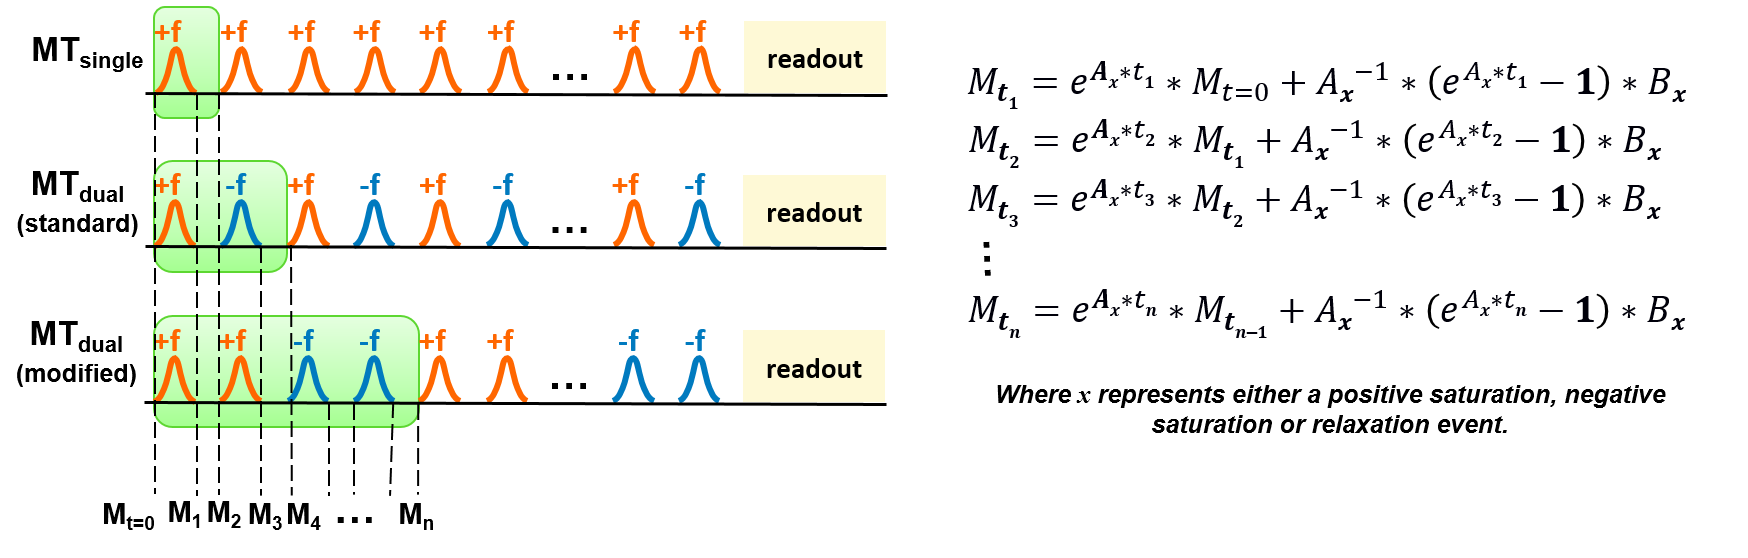
The time evolution of magnetization in the liquid and semisolid pools can be defined by the equation:
$$\dot{M}=AM+B,$$
where M is a vector containing the magnetization of each pool. A represents matrices of the interactions between the considered pools4 and B the thermal equilibrium. The general solution of this equation for A, B constant in time is:
$$M_t=e^{At}\times M_{t=0}+A^{-1}(e^{At}-I)B.$$
This equation is applied to each ihMT saturation pattern (single-offset RF pulse for MT single, frequency-alternated RF pulses for standard and modified MT dual (Fig.2)), determining a general solution for ihMT.
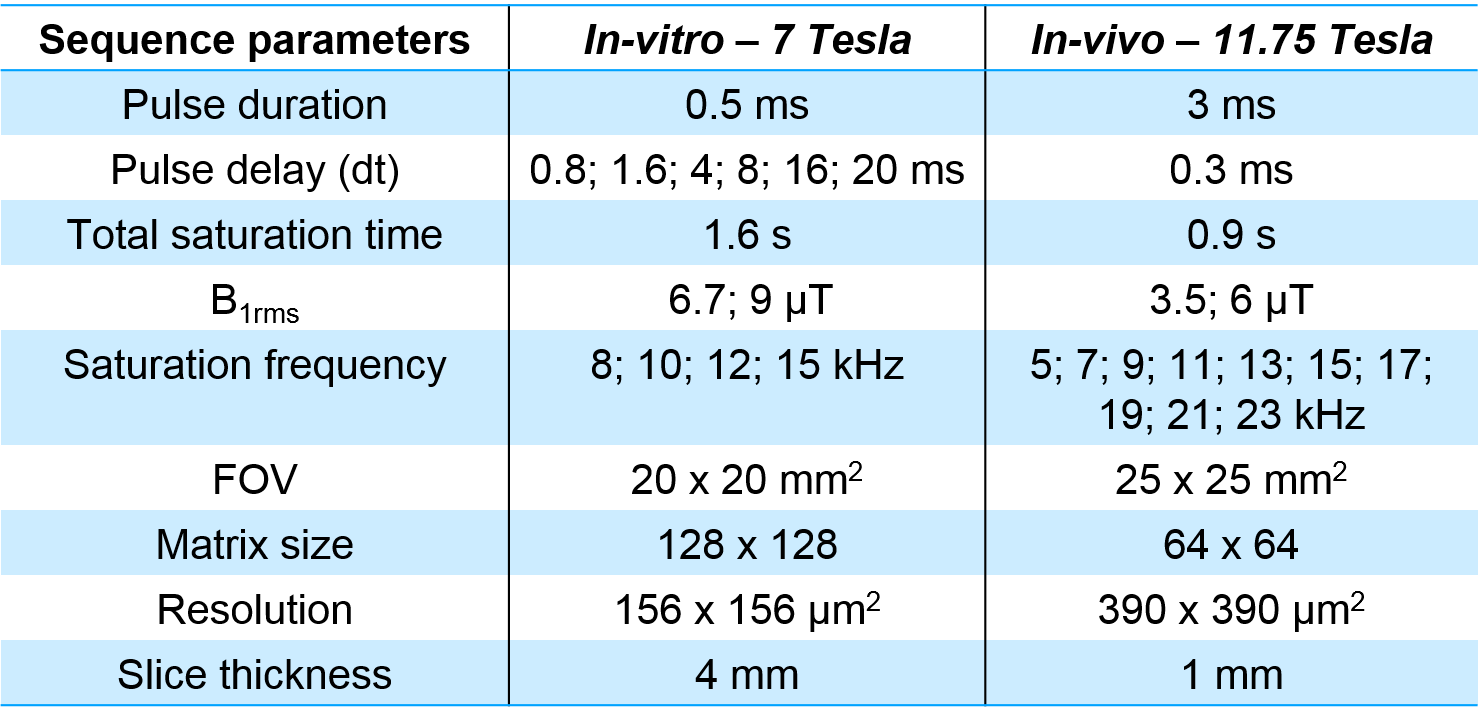
For experiments, a modified ihMT-preparation2 was combined with a 2D–single slice RARE readout and allowed the acquisition of single and dual RF saturation MT data needed for the computation of ihMT metrics (Fig.2). Sequence parameters are defined in Fig.3.
Ex vivo experiments were conducted on a 7T scanner (Pharmascan, Bruker) with a volume emitter coil and a 4-element array receiver cryoprobe. Data were acquired on rat spinal cord specimen soaked in PBS and maintained at constant temperature (38±1°C).
In vivo experiments were conducted on a 11.75T vertical bore scanner (Bruker) in 3 healthy female C57B1/6J (16 weeks old) mice under isoflurane sedation and maintained at physiological temperature.
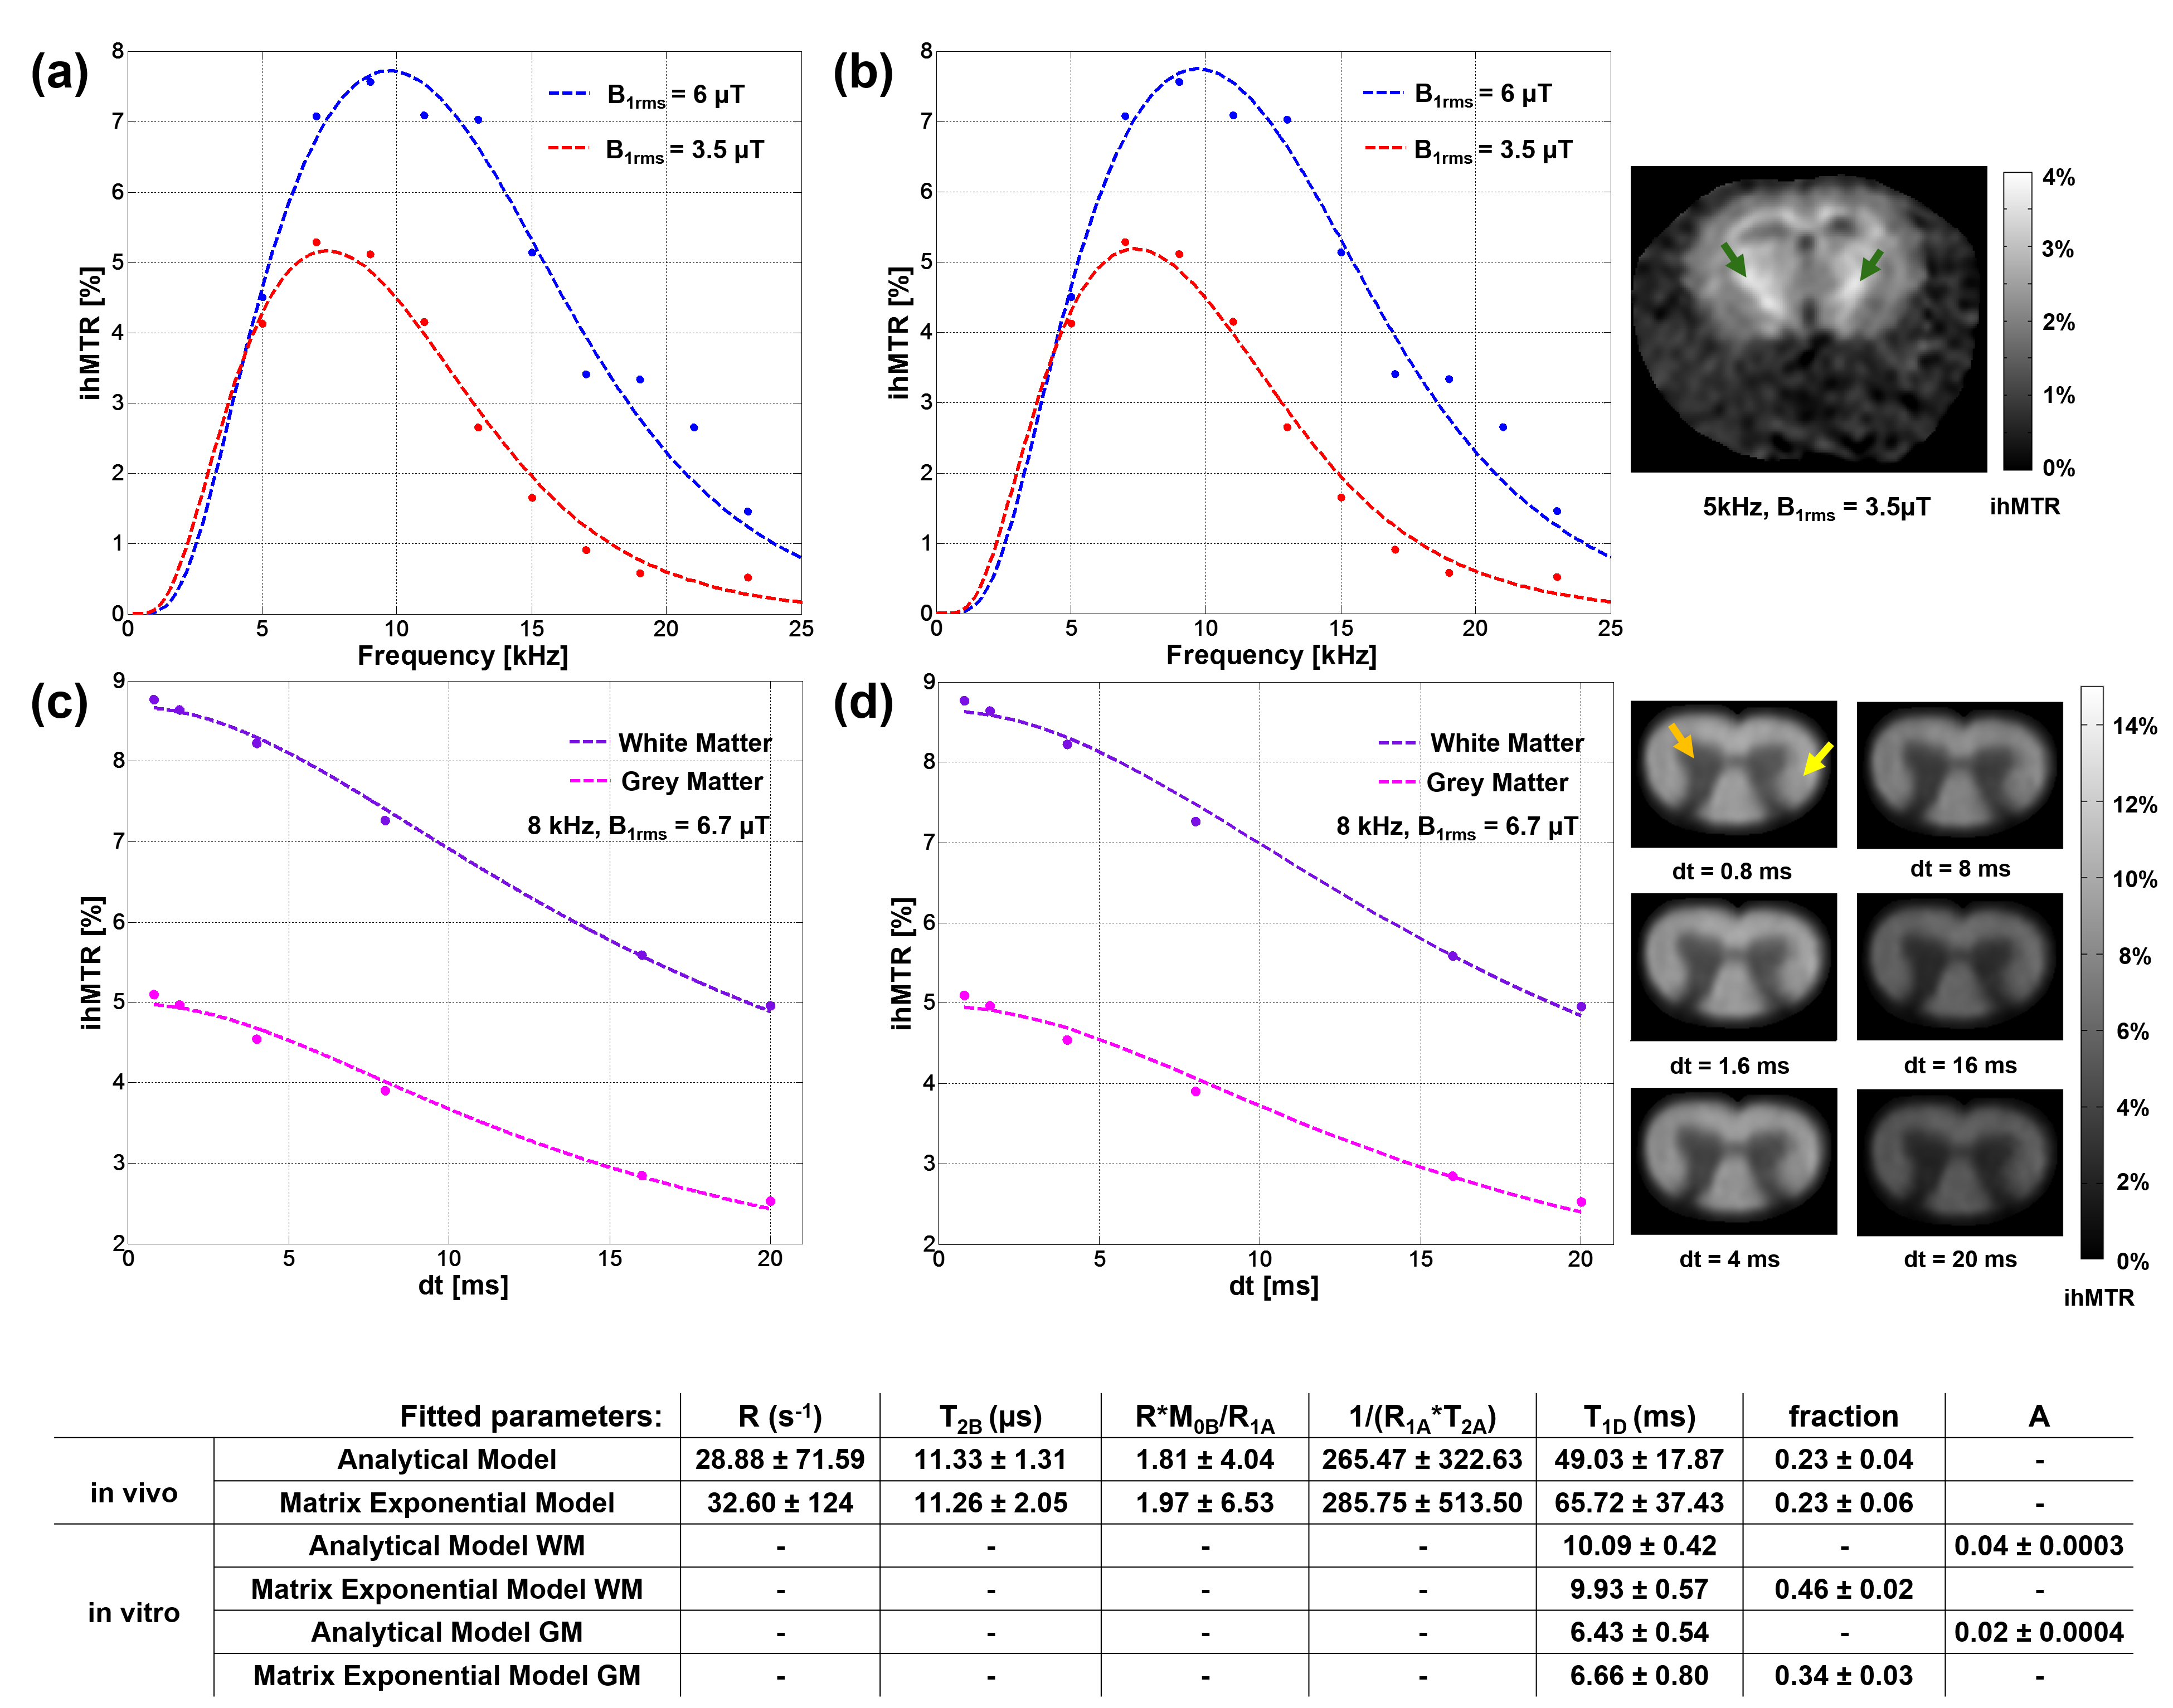
ihMTR values were calculated as $$$ihMTR=2\times(MT_\text{single}-MT_\text{dual})/M_0$$$ (M0 is the reference signal acquired without saturation) and evaluated in different tissue structures. The general ihMT solution was then used for data fitting using non-linear least squares method.
Results and discussion
A comprehensive protocol corresponding to parameters in Fig.3 has been acquired. Good agreement was obtained between the matrix exponential approach presented in this work and the two analytical models previously proposed, hence validating the proposed general qihMT model. In particular, in-vivo parameters were fitted on a 2-dimensional dataset probing the RF frequency and power dependency (Fig.4a,b). The small differences in value of T1D and that of 1/(R1A*T2A) might be attributed to different model assumptions (continuous wave vs. pulsed approach) and noise propagation through the different models. In-vitro parameters were fitted on 1-dimensional data containing only temporal information (dt), sensitive to T1D estimated value was $$$1.5~\text{ms}$$$ for WM at $$$15~\text{kHz}$$$ of frequency and $$$6.7~\mu T$$$ of $$$B_\text{1rms}$$$.
The generalized qihMT model allowed for multi-dimensional data fitting, so far limited by analytical models due to underlying assumptions and constrained validity regime. For example, a 2 and 3-dimensional dataset containing $$$B_\text{1rms}$$$, dt and the offset frequency are amenable to qihMT analyses as shown in Fig.5.
Conclusion
The matrix exponential qihMT model is a robust and general model, allowing for multi-dimensional data fitting. Furthermore, biophysical model extensions can be easily included through matrices A and B expansion and adaptation.Acknowledgements
No acknowledgement found.References
[1] G. Varma, O.M. Girard, V.H. Prevost, A.K. Grant, G. Duhamel, D.C. Alsop. Interpretation of magnetization transfer from inhomogeneously broadened lines (ihMT) in tissues as a dipolar order effect within motion restricted molecules. Journal of Magnetic Resonance 260 (2015) 67–76.
[2] Gopal Varma, Olivier M. Girard, Valentin H. Prevost, Aaron K. Grant, Guillaume Duhamel and David C. Alsop. In Vivo Measurement of a New Source of Contrast, the Dipolar Relaxation Time, T1D, Using a Modified Inhomogeneous Magnetization Transfer (ihMT) Sequence. Magnetic Resonance in Medicine 78:1362–1372 (2017).
[3] V.H. Prevost, O.M. Girard, S. Mchinda, G. Varma, D.C. Alsop, G. Duhamel. Optimization of inhomogeneous magnetization transfer (ihMT) MRI contrast for preclinical studies using dipolar relaxation time (T1D) filtering. NMR in Biomedicine. 2017;e3706
[4] Sharon Portnoy and Greg J. Stanisz. Modeling Pulsed Magnetization Transfer. Magnetic Resonance in Medicine 58:144–155 (2007).
[5] Provotorov BN. Magnetic resonance saturation in crystals. J Exptl Theor. Phys 1962;14.
Figures