0424
Multivariate template creation of a myelin water brain atlas with GRASE and mcDESPOT1Physics and Astronomy, University of British Columbia, Vancouver, BC, Canada, 2International Collaboration on Repair Discoveries, University of British Columbia, Vancouver, BC, Canada, 3Institute of Psychiatry, Psychology & Neuroscience, King's College, London, United Kingdom, 4Radiology, University of British Columbia, Vancouver, BC, Canada, 5Medicine, University of British Columbia, Vancouver, BC, Canada, 6Chemical and Biological Engineering, University of British Columbia, Vancouver, BC, Canada, 7Pediatrics, University of British Columbia, Vancouver, BC, Canada
Synopsis
Myelin water imaging (MWI) techniques provide metrics with high specificity to myelin content, and benefit greatly from an efficient, standardized method for data interpretation. In this study, high performance diffeomorphic normalisations are used to create a myelin water atlas; statistics related to MWI metrics at each point in a template space. Multivariate template creation methods were used to simultaneously leverage anatomical features from two popular MWI techniques (GRASE and mcDESPOT). The resulting multivariate myelin water atlas can be used in future studies with either technique and provides insight into their differences.
Background
Myelin water imaging (MWI) is considered to be one of the most myelin-specific MRI techniques available1,2. MWI relies on acquisition of a T2 relaxation decay curve and subsequent fitting to a multi-component T2 distribution. This provides the histologically validated myelin water fraction (MWF), the short T2 fraction of signal attributed to water trapped within myelin lipid bilayers3,4. When calculated using a multi-echo gradient and spin echo (GRASE) sequence, it is denoted MWFG. An alternative MWI approach is multi-component driven equilibrium single pulse observation of T1 and T2 (mcDESPOT). mcDESPOT acquires spoiled gradient echo (SPGR) and balanced steady state free precession (bSSFP) data at various flip angles. A stochastic region contraction (SRC) algorithm models multiple water pools, fitting the fractional signal from each pool using the different T1 and T2-weighting at each flip angle. The mcDESPOT version of MWF is denoted MWFD5.
The utility of MWI (and many other quantitative MRI measures) has been impeded by the absence of an efficient, standardized method for data interpretation. A promising solution is to use an atlas depicting statistics related to the MWI metrics at each point in a template space6,7. The myelin water atlas can benefit from high performance diffeomorphic normalisations and leveraging multivariate image features in a template creation process designed to minimize statistical biases while maximizing anatomical alignment.
The purpose of this study was to:
(1) Provide a further optimised anatomical template and myelin water atlas for studies using GRASE or mcDESPOT MWI.
(2) Examine MWFG and MWFD differences with maximized anatomical alignment of GRASE and mcDESPOT data, achieved using symmetric diffeomorphic normalization transformations and a multivariate template creation process.
Methods
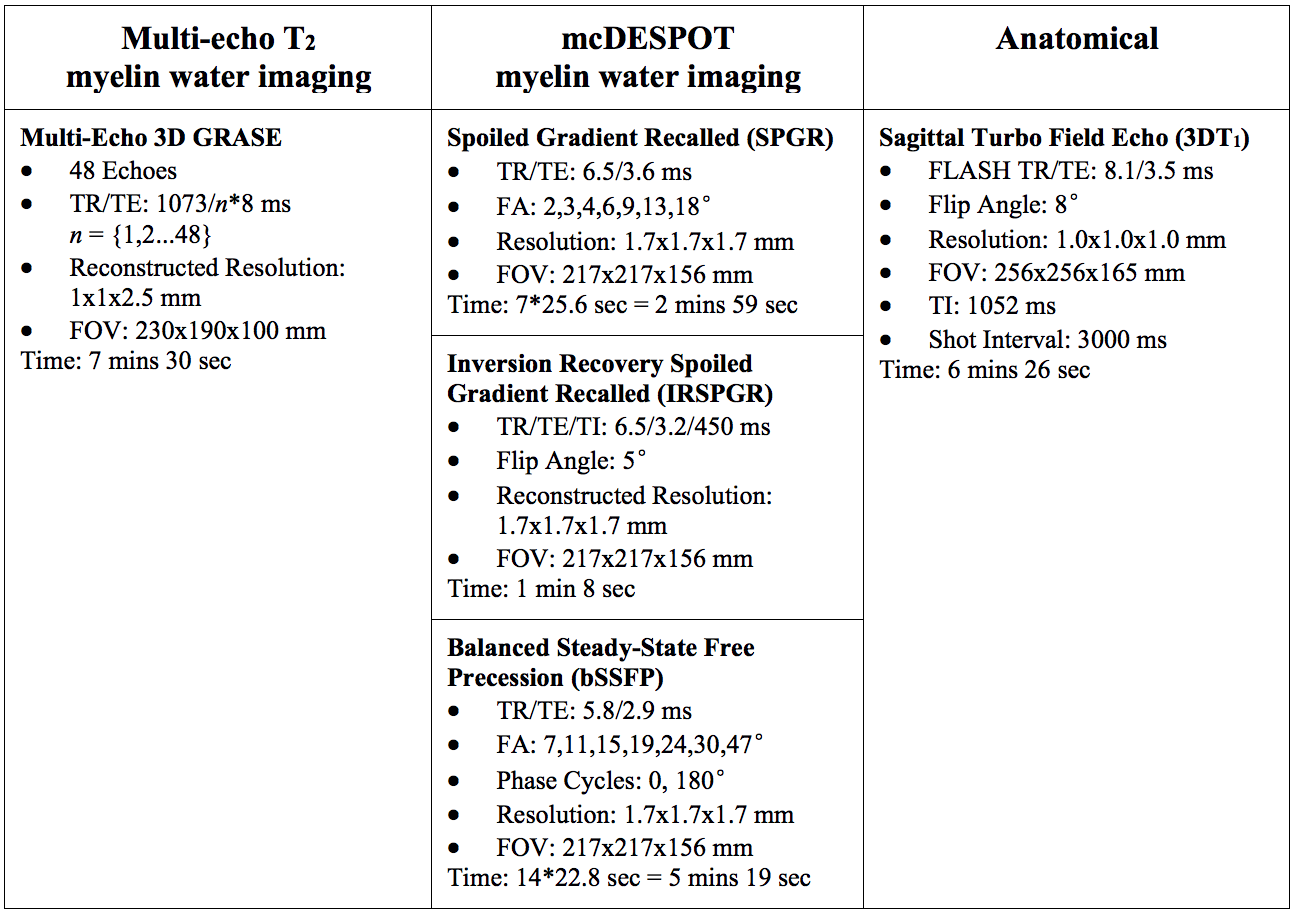
MRI: 21 healthy controls (HC, 5M/16F, age mean 44yrs, range: 22-65yrs), one person with relapsing-remitting multiple sclerosis (RRMS, F, 26yrs, EDSS 2.5, disease duration 3yrs) and one with primary progressive MS (PPMS, F, 64yrs, EDSS 8.5, disease duration 29yrs) were scanned on a 3T Philips Achieva using an 8-channel SENSE head coil. Table 1 provides acquisition details for the anatomical (3DT1), GRASE, and mcDESPOT imaging.
Data Processing: T2 distributions were produced from the GRASE data using an in-house regularized non-negative least-squares fitting algorithm with stimulated echo correction8,9. MWFG was calculated as the fraction of the T2-distribution with T2<40ms10. mcDESPOT analysis used the DESPOT1-HIFI code11 to calculate a B1 map for flip angle correction, followed by the mcDESPOT SRC algorithm12,13 to calculate MWFD.
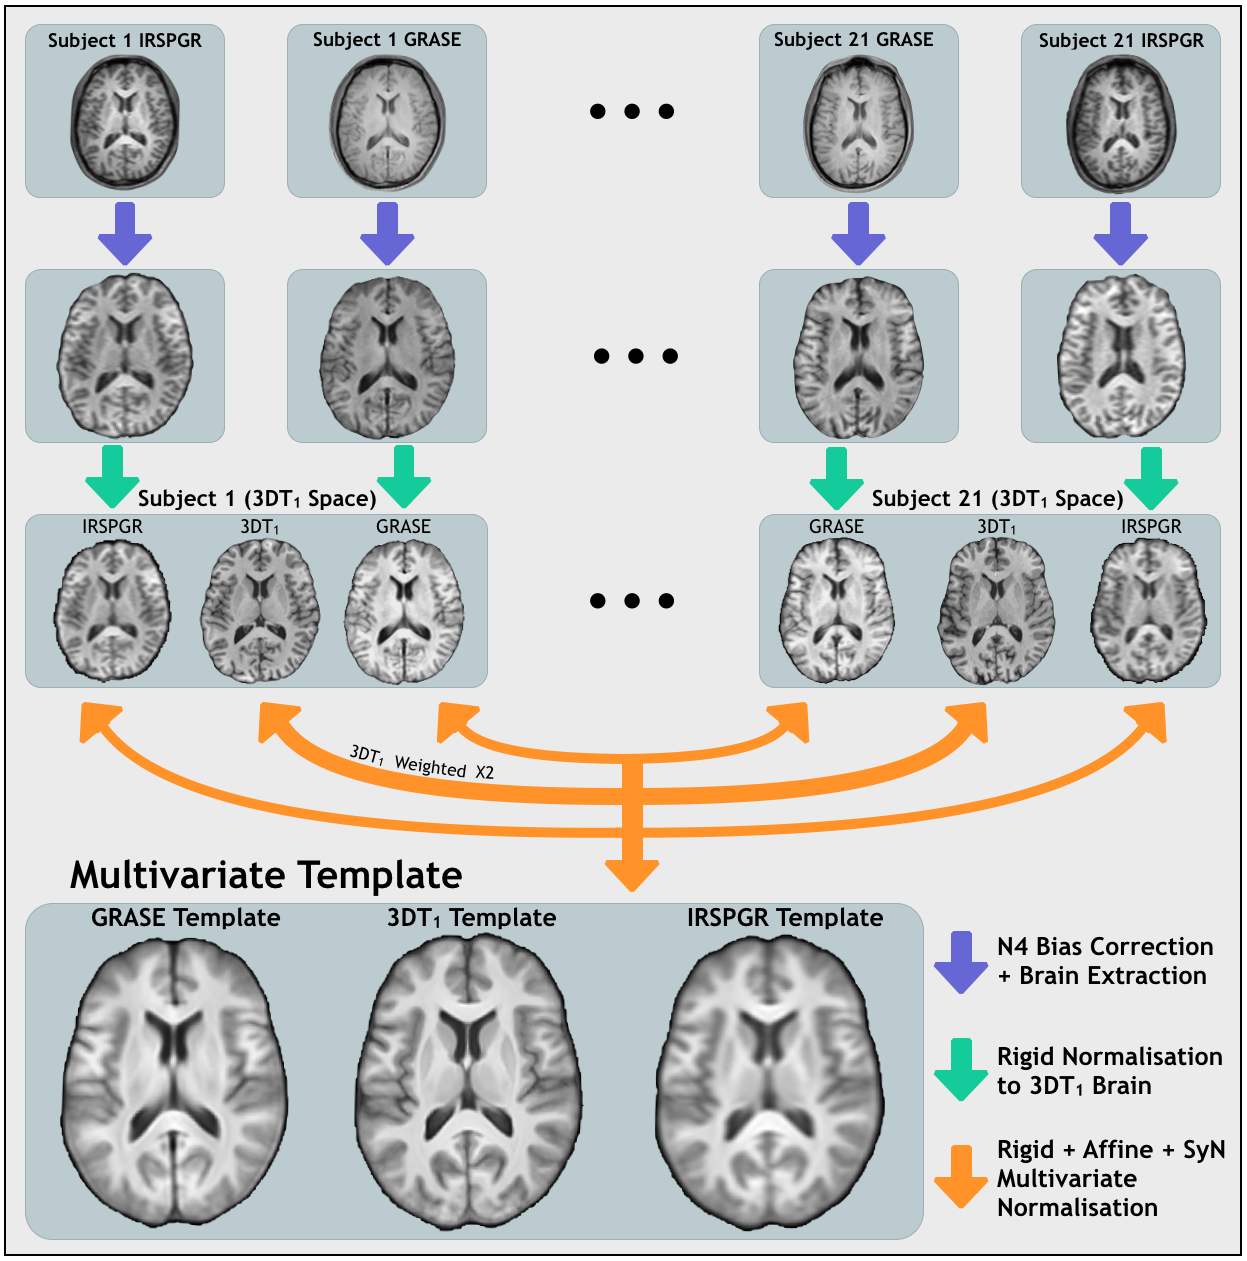
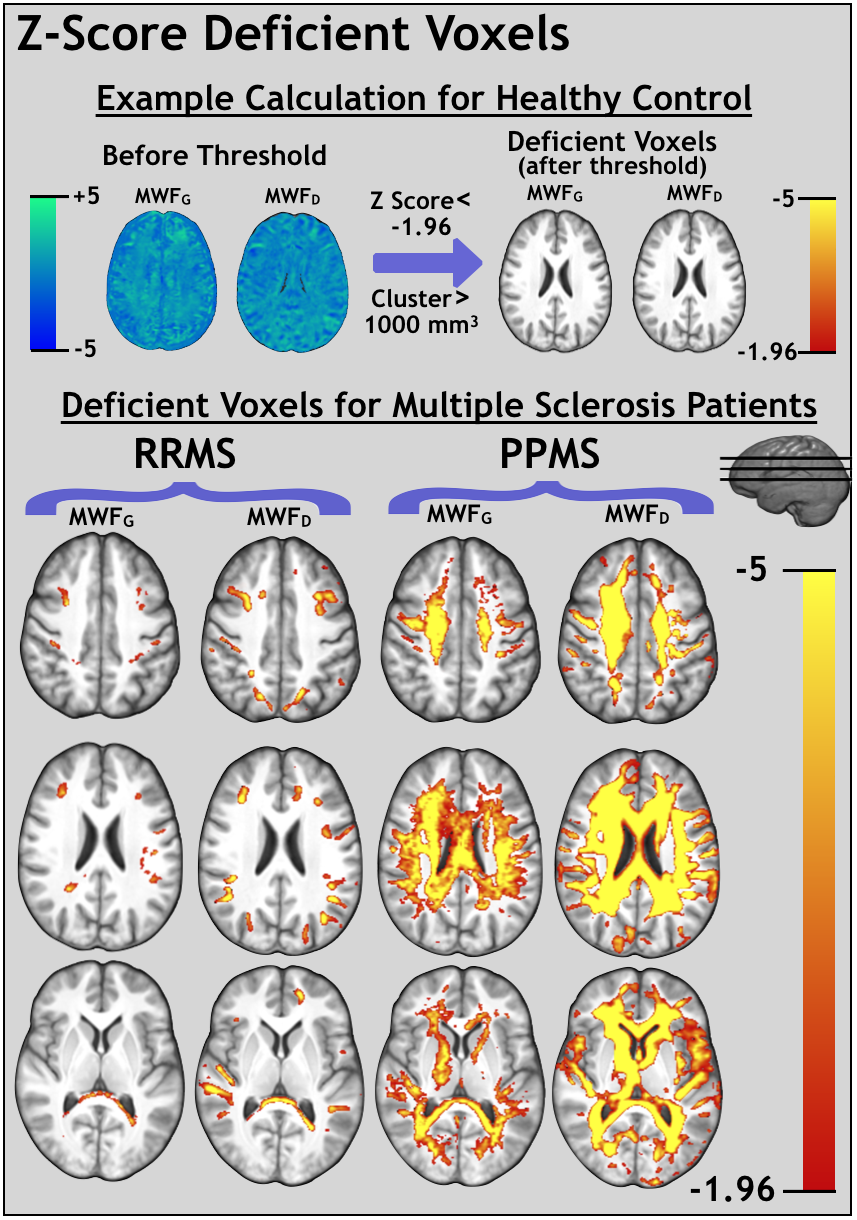
Atlas Creation: Only anatomical images were involved in the normalization procedure, to prevent introduction of circularity bias14. Advanced Normalization Tools (ANTs) software was used for atlas creation15. N4 bias field correction was done to reduce low frequency intensity nonuniformities in GRASE echo-1 and inversion-recovery SPGR (IRSPGR) images, for each subject16. GRASE echo 1 was squared to accentuate white/gray matter contrast and better match the IRSPGR and 3DT1 contrast. All images were brain extracted with ANTs using the MNI-152 template and brain probability mask, then normalized to 3DT1 space using an intra-subject rigid transformation. Multivariate normalization was performed with GRASE echo-1, IRSPGR and 3DT1 (weighted twice as heavily) using iterative rigid, affine, and greedy symmetric diffeomorphic normalisation transformation algorithms with a neighborhood cross correlation similarity metric. This process is outlined in Figure 1. Multi-atlas segmentation was performed using joint label fusion17,18 with the MNI-152 template and white matter labels for region of interest (ROI) analysis. For one HC and both MS patients, voxel-wise Z-scores were calculated as $$$ Z= \frac{x_{patient}-\overline{x}_{controls}}{\sigma_{controls}} $$$ with a coefficient of variation threshold at 0.75. “MWF Deficient” voxel clusters were calculated with significance thresholds at Z<-1.96 and cluster sizes>1000mm3.
Results and Discussion
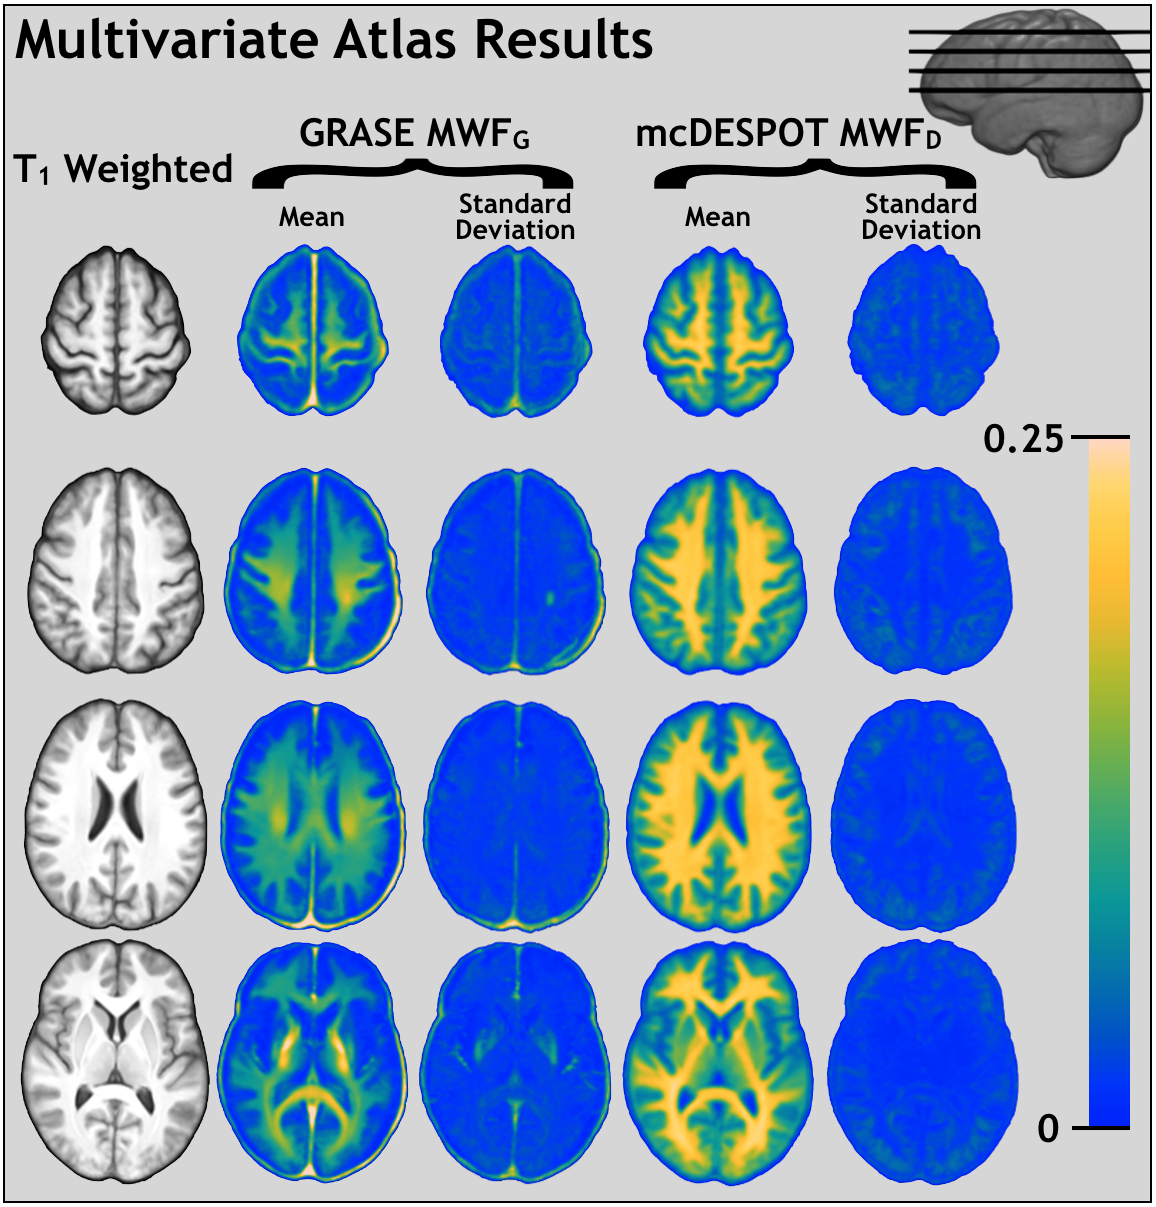
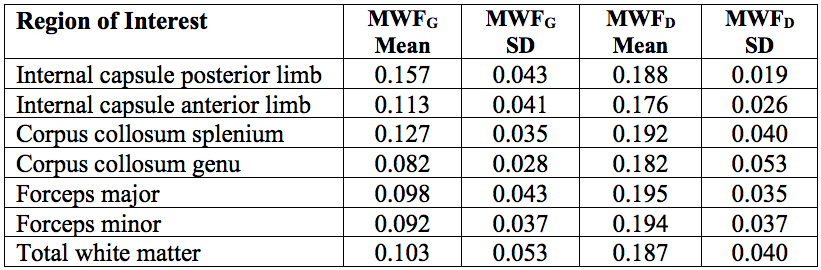
Figure 2 shows axial slices of the mean and standard deviation for both MWFG and MWFD atlases, alongside the anatomical template. Table 2 presents ROI results for the average and standard deviation of MWF values. MWFG values are consistently smaller than MWFD. Figure 3 depicts MWF Z-score maps for one HC and 2 MS patients. For the HC, the Z-score is shown alongside the map of MWF deficient voxels (of which there were none). The RRMS patient had several MWF deficient clusters, somewhat more extensive for MWFD but still with similar characteristics between techniques. PPMS MWF deficient voxels covered much larger areas than for RRMS, but MWFD clusters were also more extensive than using MWFG.Conclusions
Despite the large difference between MWFG and MWFD values, MS patient Z-score maps show similar characteristics for both sequences, with larger MWF deficient clusters for the patient with more severe clinical disability. These methods can help explain how these metrics differ, and how demographic factors affect the distribution of myelin content.Acknowledgements
Funding support was provided by the Canadian Natural Sciences and Engineering Research Council (NSERC) and the Multiple Sclerosis Society of Canada.References
1. MacKay, A., et al., In vivo visualization of myelin water in brain by magnetic resonance. Magn Reson Med, 1994. 31(6): p. 673-7.
2. MacKay, A., et al., Insights into brain microstructure from the T2 distribution. Magnetic Resonance Imaging, 2006. 24(4): p. 515--525.
3. Laule, C., et al., Water content and myelin water fraction in multiple sclerosis - A T-2 relaxation study. Journal of Neurology, 2004. 251(3): p. 284-293.
4. Laule, C., et al., Magnetic resonance imaging of myelin. Neurotherapeutics, 2007. 4(3): p. 460-84.
5. Kolind, S., et al., Brain and cord myelin water imaging: a progressive multiple sclerosis biomarker. Neuroimage Clin, 2015. 9: p. 574-80.
6. Kolind, S., et al., Myelin water imaging reflects clinical variability in multiple sclerosis. Neuroimage, 2012. 60(1): p. 263-70.
7. Liu, H., et al., Myelin water atlas: a template for myelin distribution in the brain. 2018.
8. Prasloski, T., et al., Applications of stimulated echo correction to multicomponent T2 analysis. Magn Reson Med, 2012. 67(6): p. 1803-14.
9. Yoo, Y.J., et al., Fast Computation of Myelin Maps From MRI T-2 Relaxation Data Using Multicore CPU and Graphics Card Parallelization. Journal of Magnetic Resonance Imaging, 2015. 41(3): p. 700-707.
10. Laule, C., et al., Two-year study of cervical cord volume and myelin water in primary progressive multiple sclerosis. Mult Scler, 2010. 16(6): p. 670-7.
11. Deoni, S.C.L., High-resolution T1 mapping of the brain at 3T with driven equilibrium single pulse observation of T1 with high-speed incorporation of RF field inhomogeneities (DESPOT1-HIFI). Journal of Magnetic Resonance Imaging, 2007. 26(4): p. 1106-1111.
12. Deoni, S.C., et al., Gleaning multicomponent T1 and T2 information from steady-state imaging data. Magn Reson Med, 2008. 60(6): p. 1372-87.
13. Deoni, S.C.L., Transverse relaxation time (T2) mapping in the brain with off-resonance correction using phase-cycled steady-state free precession imaging. Journal of Magnetic Resonance Imaging, 2009. 30(2): p. 411--417.
14. Tustison, N.J., et al., Logical circularity in voxel-based analysis: Normalization strategy may induce statistical bias. Human Brain Mapping, 2014. 35(3): p. 745-759.
15. Avants, B.B., et al., A reproducible evaluation of ANTs similarity metric performance in brain image registration. Neuroimage, 2011. 54(3): p. 2033-2044.
16. Tustison, N.J., et al., N4ITK: Improved N3 Bias Correction. Ieee Transactions on Medical Imaging, 2010. 29(6): p. 1310-1320.
17. Wang, H., et al., Multi-Atlas Segmentation with Joint Label Fusion. IEEE Trans Pattern Anal Mach Intell, 2013. 35(3): p. 611-23.
18. Wang, H. and P.A. Yushkevich, Multi-atlas segmentation with joint label fusion and corrective learning-an open source implementation. Front Neuroinform, 2013. 7: p. 27.
Figures