0423
Inherent bias in multi-component DESPOT myelin water fraction estimation.1Biomedical Engineering Department, School of Biomedical Engineering and Imaging Sciences, King's College London, London, United Kingdom, 2Centre for the Developing Brain, School of Biomedical Engineering and Imaging Sciences, King's College London, London, United Kingdom, 3Institute of Psychiatry, Psychology & Neuroscience, King's College London, London, United Kingdom
Synopsis
mcDESPOT is a quantitative relaxometry technique that enables estimation of myelin water fraction (MWF) in a clinically feasible acquisition time with high signal-to-noise ratio efficiency. Many studies show in-vivo MWF maps with realistic grey matter-white matter contrast, which conflicts with statistical analyses suggesting that parameter estimation should be inaccurate and imprecise. We show that the parameters (including MWF) and their corresponding variance are indeed ill-conditioned, but their estimation is strongly influenced by the typically used fitting approach (stochastic region contraction). We also demonstrate that this degeneracy arises primarily from intercompartmental exchange.
Introduction
mcDESPOT is a quantitative relaxometry method that enables myelin water fraction (MWF) estimation.1 Since myelin water is a substantial component of myelin composition, MWF has been proposed as a direct measure of myelin content and correlates with histological measures, exhibiting potential as a biomarker for neurological conditions.2
However, a discrepancy exists in the literature between in-vivo studies that present MWF maps with feasible grey matter-white matter (GM-WM) contrast3,4 and statistics-based studies that question whether useful parameter estimates are possible at realistic signal-to-noise ratios (SNRs).5 This suggests the stochastic region contraction (SRC) estimator normally used in mcDESPOT is biased, to the extent that realised parameter variance is much smaller than would be expected from an unbiased estimator.6
We investigate parameter estimation stability and reproducibility in mcDESPOT using SRC, addressing two questions: (i) how can apparently biologically plausible measurements be made to relatively high precision? and (ii) what are the resultant estimation biases?
Methods
Simulation work considered a best-case scenario where the model perfectly describes tissue response. We employed the CSMT (constant saturation power RF pulses)7 method in-vivo to control magnetization transfer (MT) effects, that have been reported to impact parameter estimation in mcDESPOT8,9, so measurements would be closer to the modelled two-pool scenario. The acquisition scheme employed by Bouhrara et al.10 was used throughout.
To sample the search space for a model including exchange, we randomly generated 200 million combinations of model parameters (from the widest bounds possible, from all sets used in Figure 3), forward-modelled their signals and computed the pseudo-likelihood function for each using Equation 1. $$$\boldsymbol{\theta}$$$ is the search space position, $$$\boldsymbol{\hat{\theta}}$$$ is the actual solution and $$$\boldsymbol{S(\theta)}$$$ is the simulated signals for parameters $$$\boldsymbol{\theta}$$$. $$$\sigma^2$$$ represents notional noise variance in the measurements.
$$(1) P(\boldsymbol{\theta},\boldsymbol{\hat{\theta}})=exp\left(\frac{-||\boldsymbol{S(\theta)}-\boldsymbol{S(\hat{\theta})}||^{2}}{2\sigma^{2}}\right)$$
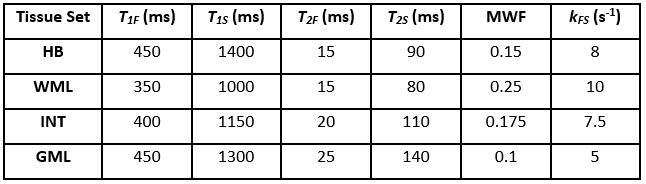
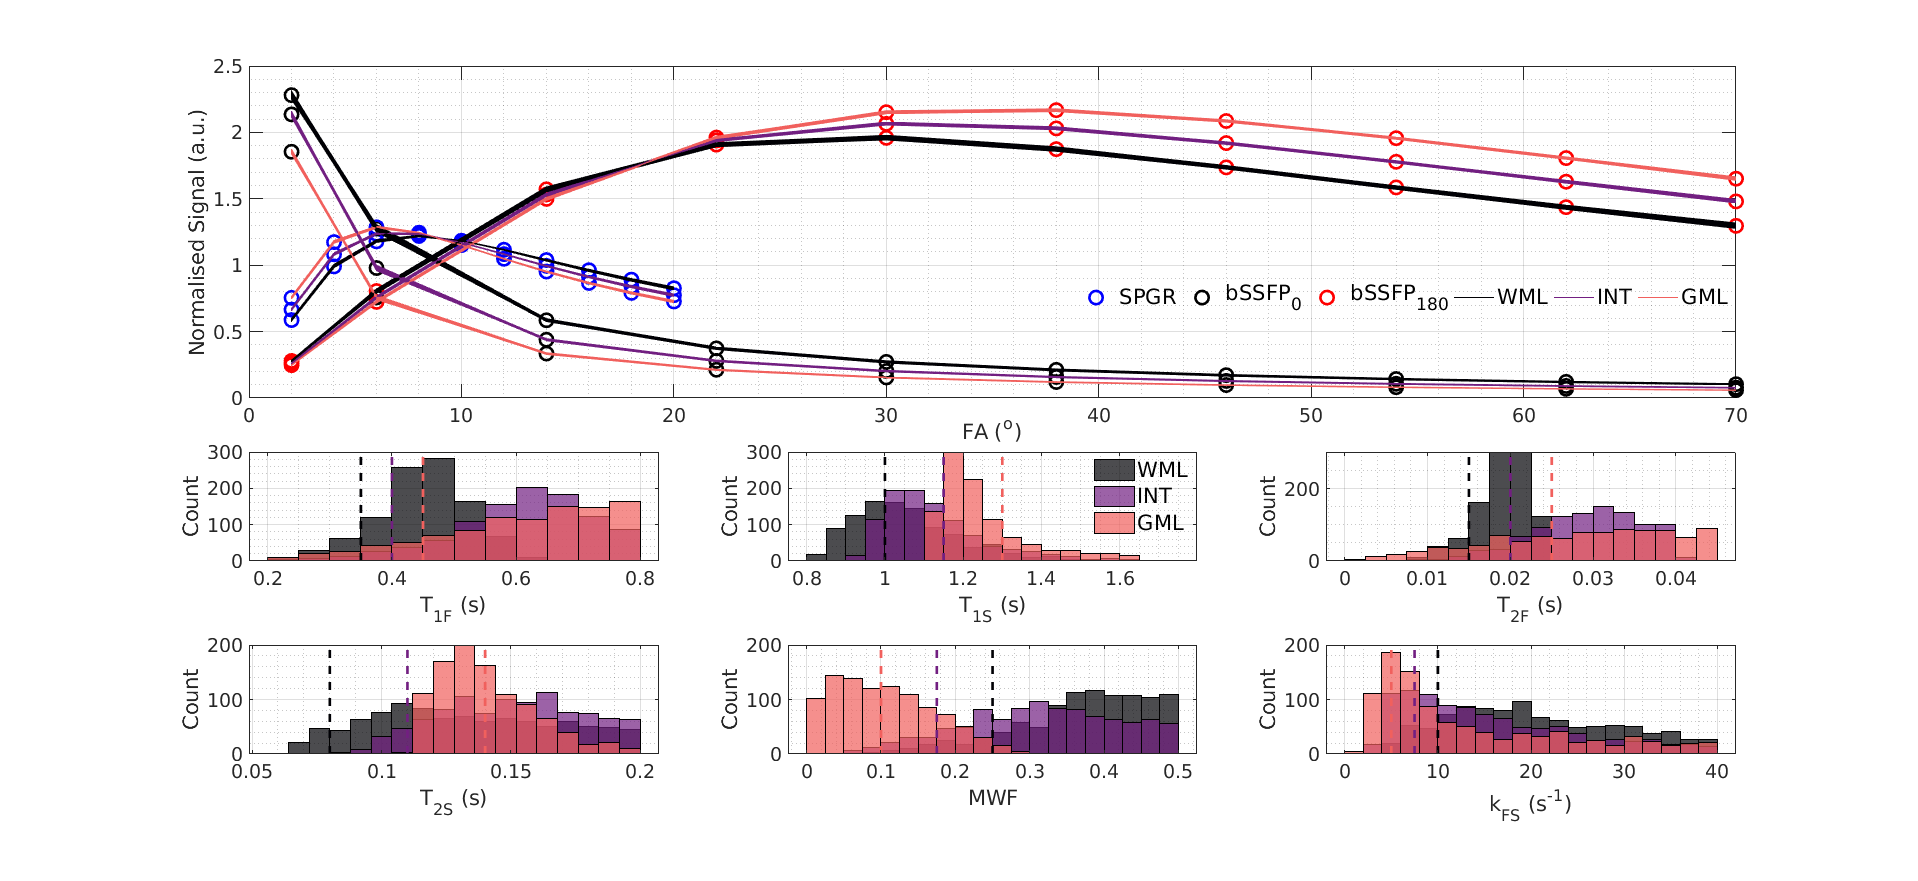
The 1000 highest likelihood solutions were analysed for the different tissue parameter sets in Table 1. Solution manifolds of these high-likelihood solutions were visualised by performing the dimensionality reduction method, kernel principal component analysis.11 This was repeated for a model excluding exchange and a single-pool case.
Lastly, we investigated SRC bound-sensitivity and search space sampling through Monte Carlo simulations, and compared parameter estimates to those obtained when fitting to identically acquired in-vivo data.
Results and Discussion
Figure 1 illustrates the challenge for mcDESPOT parameter estimation in the presence of exchange between modelled myelin water and intra/extracellular water pools: the fitting problem is highly degenerate. Although each tissue type yields distinct signals, their respective top solutions produce curves that are indistinguishable and represent a wide spread in underlying parameter values, especially for exchange rate, kFS. Figure 2 shows that these degenerate solutions form a complex hypersurface in the search space. This motivates comparison to a model excluding exchange, as has previously been considered by Bouhrara et al.12 In this instance, the search space is better behaved with the highest likelihood solutions and ground-truth now centrally located in the manifold, similar to the highly constrained single-pool case. However, a model excluding exchange is not subsequently considered due to literature evidence for its existence in biological tissue samples and a potential impact on MWF quantification.13,14
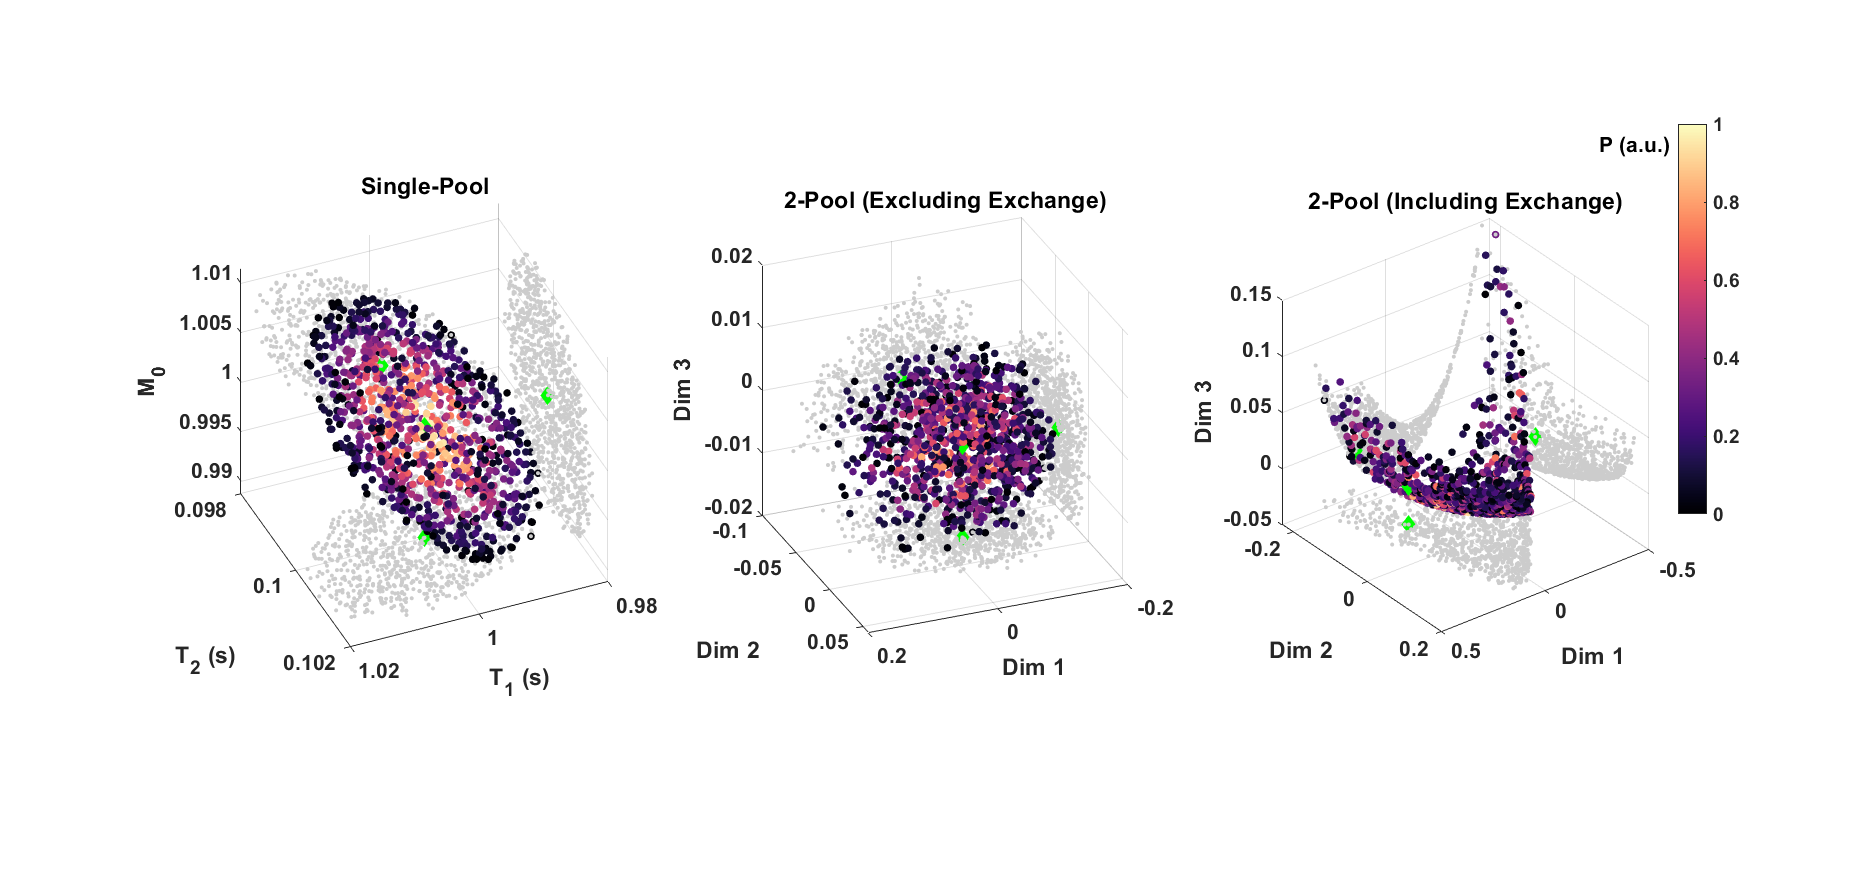
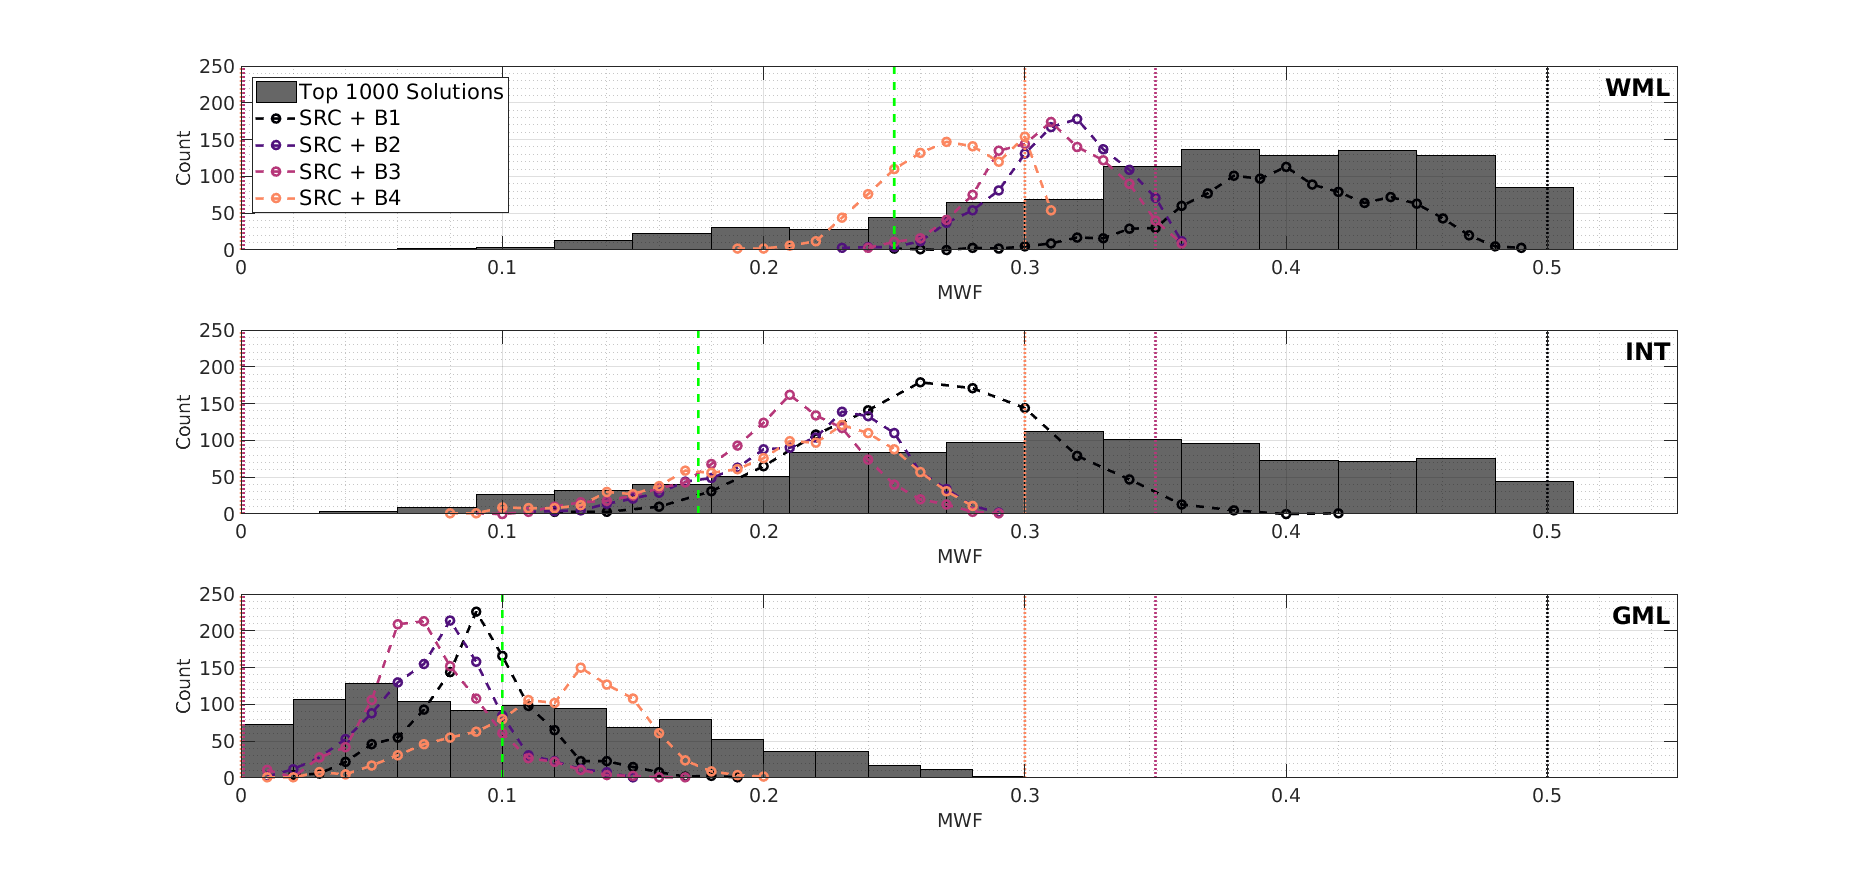
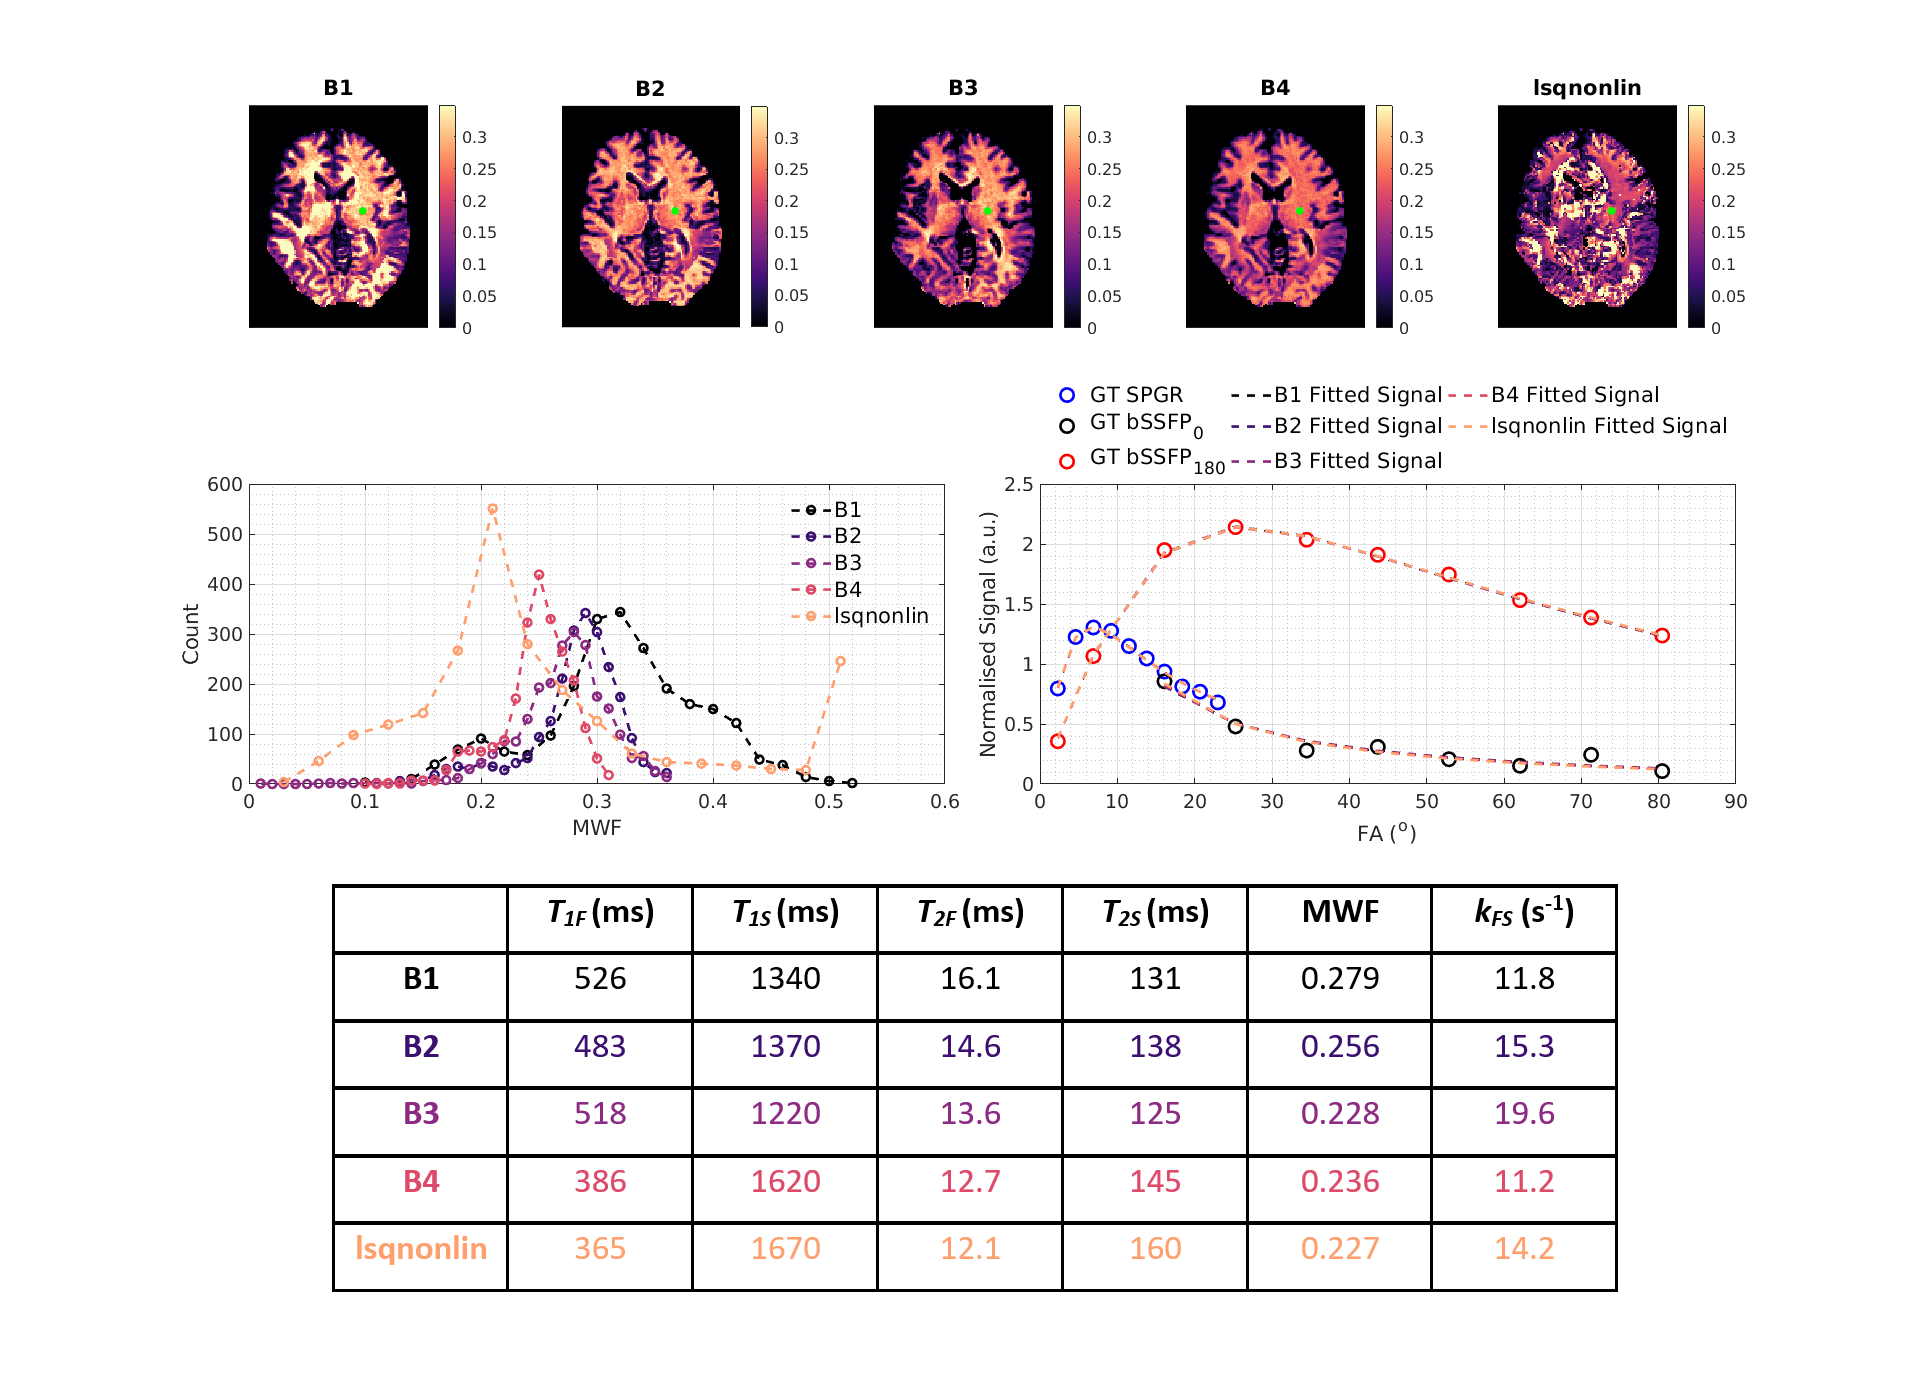
The choice of SRC bounds largely dictates where in the manifold the algorithm will converge. Note that the problem is not that some search bounds exclude the ‘correct’ solution - all bounds included the correct solutions. However, depending on which bounds are used, SRC consistently converges to the same part of the solution space, explaining why the observed variance in estimation is smaller than the true spread of possible degenerate solutions. This was confirmed by Monte Carlo simulations in Figure 3. Results from an in-vivo investigation are in qualitative agreement; Figure 4 shows four different MWF maps reconstructed from the same data but with SRC initialised using different bounds, plus non-linear least-squares fitting (‘lsqnonlin’ using B1). Qualitatively, SRC yields maps with GM-WM contrast whilst ‘lsqnonlin’ gives a less plausible result. Single voxel signal profiles indicate that the solutions are degenerate even though estimated parameters differ considerably; WM MWF histograms show similar behaviour to those in Figure 3. Since each solution is an apparently equally plausible fit to the data, it would not be possible to determine the ‘true’ solution from this analysis.
Conclusion
Our results suggest that mcDESPOT should not be considered an 'objective' measurement approach if the signal model includes exchange. Stable and reproducible results are possible using SRC, but model degeneracy means parameter estimates are functions of the acquisition and fitting algorithm. Hence, mcDESPOT studies are only directly comparable if the same acquisition scheme and fitting algorithm are used; full transparency of methods is necessary.Acknowledgements
This work is funded by the King’s College London & Imperial College London EPSRC Centre for Doctoral Training in Medical Imaging (EP/L015226/1). This work was supported by the Wellcome EPSRC Centre for Medical Engineering at Kings College London (WT 203148/Z/16/Z) and by the National Institute for Health Research (NIHR) Biomedical Research Centre based at Guy’s and St Thomas’ NHS Foundation Trust and King’s College London. The views expressed are those of the authors and not necessarily those of the NHS, the NIHR or the Department of Health.References
1. Deoni, S. C. L., Rutt, B. K., Arun, T., Pierpaoli, C. & Jones, D. K. Gleaning multicomponent T1 and T2 information from steady-state imaging data. Magn. Reson. Med. 60, 1372–1387 (2008).
2. Laule, C. et al. Myelin water imaging in multiple sclerosis: quantitative correlations with histopathology. Mult. Scler. J. 12, 747–753 (2006).
3. Zhang, J., Kolind, S. H., Laule, C. & Mackay, A. L. Comparison of myelin water fraction from multiecho T2 decay curve and steady-state methods. Magn. Reson. Med. 73, 223–232 (2015).
4. Deoni, S. C. L. Correction of main and transmit magnetic field (B0 and B1) inhomogeneity effects in multicomponent-driven equilibrium single-pulse observation of T1 and T2. Magn. Reson. Med. 65, 1021–1035 (2011).
5. Lankford, C. L. & Does, M. D. On the inherent precision of mcDESPOT. Magn. Reson. Med. 69, 127–136 (2013).
6. Anthony Hurley, S. & L Alexander, A. Assessment of mcDESPOT Precision Using Constrained Estimation. Proc. Intl. Soc. Mag. Reson. Med. (2014).
7. West, D. J., Teixeira, R. P. A. G., Tournier, J.-D., Hajnal, J. V. & Malik, S. J. Controlling magnetisation transfer and exchange effects in mcDESPOT relaxometry. Proc. Intl. Soc. Mag. Reson. Med. (2018).
8. Liu, F., Block, W. F., Kijowski, R. & Samsonov, A. A. Rapid multicomponent relaxometry in steady state with correction of magnetization transfer effects. Magn. Reson. Med. 75, 1423–1433 (2016).
9. Zhang, J., Kolind, S. H., Laule, C. & MacKay, A. L. How does magnetization transfer influence mcDESPOT results? Magn. Reson. Med. 74, 1327–1335 (2015).
10. Bouhrara, M. & Spencer, R. G. S. Improved determination of the myelin water fraction in human brain using magnetic resonance imaging through Bayesian analysis of mcDESPOT. Neuroimage 127, 456–471 (2016).
11. Mika, S. et al. Kernel PCA and De-Noising in Feature Spaces. Adv. Neural Inf. Process. Syst. 11, 536–542 (1999).
12. Bouhrara, M. et al. Analysis of mcDESPOT- and CPMG-derived parameter estimates for two-component nonexchanging systems. Magn. Reson. Med. 75, 2406–2420 (2016).
13. Dortch, R. D., Harkins, K. D., Juttukonda, M. R., Gore, J. C. & Does, M. D. Characterizing inter-compartmental water exchange in myelinated tissue using relaxation exchange spectroscopy. Magn. Reson. Med. 70, 1450–1459 (2013).
14. Levesque, I. R. & Pike, G. B. Characterizing healthy and diseased white matter using quantitative magnetization transfer and multicomponent T2 relaxometry: a unified view via a four-pool model. Magn. Reson. Med. 62, 1487–1496 (2009).
15. Deoni, S. C. L. & Kolind, S. H. Investigating the stability of mcDESPOT myelin water fraction values derived using a stochastic region contraction approach. Magn. Reson. Med. 73, 161–169 (2015).
Figures