0421
Brain tissue multi-compartment relaxometry - An improved method for in vivo myelin water imaging1Donders Institute for Brain, Cognition and Behaviour, Radboud University, Nijmegen, Netherlands
Synopsis
In this study, we propose an extension to GRE based myelin water fraction techniques based on 3-comparment models. The new model includes T1 and chemical exchange effects between a free water pool and a myelin water pool and can be fitted to a variable flip angle acquisition strategy. Furthermore, we demonstrate that it can both correct the T1 dependency in MWF, make the fitting procedure less ill-posed and more SNR efficient, resulting in robust estimation across subjects.
Introduction
Myelin Water Fraction (MWF) Imaging is a method to quantify the fraction of water existing in-between myelin lipid bilayers around axons in respect of the total water1. In multi-echo GRE (mGRE) based MWF, the signal is fitted using a 3-compartment model, where each compartment has an exponential decay (myelin water compartment having the shortest T2*) and a different frequency offset2-4. Multi-exponential fitting is an ill-posed process, thus mGRE MWF should be performed at the maximum SNR settings. As the myelin water signal recovers significantly faster than free water5, this might bias the MWF estimation (Fig.1A-C). Here we propose an extension to GRE-MWF that avoids this bias and deals with a less ill-posed fitting problem.Theory
Standard mGRE-MWF considers 3 water pools in white matter (WM)4: myelin water (MW), intra-axonal water (IW) and extracellular water (EW). With a variable flip angle acquisition strategy6, the signal measured for each flip angle $$$\alpha$$$, $$$S_{\alpha}$$$, can be modelled as:
$$S_{\alpha}(t)=\left[\sum_{n=\left\{MW,IW,EW\right\}}M_{0,n}\sin\alpha\frac{1-e^{-TR{\cdot}R_{1,n}}}{1-e^{-TR{\cdot}R_{1,n}}\cos\alpha}e^{t(-R_{2,n}^{*}+i\omega_{n})}\right]e^{i(\omega_{b}t+\psi)}$$
$$=\sum_{n=\left\{MW,IW,EW\right\}}SS_{\alpha,n}e^{t(-R_{2,n}^{*}+i\omega_{n})}e^{i(\omega_{b}t+\psi)}[Eq.1]$$
Each pool has a different proton density, $$$M_{0,n}$$$ , frequency shift $$$\omega_{n}$$$, longitudinal, $$$R_{1,n}$$$, and transverse relaxation rates, $$$R_{2,n}^{*}$$$ . $$$\omega_{b}$$$ and $$$\psi$$$ represent the background field and initial phase offset. Preliminary analysis (data not shown) suggested that imperfect RF spoiling (particularly for large flip angles) and the presence of inter-compartmental water exchange cannot be ignored in the steady state calculation while IW and EW could be assumed to have the same $$$R_{1}$$$. These three factors can be accounted for using an Extended Phase Graph (EPG-X7) approach where two pools are considered, MW and free water (OW=IW+EW)8. In Eq.1 the steady-state signal is given by:
$$SS_{\alpha,MW or IW,EW}=EPGX(M_{IW+EW},R_{1,IW+EW},M_{WM},R_{1,MW},k,\alpha,TR)[Eq.2]$$
where k is the exchange rate from the OW to MW7.
Method
All scans were performed at 3T (Siemens, Erlangen, Germany) using a 32-channel array in 6 healthy volunteers. The imaging protocol consisted of:
- Whole-brain T1 scan using MP2RAGE9 with res=1mm isotropic, Tacq=4mins;
- 2D-MB EPI-DWI multiband=3, isotropic resolution 1.6mm, TR/TE=3350/71.20ms, 2-shell (b=0/1250/2500 s/mm2,17/165/165 measurements), Tacq=15mins;
- Monopolar 3D mGRE with 12 echoes, TR/TE=46/2.15:3.05:35.70ms, res=1.8mm isotropic, $$$\alpha$$$=[5,10,20,30,40,50,70]° and GRAPPA=2. Six additional datasets with $$$\alpha$$$=20° were acquired (order was randomised), Tacq=3.5mins per flip angle.
Furthermore, B1 map was acquired to correct B1+ inhomogeneity when fitting Eq.1 and 2.
MP2RAGE images were segmented using FSL (www.fmrib.ox.ac.uk). DWI images were pre-processed in FSL and DTI was used to estimate the principal fibre direction.
All (mGRE, and processed DWI and MP2RAGE) data were co-registered to the middle mGRE acquisition using ANTs10. Eddy current artifacts, prevalent in the first echo of the mGRE phase data, were corrected using first-order polynomial fit. The model described in Eq.1 and 2 was fitted to the complex-valued 7 flip angles data in a voxel-wise manner. Each acquisition was assumed to have a separate $$$\omega_{b}$$$ and $$$\psi$$$ (14 parameters) to account for small variations in head position, resulting on 26 parameters to be estimated. The 7 flip angle 20 (Ernst angle) mGRE data were averaged (after co-registration, eddy current and frequency correction) and fitted to a standard 3-pool model4 consisting of 10 parameters.
To evaluate the robustness of the most relevant parameters (MWF, R2* and R1) of the different water compartments, histograms of these parameters within WM and grey matter (GM) masks were compared across subjects and across regions
Results and Discussion
Figs.2&3 demonstrates the quality of volumetric parameter estimation in 2 subjects. The proposed model produces MWF maps and frequency maps with higher SNR than the standard approach (Fig.2), with highly-myelinated fibres appearing more pronounced. Additionally, our method allows the computation of two R1 maps with different spatial patterns.
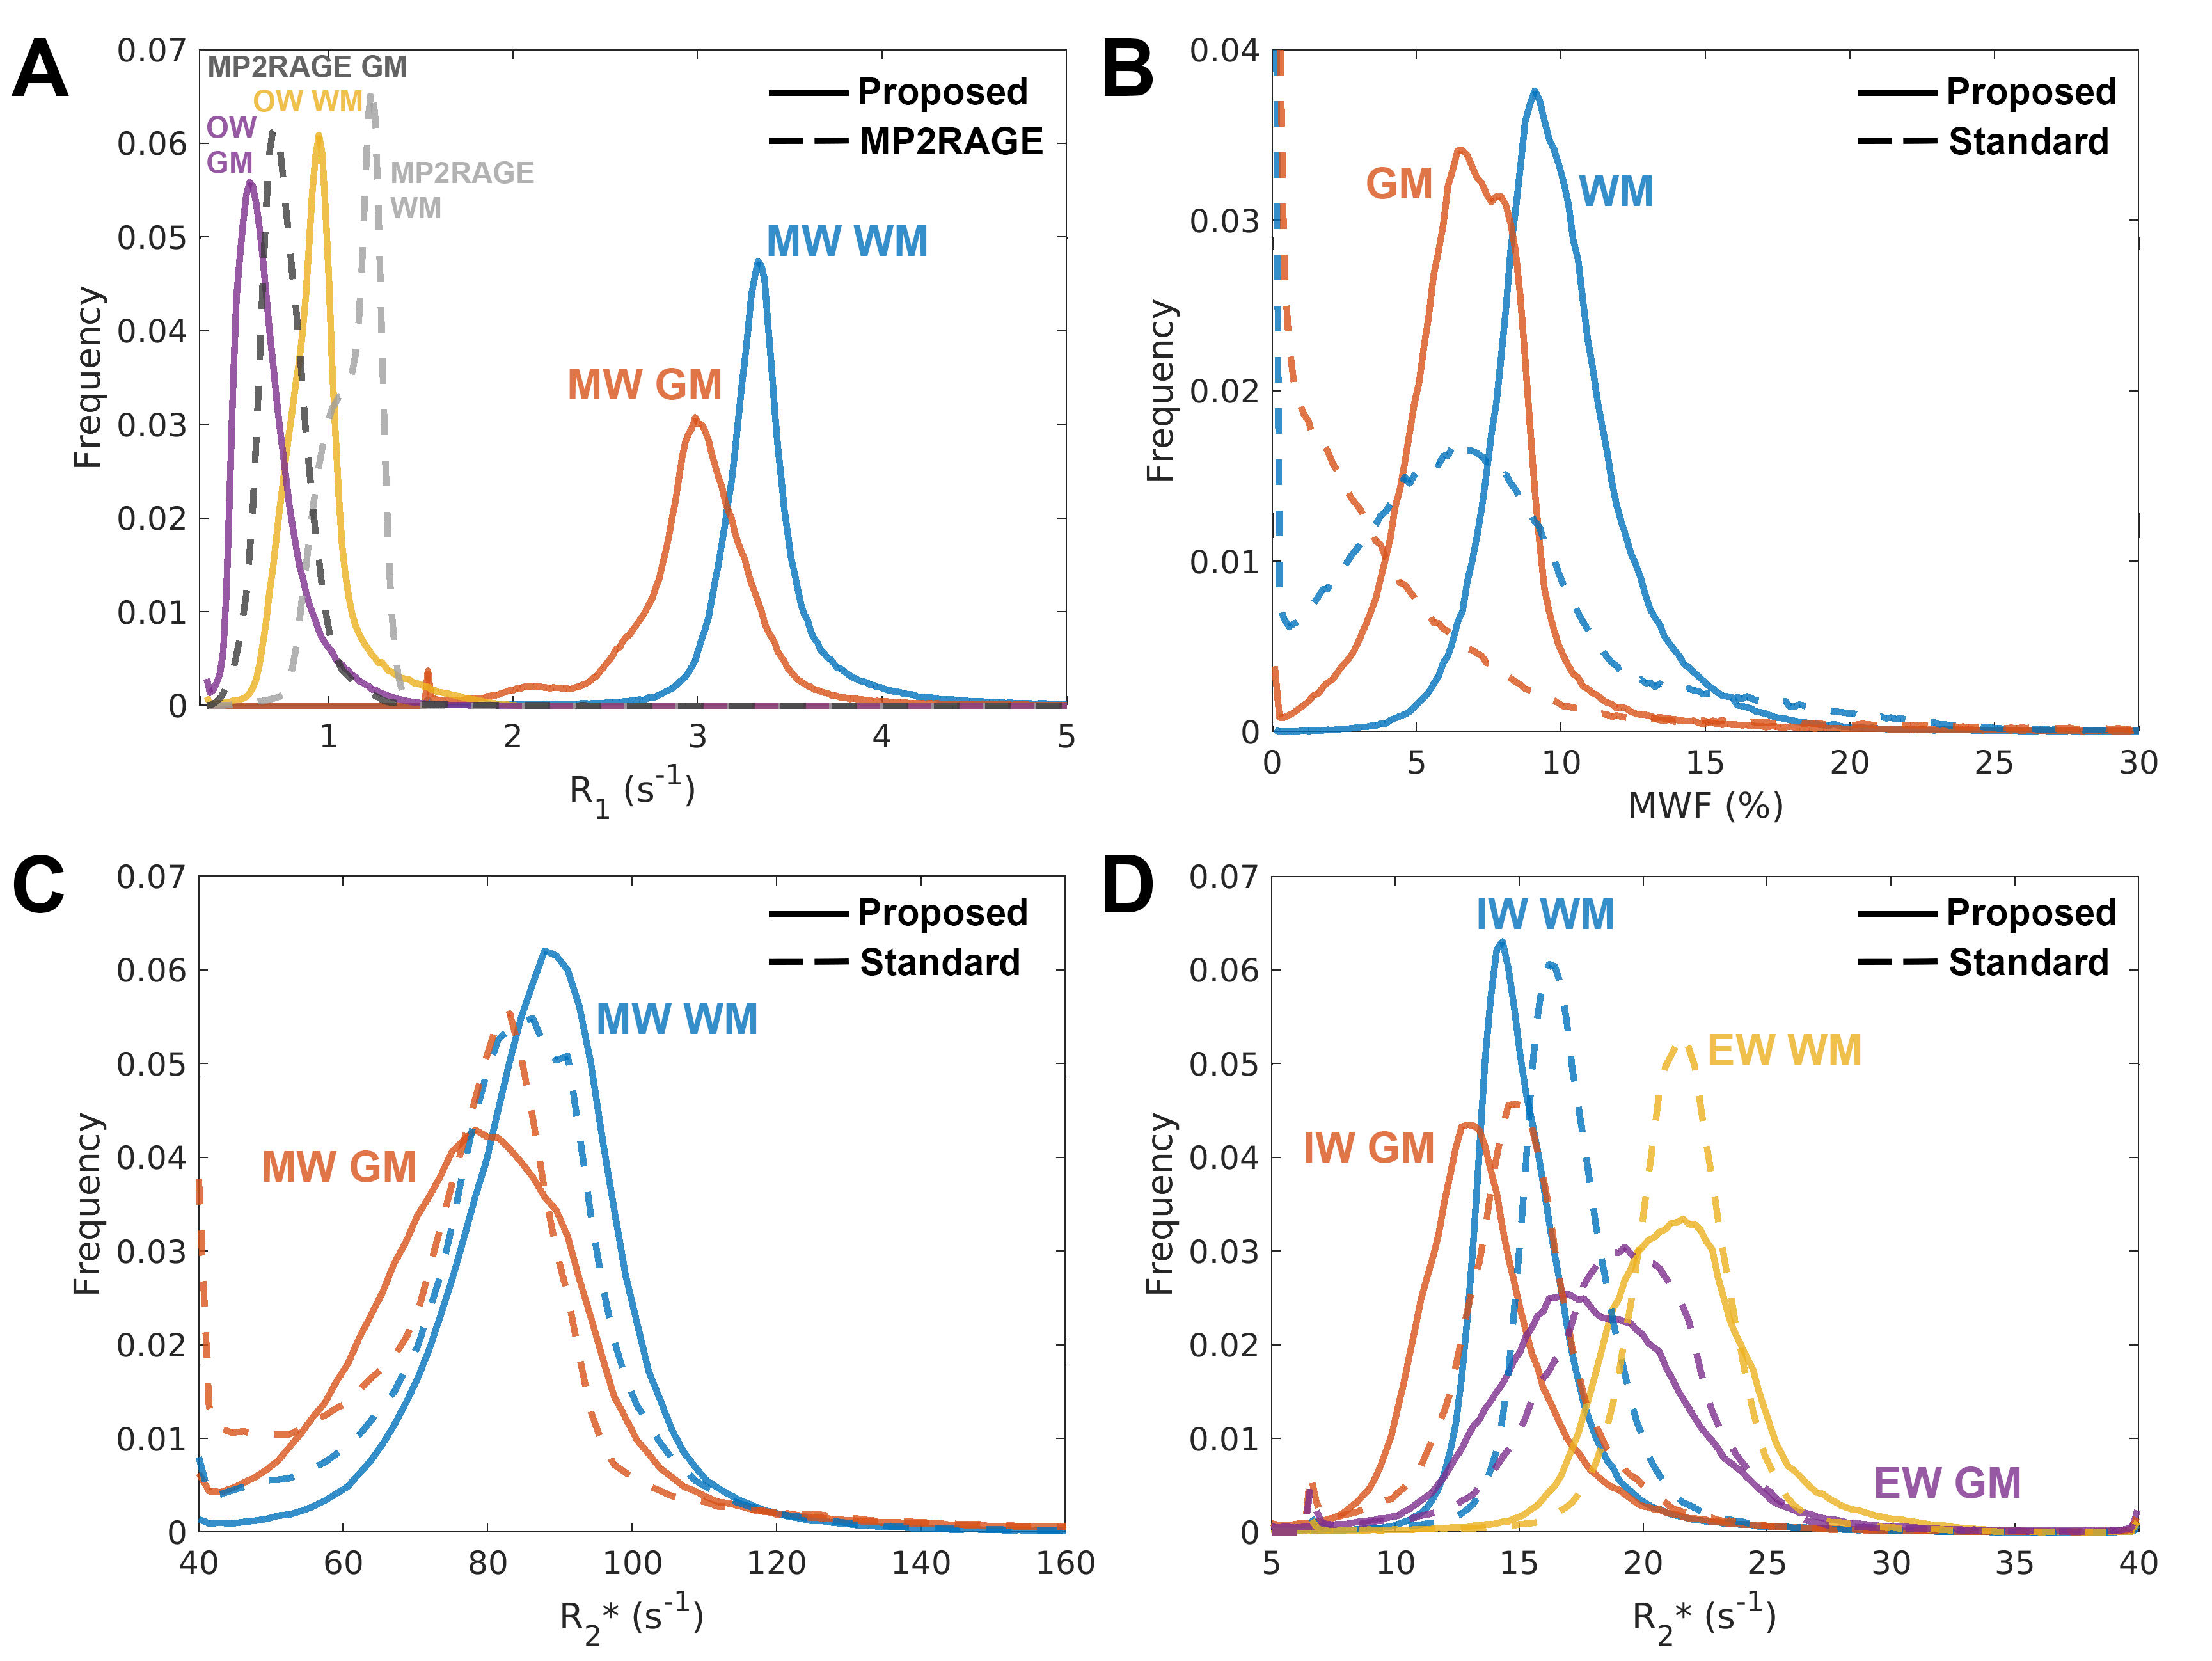
Fig.4 shows the histograms of the different compartments R1 (4A-B), R2* (4C-E) as well as MWF (4F) in WM and GM for all subjects, demonstrating the reproducibility of the measurements.
As expected, R1 values of free water are shorter than those predicted by the MP2RAGE, while the myelin water is higher than both and less distinguishable between grey and white matter (Fig.5A). Surprisingly, MWF estimated by our method was higher in both GM and WM than in the standard mGRE-MWF, with our histograms distributions being significantly narrower (Fig.5B). R2* maps of each compartment have an increased contrast between GM and WM in the proposed method.
Conclusion
Multi-compartment relaxometry can improve the SNR of MWF maps and shows reproducible findings across subjects, opening the possibility to, in future studies, increase the spatial resolution. While the free water R1 map has been hypothesized insensitive to local macromolecular content of brain tissues11,12, the myelin water R1 and R2* could reveal properties of the myelin environment which should be the focus of future studies.Acknowledgements
This work is part of the research programme with project number FOM-N-31/16PR1056/RadboudUniversity, which is financed by the Netherlands Organisation for Scientific Research (NWO).References
- MacKay, A. et al. In vivo visualization of myelin water in brain by magnetic resonance. Magn Reson Med31,673–677 (1994).
- van Gelderen, P. et al. Nonexponential T2* decay in white matter. Magn Reson Med67,110–117 (2011).
- Du, Y. P. et al. Fast multislice mapping of the myelin water fraction using multicompartment analysis of T2* decay at 3T: A preliminary postmortem study. Magn Reson Med58,865–870 (2007).
- Nam, Y., Lee, J., Hwang, D. & Kim, D.-H. Improved estimation of myelin water fraction using complex model fitting. Neuroimage116,214–221 (2015).
- Oh, S.-H. et al.Direct visualization of short transverse relaxation time component (ViSTa). Neuroimage83,485–492 (2013).
- Deoni, S. C. L., Rutt, B. K. & Peters, T. M. Rapid combined T1 and T2 mapping using gradient recalled acquisition in the steady state. Magn Reson Med49,515–526 (2003).
- Malik, S. J., Teixeira, R. P. A. G. & Hajnal, J. V. Extended phase graph formalism for systems with magnetization transfer and exchange. Magn Reson Med3,125 (2017).
- Lee, H., Nam Y., Kim D. & Lee H., Effect of T1 on Multi-echo Gradient Echo based Myelin Water Fraction. In: Proceedings 25 Annual Meeting ISMRM 25, 1932 (2017)
- Mussard E, Hilbert T, Meuli R, Thiran J-P & Kober T. Accelerated MP2RAGE imaging using sparse iterative reconstruction. In: Proceedings 24 Annual Meeting ISMRM 24, 4216 (2016)
- Avants, B. B. et al.A reproducible evaluation of ANTs similarity metric performance in brain image registration. Neuroimage54,2033–2044 (2011).
- van Gelderen, P., Jiang, X. & Duyn, J. H. Effects of magnetization transfer on T1 contrast in human brain white matter. Neuroimage128,85–95 (2016).
- Yeatman, J. D., Wandell, B. A. & Mezer, A. A. Lifespan maturation and degeneration of human brain white matter. Nat Commun5,4932 (2014).
Figures