0419
Magic-Angle Effect on In Vivo T2 Mapping of CartilageVictor Casula1,2, Olli Pekka Aro1, Petri Paakkari3, Stefan Zbyn4,5, Mika Nevalainen1,6, Mikko J Nissi1,7, and Miika T Nieminen1,2,6
1Research Unit of Medical Imaging, Physics and Technology, University of Oulu, Oulu, Finland, 2Medical Research Center, University of Oulu and Oulu University Hospital, Oulu, Finland, 3Department of Applied Physics, University of Eastern Finland, Kuopio, Finland, 4Center for Magnetic Resonance Research, Minneapolis, MN, United States, 5Department of Radiology, University of Minnesota, Minneapolis, MN, United States, 6Department of Diagnostic Radiology, Oulu University Hospital, Oulu, Finland, 7Department of Applied Physics, University of Eastern Finland, Oulu, Finland
Synopsis
Introduction
T2 mapping is the most widely applied quantitative method for assessment of articular cartilage and has proved to increase the sensitivity of clinical protocols in detecting cartilage lesions1. T2 is dependent on collagen fiber orientation with respect to the main magnetic field2,3,4, resulting in a potential source of inaccuracies in cartilage assessment. This is particularly critical in vivo where the geometry of the measurements cannot be controlled due to the anatomy of the joint. The aim of this study was to investigate the magic-angle effect on T2 relaxation at clinical magnetic field in knee articular cartilage in vivo.Methods
Eleven knees from young non-symptomatic volunteers (N=8, age range 22-49 years) with no clinical signs of osteoarthritis were scanned at 3 T (Siemens Skyra, Siemens, Erlangen, Germany) using a 32-channel spine matrix coil integrated into the scanner table and an 18-channel body matrix coil. The MRI protocol consisted of quantitative T2 mapping (MESE-sequence: TR = 1680 ms, five TEs between 13.8-69 ms, resolution = 0.6x0.6x3.0 mm3). Each subject was scanned lying on the same side of the knee of interest. The measurements were repeated with fully extended knee (normal direction of the tibial cartilage surface nearly parallel to the main magnetic field) and with the knee at a 90-degree flexion and the lower leg bent (normal direction of the tibial cartilage surface oriented near the magic-angle). An MRI-compatible in-house designed 3-D-printed brace was used to keep the knee flexion angle constant. Articular cartilage was segmented manually. T2 relaxation time of tibial cartilage were calculated pixel-by-pixel using an in-house Matlab-based software. Mean T2 values were obtained from three regions of interest (ROIs) manually defined in the load bearing area for the full-thickness and the superficial and deep halves of cartilage. Statistically significant differences between T2 measured with straight and flexed knee were assessed using Mann-Whitney nonparametric test in Matlab (MathWorks Inc., MA, USA).Results
T2 relaxation time demonstrated large variations depending on cartilage orientation in the magnetic field, with larger values observed when the angles between the articular surface and B0 were closer to the magic-angle (Fig.1). Means and standard deviations of the angles between tibial cartilage surface and B0 were 7±5 degrees for measurements with straight knees, and 52±8 degrees for flexed knees. Differences were significant for full-thickness ROI (difference in mean T2 ± standard deviation = 43% ± 15%, p-value < 0.0001), deep ROI (102% ± 43%, p-value < 0.0001) and superficial ROI (18% ± 13%, p-value = 0.01) (Fig.2).Discussion
Residual dipolar interactions between restricted water protons are modulated by the orientation of the collagen fibers with respect to the main magnetic field. The findings of this study show significantly longer T2 relaxation time values at orientations close to 55-degree angle, the “magic-angle”, where the minimum is attained for dipolar interaction resulting in longer transverse relaxation times. As expected, the greatest differences were found in deep ROIs, which mainly contains highly ordered collagen fibers from radial zone. Differences in deep ROIs ranged between 60-200%. On the contrary, differences were smaller in the superficial ROIs (5%-40%). This is also not a surprising result as this ROI is a mixture of heterogenous regions: a relatively isotropic transitional zone, and two anisotropic zones with different fiber orientations, the tangential and the radial zone. Previous ex vivo studies have demonstrated strong angular dependence of cartilage T24,5,6. At 3 T, the ex vivo T2 values have been shown to increase by a minimum of 20%5 up to 200%6 in human articular cartilage oriented from 0 to 55 degrees with respect to B0. Several in vivo studies at clinical fields have estimated the magic-angle effect by comparing T2 values of different regions of cartilage, exploiting the natural curvature of femoral condyles2,7,8. However, in those studies, the topographical variation of T2 values in cartilage could not be accounted for. In the present study the magic-angle effect was demonstrated by measuring T2 in the same cartilage region at different orientations within the main magnetic field. The differences observed were larger than those estimated in prior in vivo studies, and similar to those recently reported in vitro by Shao et al.6. These results indicate that the magic-angle effect represents a significant confounding factor for quantitation of T2 in vivo.Conclusion
These findings provide evidence of significant variations due to magic-angle effect in cartilage T2 values measured in vivo at clinical field strength. Magic-angle effect may produce variations larger than those caused by pathological changes and, if not taken into account, limit the discriminatory power of T2 mapping for cartilage degeneration.Acknowledgements
Support from the Jane and Aatos Erkko Foundation and Academy of Finland (grants #285909) is gratefully acknowledged.References
- Kijowski R et al. (2013). Radiology 267(2): 503–513.
- Mosher T et al. (2001). American Journal of Roentgenology 177:3, 665-669.
- Xia Y et al. (2000). Investigative Radiology. 35(10):602-621.
- Hanninen N et al. (2017). Sci Rep. 7(1):9606.
- Li X et al. (2011). Magn Reson Imaging 29(3):324–334.
- Shao H et al. (2017). Osteoarthritis and Cartilage 25(12):2022-2030.
- Wang L, Regatte RR. Acad Radiol. 2015;22(1):87-92.
- Nissi MJ et al. (2015). ISMRM 23:1193, Toronto, Canada.
Figures
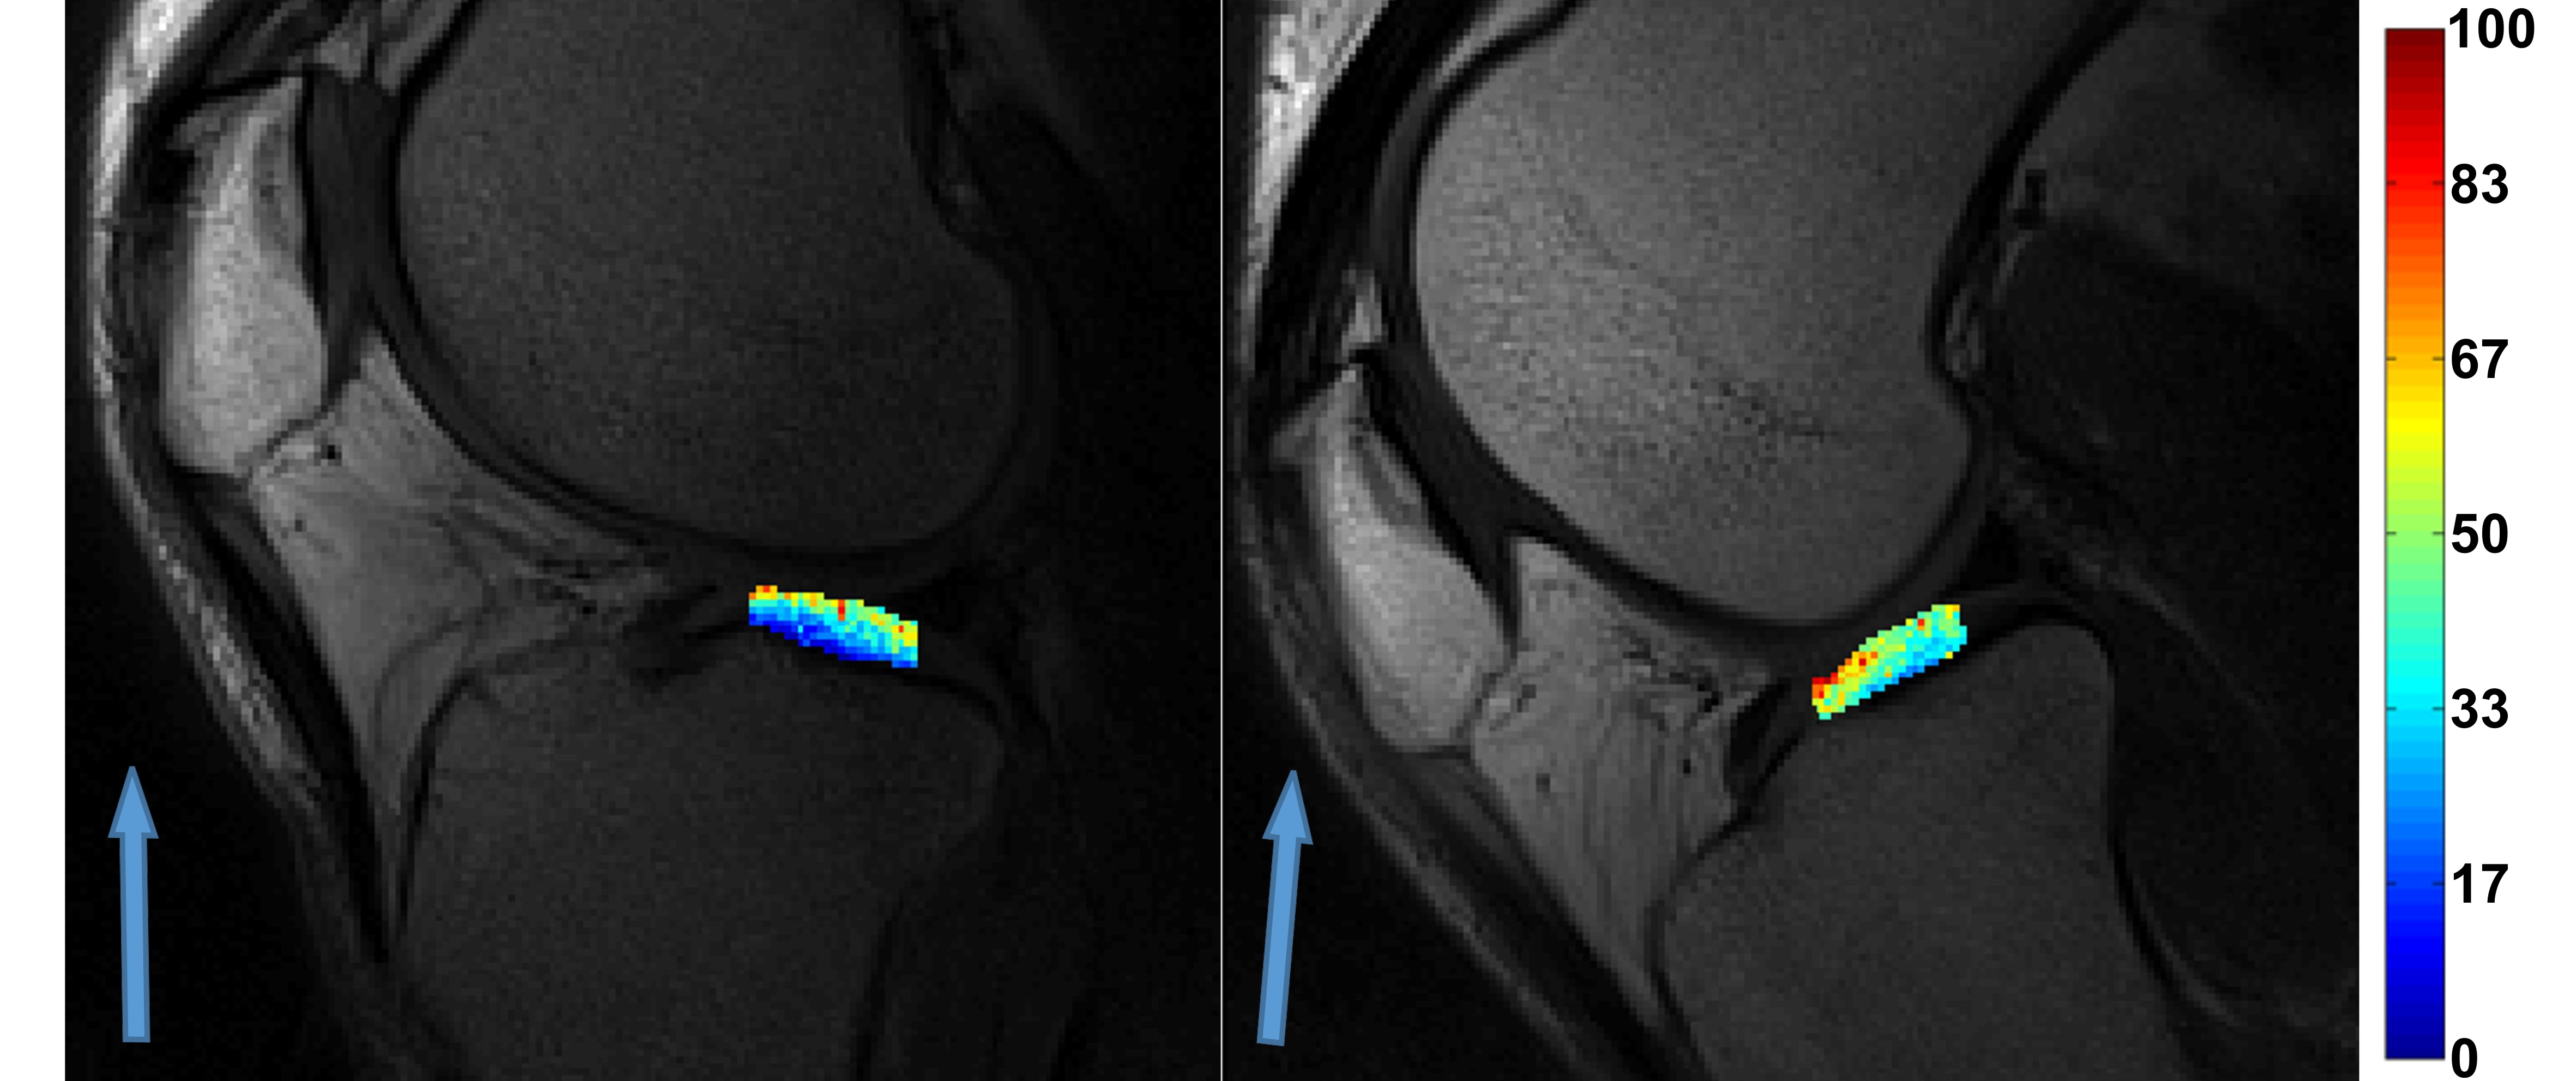
Representative T2 maps (in ms) of central tibial
cartilage obtained from a healthy 39-year-old man with fully extended knee and normal
of the cartilage surface nearly parallel to B0 (left), and flexed knee with
normal of cartilage surface oriented close to the magic-angle (right). The blue
arrows represent the direction of B0.
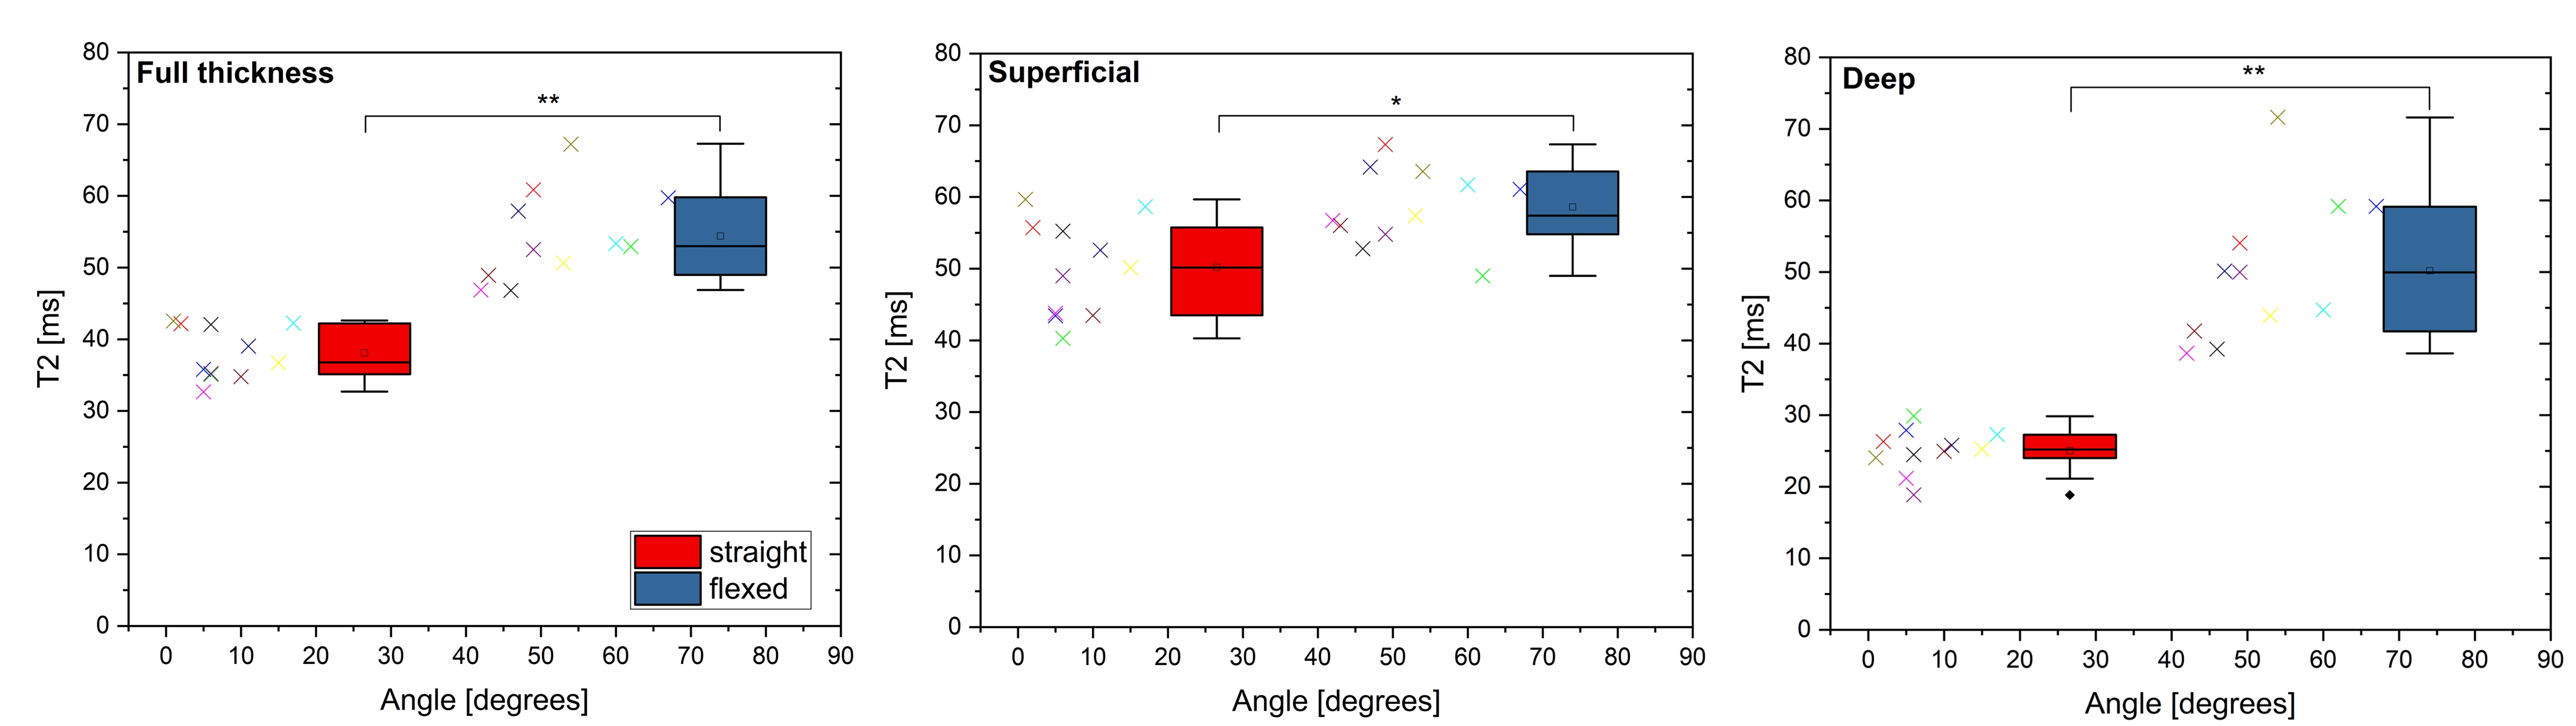
Figure 2. Boxplots showing T2 of tibial cartilage measured with straight knee (normal of the cartilage surface nearly parallel to B0, red bars) and with flexed knee (orientation close to the magic-angle, blue bars), for full thickness, superficial and deep ROIs. Each point represents a single measurement (different colors for different knees). ** p-value < 0.0001, * p-value = 0.001.