0416
Quantitative MR Relaxation Imaging of Cartilage Compositional Response to Exercise1Department of Radiology, University of Cambridge, Cambridge, United Kingdom, 2Independent Clinical Imaging Consultant, Munich, Germany, 3Experimental Medicine Imaging, GlaxoSmithKline, London, United Kingdom
Synopsis
We introduce a method for imaging changes in healthy knee cartilage composition after joint loading with exercise that could be extended for use in subjects with joint disease. Six healthy participants were imaged before and at multiple time-points after a mild joint loading exercise. Our study demonstrates that quantitative MR mapping of T1ρ and T2 relaxation times of femorotibial cartilage is repeatable and able to demonstrate changes in cartilage composition in response to short-term joint loading exercise. Imaging cartilage compositional recovery after joint loading may present a new way of detecting early alterations in cartilage homeostasis associated with osteoarthritis.
Introduction
Quantitative MRI signal relaxation properties such as T1ρ and T2 have been shown to be sensitive to variations in macromolecular density such as that of collagen and proteoglycans, as well as water content of articular cartilage1,2. Cartilage compression and deformation in response to exercise can affect quantitative MRI measurements, with previous studies showing compositional (T2) and volumetric cartilage recovery within 50-90 minutes after exercise2–4. Short-term joint loading effects prior to imaging acquisition have been described as a confounder in quantitative MRI5,6. However, the diagnostic utility of short-term compositional changes, as detected by MRI, has not been assessed.
The aim of this study was to determine the extent of exercise-related changes on mean T1ρ and T2 relaxation values of femorotibial cartilage in healthy participants and to ensure we had exercise-related changes of sufficient magnitude for this to be a potentially useful imaging tool in osteoarthritic subjects.
Methods
All participants were imaged on a 3.0 T MRI system (MR750 GE Healthcare, Waukesha, WI, USA) using an 8-channel transmit/receive knee coil and had no knee pain, nor known history of joint disorders. Imaged knees were unloaded for approximately 30 minutes prior to the imaging session to minimise short-term loading effects on the cartilage.
Six participants (age range: 23 – 36; 4 males, 2 females) were imaged to evaluate cartilage response after exercise. The study design consisted of T1ρ and T2 relaxation imaging before exercise, and at multiple time-points after exercise. The exercise part involved five minutes of stepping onto a 24cm high step-stool with one leg and stepping down onto the other side of the step-stool with the leg to be imaged.
The MR protocol before exercise included a 3D spoiled gradient echo anatomical scan for cartilage morphological assessment, T1ρ imaging using a 3D FSE pulse sequence with +90°:rotary spin-lock:-90° preparation (TR=1565ms, TSL=1,10,20,35ms, scan time=5:23min) and T2 imaging using a 3D FSE pulse sequence with T2-preparation (TR=1580ms, TE=6.5,13.4,27.0,40.7ms, scan time=5:25min). The following parameters were identical for the T1ρ and T2 pulse sequences: field-of-view=160x144mm2, matrix size=320x256 interpolated to 512x512, slice thickness=3mm, number of slices per TSL/TE=72. The T1ρ and T2 pulse sequences were unchanged for the acquisitions at multiple time-points after exercise.
Three participants (aged 22, 31, 31; 2 males, 1 female; two from the cohort above, one different) were imaged repeatedly without performing exercise to assess the reproducibility of T1ρ and T2 relaxation imaging, using the same pulse sequences as those described above.
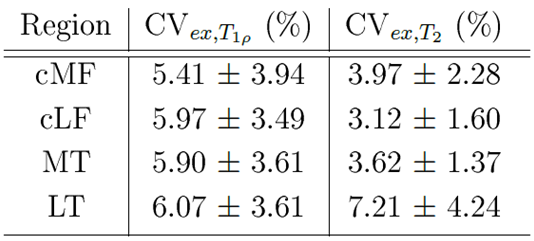
The reproducibility and the extent of exercise-related changes on mean T1ρ and T2 values were assessed by calculating the root-mean-squared average coefficients of variation (RMS-CVrep and RMS-CVex).
T1ρ and T2 maps were calculated by fitting the mono-exponential decay function to the signal intensities (voxel-by-voxel) using a linearised least squares algorithm. Compartmental analysis was performed by drawing regions-of-interest (ROIs) over the lateral and medial central femoral condyle (cLF/cMF) and the lateral and medial tibial cartilage (LT/MT). Mean T1ρ and T2 values were calculated from ROIs drawn on four consecutive slices to increase reliability.
Results
The determined test-retest RMS-CVrep and exercise-related RMS-CVex for T1ρ and T2 from all four compartmental ROIs (cMF, cLF, MT and LT) are presented in Table 1 and 2, respectively.
Participant specific changes in compartmental T1ρ and T2 after exercise are shown in Figures 1.
Discussion
The results demonstrate acceptable test-retest repeatability in all compartments for both T1ρ and T2 with CVreps ≤ 3.70%. Additionally, all participants demonstrated exercise-related responses in T1ρ and T2 relaxation values.
Less variability was seen with T2 values after exercise, suggesting that T2 is a less sensitive biomarker. Mean T1ρ changes after exercise (range: +3.00 to -7.09ms) were similar to those seen between osteoarthritic and healthy patients (≈6.5ms)7, which suggests that these exercise-related effects should be determined in order to improve the reliability of T1ρ measurements for detecting disease.
While the study was limited in the number of participants, the results suggest that the exercise does create an exercise-related response in T1ρ with the variability between pre- and post-exercise relaxation values being almost double the magnitude of the T1ρ test-retest variability in all compartments. This exercise is considered feasible for use in patients with joint pain, as it is short and of limited duration with minimal strain. However, further investigation into the reliability of the proposed method and confirmation in more healthy subjects are required.
Conclusion
Different temporal exercise-related changes as reflected on T1ρ and T2 compositional imaging between healthy and osteoarthritic participants may present a way of investigating early changes in cartilage physiology with improved sensitivity compared to current methods.Acknowledgements
This work was supported by GlaxoSmithKline, Addenbrooke's Charitable Trust, and the National Institute of Health Research Cambridge Biomedical Research Centre.References
1. Liess, C., Lüsse, S., Karger, N., Heller, M. & Glüer, C. G. Detection of changes in cartilage water content using MRI T2-mapping in vivo. Osteoarthr. Cartil. 10, 907–913 (2002).
2. Van Rossom, S. et al. Knee cartilage thickness, T1ρ and T2 relaxation time are related to articular cartilage loading in healthy adults. PLoS One 12, 1–16 (2017).
3. Eckstein, F., Tieschky, M., Faber, S., Englmeier, K. H. & Reiser, M. Functional analysis of articular cartilage deformation, recovery, and fluid flow following dynamic exercise in vivo. Anat. Embryol. (Berl). 200, 419–424 (1999).
4. Kessler, M. A., Glaser, C., Tittel, S., Reiser, M. & Imhoff, A. B. Recovery of the menisci and articular cartilage of runners after cessation of exercise: Additional aspects of in vivo investigation based on 3-dimensional magnetic resonance imaging. Am. J. Sports Med. 36, 966–970 (2008).
5. Sitoci, K. H., Hudelmaier, M. & Eckstein, F. Nocturnal changes in knee cartilage thickness in young healthy adults. Cells Tissues Organs 196, 189–194 (2012).
6. Coleman, J. L. et al. Diurnal Variations in Articular Cartilage Thickness and Strain in the Human Knee. J Biomech 46, 541–547 (2013).
7. Li, X. et al. In vivo T1rho and T2 Mapping of Articular Cartilage in Osteoarthritis of the Knee Using 3 Tesla MRI. Osteoarthr. Cart. 15, 789–797 (2007).
Figures