0413
Phosphocreatine recovery in the human tibialis anterior after dynamic exercise shows a proximo-distal gradient, which is not explained by acetylcarnitine differences.1Radiology and Nuclear Medicine, Radboud university medical center, Nijmegen, Netherlands
Synopsis
The phosphocreatine (PCr) recovery rate of the tibialis anterior muscle after isometric exercise shows a strong gradient along the length of the muscle. In this study we demonstrate that this also holds for dynamic exercise of the TA. To further examine if mitochondrial metabolism is involved we determined acetylcarnitine (AC) levels along the length of the TA, but no differences were detected. Together with previous correlations found for blood oxygenation by NIRS experiments and perfusion by IVIM we conclude that muscle perfusion and oxygenation are main components determining the PCr recovery gradient in the TA.
Purpose
The phosphocreatine (PCr) recovery rate of muscles after exercise (kPCr), reflecting oxidative capacity1, varies between subjects2,3 and muscle types2–4. We recently demonstrated that kPCr of the tibialis anterior (TA) muscle after isometric exercise also varies along the length of the muscle 5. In this study we examined if this also holds for dynamic exercise of the TA.
Acetylcarnitine (AC) is a compound buffering acetyl groups involved in mitochondrial metabolism. AC can be readily measured in human muscles by 1H MRS at long echo times and in this way it was demonstrated that resting acetylcarnitine levels are positively associated with PCr recovery rates6. As kPCr over the TA after exercise showed considerable variations we hypothesized that acetylcarnitine levels may also differ along the length of the TA.
Materials and Methods
Volunteers: Five volunteers participated in the MRS exams with dynamic exercise (age: 31 ± 4 years; BMI: 21.3 ± 1.6 kg/m2). Acetylcarnitine levels in the TA were obtained of 3 volunteers (age: 30±1y; BMI: 21.4±1.4kg/m2). In one volunteer these levels were determined at 2 different occasions.
MR acquisition:
All MR measurements were performed on a 3T MR system (Prisma Fit, Siemens).
31P MRS: A 1H/31P birdcage coil (Rapid) for transmission and a home-built ladder-shaped 31P-phased- array coil containing five coil elements was positioned on the TA for reception (size=4x4.5cm each, signal localization through the coil element sensitivity profile). The in-bore exercise consisted of a dynamic ankle dorsiflexion exercise (frequency: 2Hz), starting at 10% MVC and incrementally increasing with 10% MVC every 30 sec. 31P MR spectra (TR: 2.06s, 2 averages per spectrum, 48° Ernst angle excitation, 1H-31P NOE enhanced) were obtained for 20min36s during 1min rest, the dynamic exercise until exhaustion, and the recovery period.
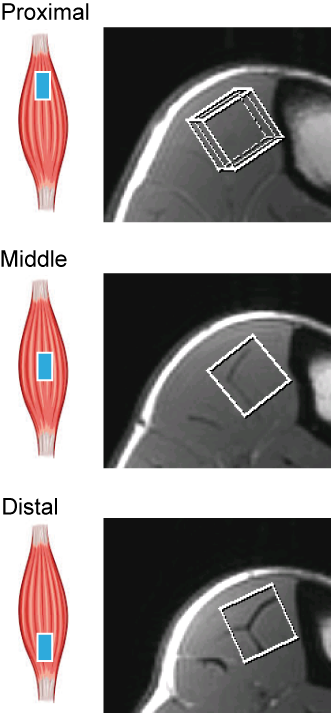
1H MRS: A 15-channel Tx-Rx knee coil was used covering the whole TA. An sLASER sequence was used to localise a voxel (17x17x40 mm). Spectra were measured from three voxels, one voxel placed in the middle of the TA and the second and third 5 cm more distally or proximally, respectively (Fig.1), avoiding contamination by subcutaneous fat and the extensor digitorum. TE was 350 ms, TR 6 sec and 64 to 128 scans were averaged.
Post-processing:
31P MRS: phosphor resonances were fitted with AMARES/jMRUI (Lorentzians). kPCr was fitted with a mono-exponential model5.
1H MRS: The signals of creatine (Cr) at 3.03 ppm and of AC at 2.13 ppm were fitted in jMRUI (Lorentzians) and the integrals corrected for T2 and for a short T2 component in the Cr signal. Tissue concentrations of AC were then determined assuming Cr at 30 mM/kg ww.6
Statistics: The kPCr and PCr depletion at the different locations were compared with a repeated measures ANOVA.
Results
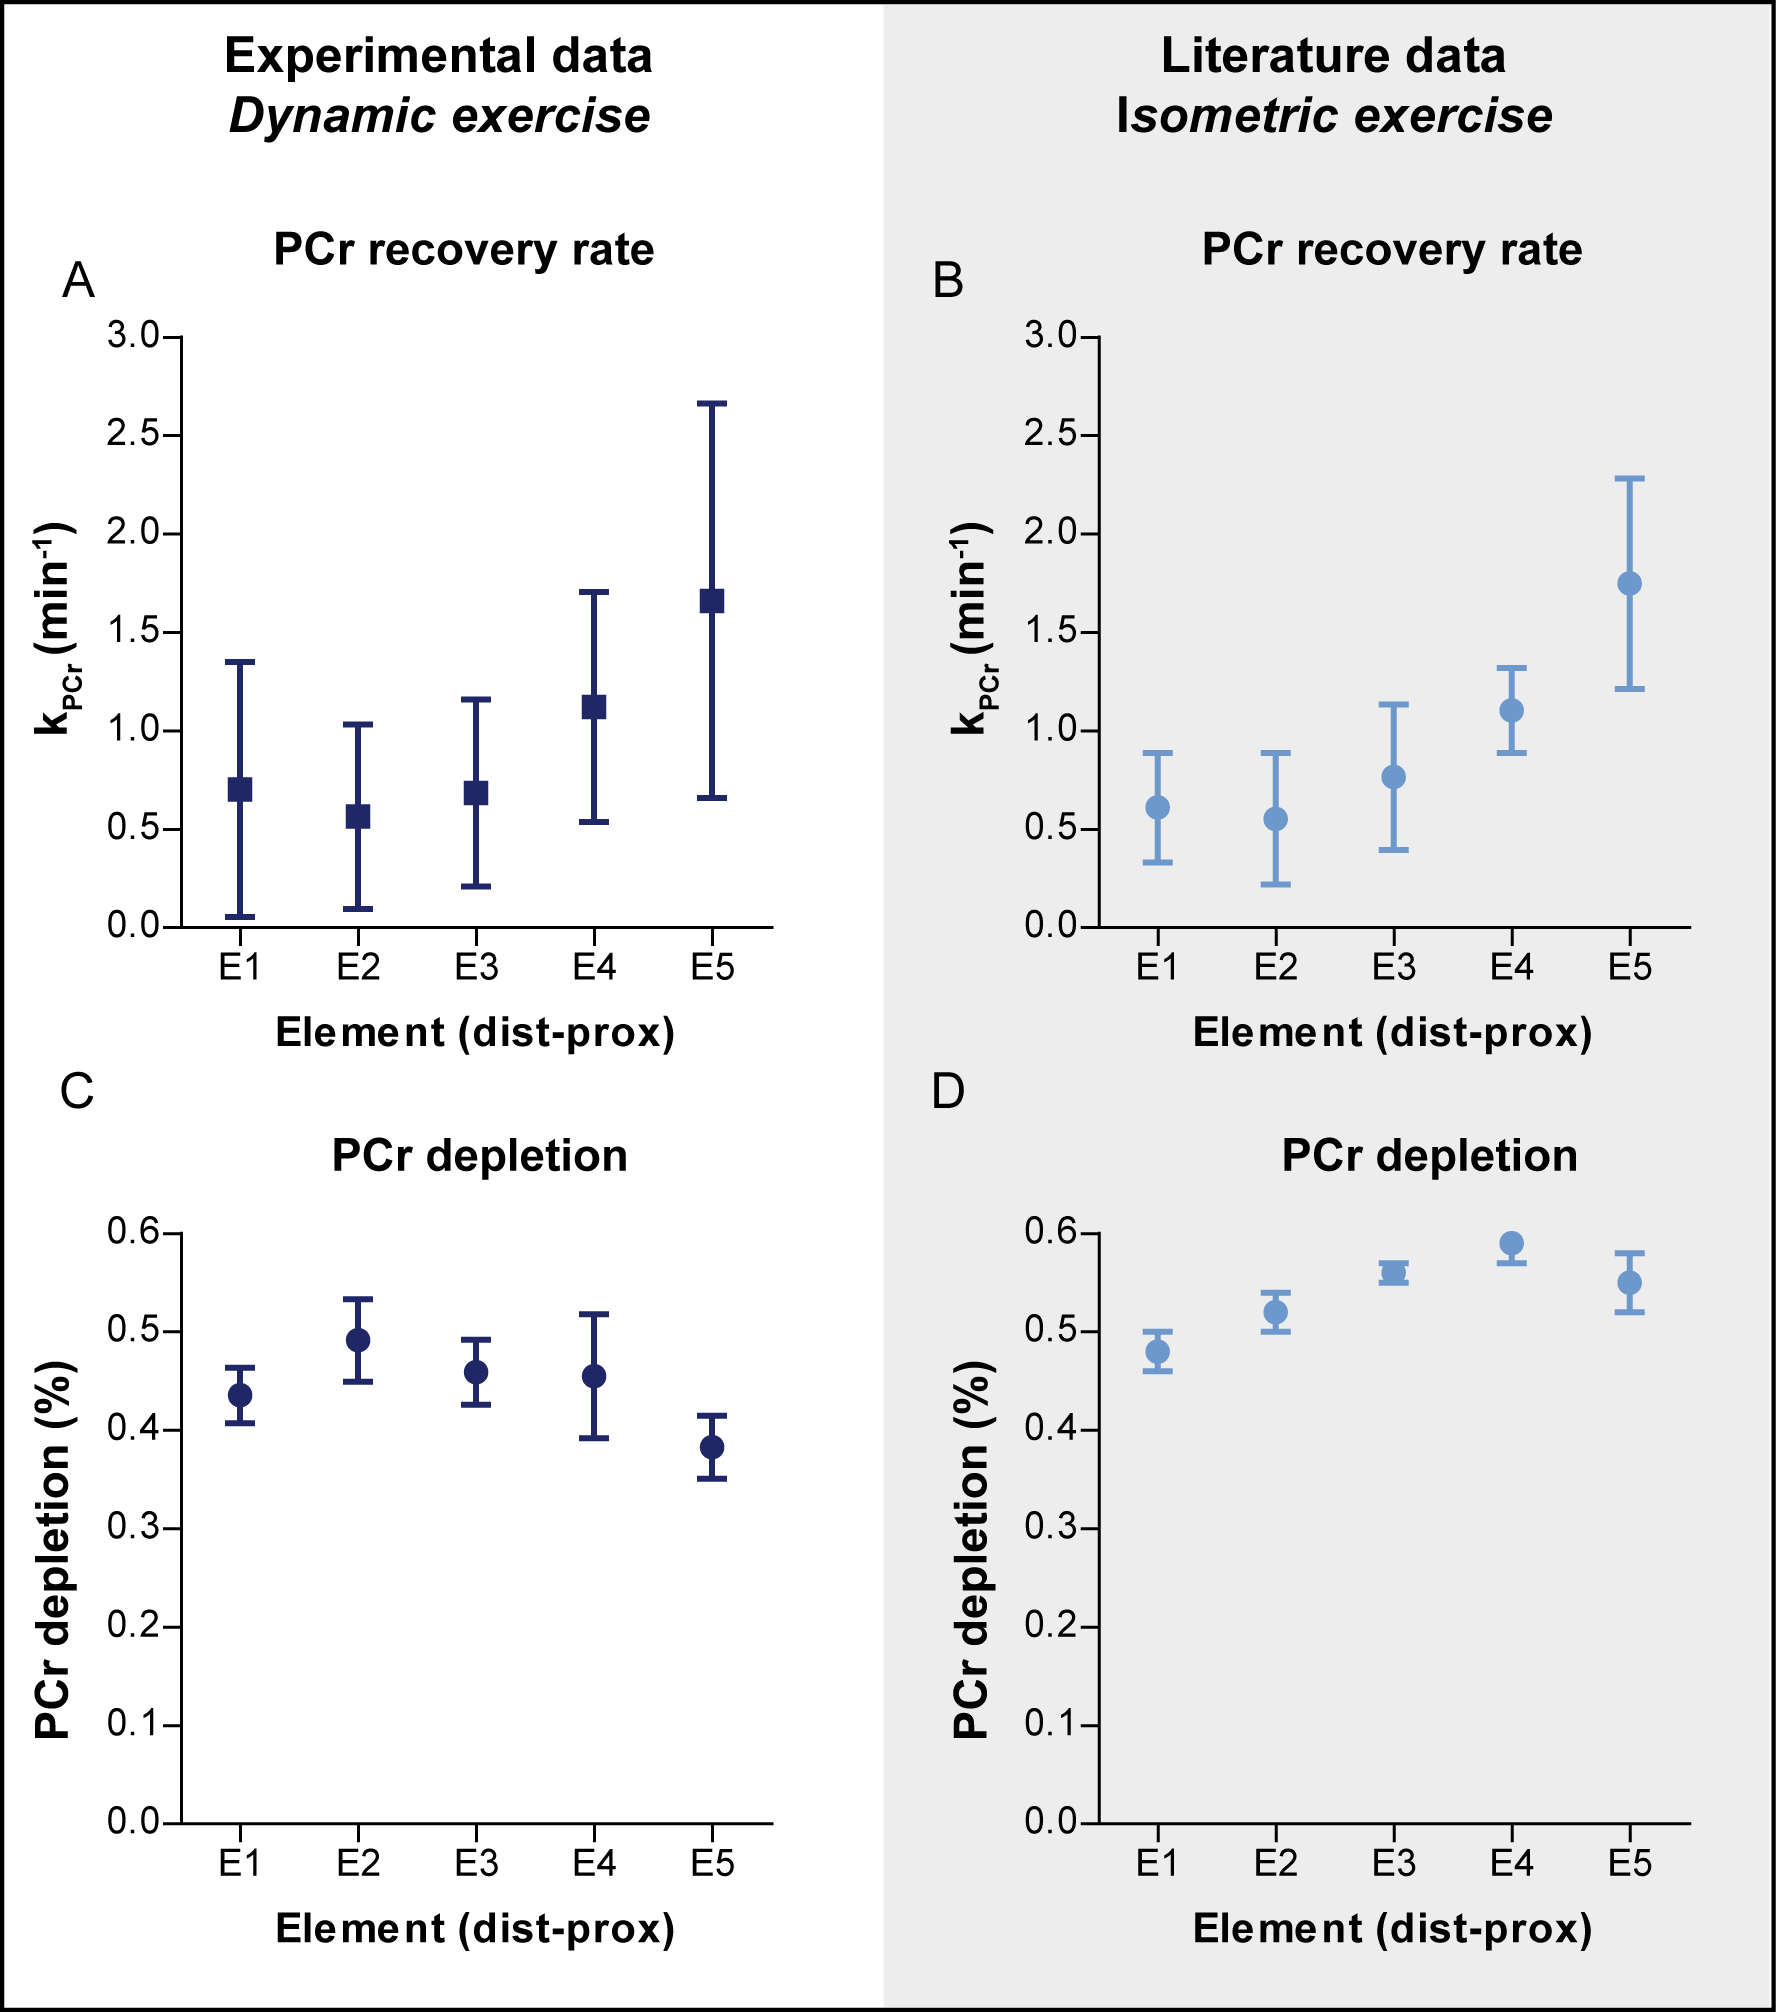
31P MRS: The maximum force reached during 31P MRS was 66±3% MVC and time to exhaustion was 187±4s. PCr decreased during dynamic exercise and recovered to baseline thereafter (Fig.2). The kPCr differed significantly between the coil elements (p<0.001) with a higher kPCr proximally than distally (Fig.3A). This is very similar to the kPCr increase over the coil elements after isometric exercise (Fig. 3B). PCr depletion didnot correlate with the proximo-distal decrease in kPCr (Fig. 3C&D).
1H MRS: High quality 1H MR spectra were obtained at a TE of 350 ms from 3 locations positioned along the TA with well-resolved resonances of AC and Cr without lipid signal contamination (Fig.4).
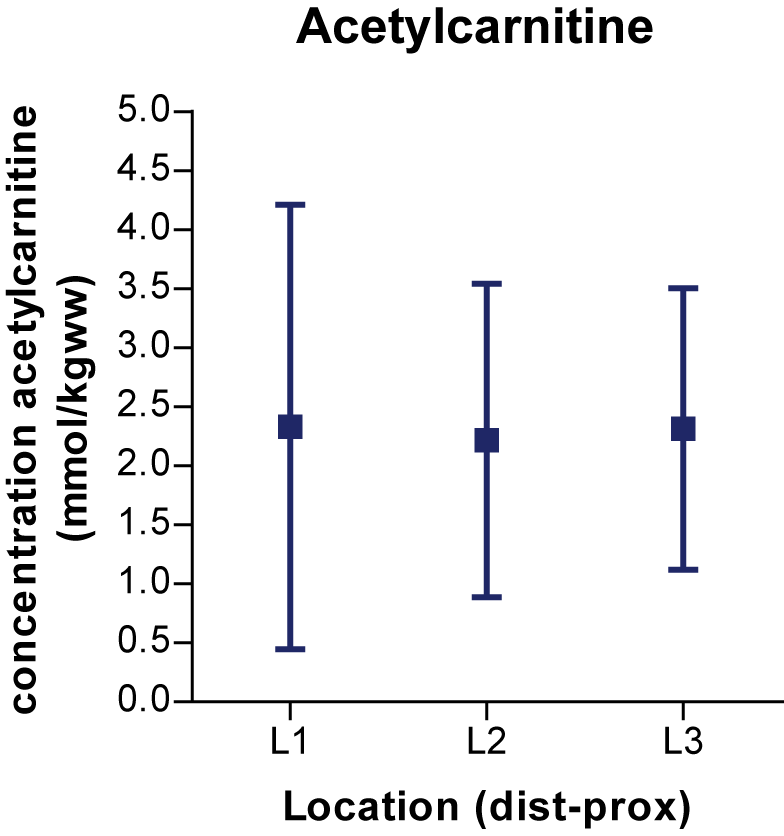
Using the Cr signal as internal standard we obtained tissue concentrations of AC varying between 1.0 and 4.1 mM/Kgww. Despite substantial variations which were found between subjects and at different times of the day for one subject, the AC-levels between the 3 adjacent voxels in the TA were remarkably similar (Figs.4&5).Conclusion and Discussion
Previously we reported a substantial increase in the PCr recovery rate from distal to proximal in the TA after isometric exercise5. Subsequently we demonstrated that also muscle oxygenation, measured by NIRS and perfusion, measured by IVIM, recovered faster proximally in this muscle7. As isometric exercise is partially ischemic we tested if the proximal-distal gradient in PCr recovery also occurs with dynamic exercise. The remarkable similar gradient indicates that intrinsic differences in oxygenation and perfusion are major factors in PCr recovery. The similarity between AC levels along the length of the TA indicates that no mitochondrial metabolic component is involved. The absence of a correlation between PCr depletion by the exercise with the proximal-distal kPCr gradient also indicates that differences in energy metabolism are not involved and further supports that the PCr recovery rate is determined by oxygenation and perfusion increasing proximal along the TA.
Acknowledgements
No acknowledgement found.References
1. Kemp GJ, Ahmad RE, Nicolay K, Prompers JJ. Quantification of skeletal muscle mitochondrial function by 31P magnetic resonance spectroscopy techniques: a quantitative review. Acta Physiol (Oxf). 2015;213:107.
2. Larsen RG, Callahan DM, Foulis SA, Kent-Braun JA. In vivo oxidative capacity varies with muscle and training status in young adults. J Appl Physiol. 2009;107:873–879.
3. Fleischman A, Makimura H, Stanley TL, et al. Skeletal muscle phosphocreatine recovery after submaximal exercise in children and young and middle-aged adults. J Clin Endocrinol Metab. 2010;95:E69.
4. Yoshida T, Abe D, Fukuoka Y. Phosphocreatine resynthesis during recovery in different muscles of the exercising leg by 31P-MRS. Scand J Med Sci Sport. 2013;23:e313-9.
5. Boss A, Heskamp L, van Uden MJ, Bains LJ, Breukels V, Heerschap A. Muscle Functional Oxidative Capacity Varies Along the Length of Healthy Tibialis Anterior. J Physiol. 2018 Apr 15;596(8):1467-1483.
6. Lindeboom L, Nabuurs C, Hoeks J, Brouwers, B Phielix E, Kooi M.E., Hesselink MKC, Wildberger JE, Stevens RD, Koves T, Muoio DM, Schrauwen P Schrauwen-Hinderling VB. Long-echo time MR spectroscopy for skeletal muscle acetylcarnitine detection. J Clin Invest 124, 11, 2014.
7. Heskamp L, Lebbink F, van Uden M, Maas M, Claasen J, Froeling M, Boss A, Heerschap A. Intramuscular variation in O2 upply and phosphocreatine recovery in the tiabialis anterior. Proc ISMRM 2018, Paris
Figures