0412
Quantitative multi-parametric MRI reveals micro-structural changes in upper-leg muscles after running a marathon1Department of Biomedical Engineering and Physics, Amsterdam University Medical Centers, University of Amsterdam, Amsterdam, Netherlands, 2Department of Radiology and Nuclear Medicine, Amsterdam University Medical Centers, University of Amsterdam, Amsterdam, Netherlands, 3Department of Radiology, University Medical Center Utrecht, Utrecht, Netherlands, 4Radboud Institute for Health Sciences, Department of Physiology, Radboud University Medical Center, Nijmegen, Netherlands
Synopsis
Quantitative MR techniques have shown promise for detection of muscle micro trauma. Muscle injury and recovery involve many pathophysiological processes including, inflammation, regeneration and fibrosis, therefore multi-parametric approaches are critically needed. This study used a multi-parametric quantitative approach to assess micro structural changes in the upper leg muscles after running a marathon on an individual muscle basis as well as on a localized level. Our results indicate that diffusion indices are highly sensitive to detect micro-structural changes on a localized and whole volume basis and that this approach could prove valuable for improved outcome prediction and risk-assessment of sports-related-injuries.
Introduction
Muscle injuries are the most prevalent injuries in recreational and elite sports. Currently, conventional MRI (T2-weighted) assists in diagnosis of muscle injury but fails to detect micro trauma and to predict recovery1. Quantitative MR techniques, including DTI-MRI and qT2, have shown promise for detection of micro trauma and to monitor recovery2,3. The first aim of this study was to assess micro-structural changes in the upper leg muscles after running a marathon using a multi-parametric quantitative MR approach. Furthermore, the muscle’s vulnerability to injury depends on specific muscle function and is not homogeneous within individual muscles4-6. Yet, muscle injury is frequently assessed using whole muscle quantitative MRI indices, which may result in an incomplete picture of the actual damage. Here, we assessed changes in quantitative MRI indices on an individual muscle basis as well as on a localized level.Methods
MR datasets were acquired in both upper legs of 11 marathon runners (51 [50-56] years) at three time points: 1 week prior to the marathon (baseline), 24-48 hrs. post marathon (post-marathon) and 2-weeks post marathon (follow-up)(Figure 1A) on a 3T Philips Ingenia system with 16-channel anterior and 12-channel posterior receive coil. Subjects were placed in feet first supine position. The data were acquired in three stacks (Figure 1B) with 30mm overlap covering 498mm with a Field-of-View of 480x276mm2. The scanning protocol for each stack included a multi-echo spin-echo (MSE) sequence, a spin-echo EPI diffusion weighted sequence, a Dixon sequence and T2-weighted SPIR sequence (Table 1).Data-analyses
All data analyses were performed using DTITools for Mathematica (github.com/mfroeling/DTITools). Diffusion data were de-noised, corrected for motion and eddy currents, after which the tensor and perfusion factors were estimated using an IVIM based iWLLS algorithm7. T2-mapping data were fitted using an extended phase graph (EPG) approach8, and fat fraction maps were reconstructed using IDEAL decomposition9 with eight reference fat peaks and a single T2* decay10. The T2-weighted SPIR images were graded by an experienced radiologist using a standardized grading system11. Eight muscles in both upper legs, i.e., Biceps Femoris Short Head (BFS), Biceps Femoris Long Head (BFL), Semitendinosus (ST), Semimembranosus (SM), Vastus Medialis (VM), Vastus Lateralis (VL), Vastus Intermedius (VI), and Rectus Femoris (RF) muscle, were manually segmented based on the Out-of-Phase DIXON images (ITK-snap, Figure 1B). The VM and BFL muscles were divided in 5 equal segments for the localized assessment of muscle damage. Muscles with insufficient SNR-levels or graded for overt injury were excluded from further analysis. Differences between time points were assessed with a Multi-Level Linear-Mixed-Model. Comparison between whole muscle and localized measurements of Mean Diffusivity (MD) and qT2 values was done using a MANCOVA.Results
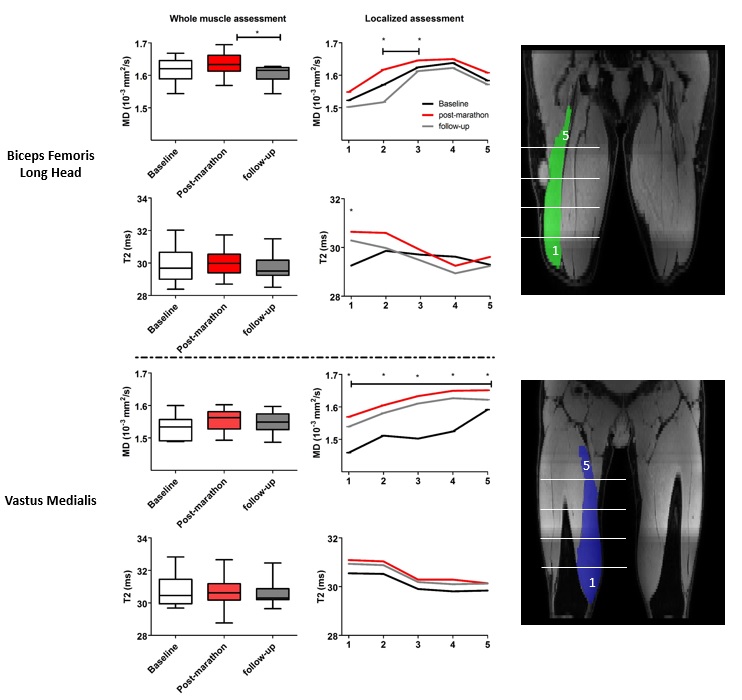
Multi-parametric images of a representative subject are shown in figure 2. An overall time-effect was found for diffusion indices, MD(p<0.001), λ2(p=0.001) and λ3(p<0.001), increasing post-marathon and returning to baseline values at follow-up (Figure 3). The BFL, ST and all quadriceps muscles significantly contributed to this effect. FA, λ1, perfusion fractions and %fat did not change following the marathon while qT2 values were still lower after two weeks recovery (p=0.002). Localized assessment of MD (Δ8.5 [1.7-14.7] %) and qT2 (Δ1.5 [-1.3-1.8]%) showed more pronounced effects than whole muscle assessment (MD Δ1.5%; qT2 Δ0.4%), with a significant time-effect for MD in the VM (5/5 segments; p<0.003) and BFL muscle (2/5 segments; P<0.001) and for qT2 in the BFL muscle (1/5 segments; p<0.003) (Figure 4) compared to baseline.Discussion
Diffusion indices, MD, λ2 and λ3 were elevated in the majority of upper legs muscles post-marathon and returned to baseline values after two weeks recovery. The other diffusion parameters showed a similar but less pronounced pattern whereas muscle perfusion fractions and water T2 values showed a more heterogeneous pattern. Importantly, absence of clear T2 or perfusion effects suggest that diffusion parameters are more sensitive to detect muscle damage. It indicates that the changes in diffusion parameters post-marathon reflect changes in muscle micro structure rather than edema or perfusion. These findings agree with previous studies which reported a change in diffusion parameters and a less defined pattern for T22,3. Localized assessment of muscle damage showed more pronounced effects, going up to 15% with respect to baseline, compared with whole volume measurements, indicating that heterogeneity within individual muscles needs to be considered during muscle injury evaluation.Conclusion
Diffusion parameters are sensitive to detect micro-structural changes on a localized and whole muscle volume basis. The multi-parametric approach used here is essential to understand the underlying pathophysiology of muscle injury and recovery and could prove valuable for improved outcome prediction and risk assessment of sports-related injuries.Acknowledgements
No acknowledgement found.References
1. Reurink, G. Brillman EG, de Vos-RJ et al. Magnetic Resonance Imaging in Acute Hamstring Injury: Can We Provide a Return to Play Prognosis? Sport. Med.2015 Jan; 45(1) 133–146 (2015).
2. Froeling M, Oudeman-J, G.J. Strijkers et al. Muscle changes detected with diffusion-tensor imaging after long distance running. Radiology 2015 Feb;274(2):548-62
3. Maeo-S, Ando-Y, Kanehisa-H et al. Localization of damage in the human leg muscles induced by downhill running. Sci Report 2017; Jul 18;7(1):5769.
4. Schlaffke-L, Rehmann-R, Froeling-M et al. Diffsuion tensor imaging of the human calf: Variation of inter and intramuscle-specific diffusion parameters. J magn Reson Imaging 2017; 46(4):1137-1148
5. Hooijmans-MT, Niks-EH, Burakiewicz-J et al. Non-uniform muscle fat replacement along the proximodistal muscle axis in Duchenne Muscular Dystrophy. Neuromuscul Disord.2017May;27(5):458-464
6. Shin DD, Hodgson JA, Edgerton VR, et al. In vivo intramuscular fascicle-aponeuroses dynamics of the human medial gastrocnemius during plantarflexion and dorsiflexion of the foot. J Appl Physiol 2009;107:1276-1284.
7. De Luca A, Bertoldo A, Froeling M. Effects of perfusion on DTI and DKI estimates in the skeletal muscle. Magn Reson Med. 2017;78:233–46.
8. Marty B, Baudin P, Reyngoudt H et al. Simultaneous muscle water T2 and fat fraction mapping using transverse relaxometry with stimulated echo compensation. NMR Biomed. 2016;(November 2015).
9. Reeder SB, Pineda AR, Wen Z et al. Iterative Decomposition of Water and Fat With Echo Asymmetry and Least-Squares Estimation ( IDEAL ): Application With Fast Spin-Echo Imaging. Magnenetic Reson Med. 2005;644:636–44.
10. Triplett WT, Baligand C, Forbes SCet al. Chemical shift-based MRI to measure fat fractions in dystrophic skeletal muscle. Magn Reson Med. 2014;72(1):8–19.
11. Mueller-Wohlfahrt H-W, Haensel L, Mithoefer K, et al. Terminology and classification of muscle injuries in sport: the Munich consensus statement. Br J Sports Med 2013; 47(6):342–350
Figures