0410
In Vivo Diffusion MRI Evaluation of Human Patellar Tendon Microstructure and Microcirculation1Biomedical Engineering, Stony Brook University, Stony Brook, NY, United States, 2Radiology, Stony Brook University, Stony Brook, NY, United States, 3Orthopaedics, Stony Brook University, Stony Brook, NY, United States
Synopsis
The patellar tendon (PT) is essential for knee extension and patellar tendinopathy causes persistent knee pain in ~14% of recreational athletes. Microstructure and microcirculation play a critical role in the progression of tendinopathy and can be non-invasively assessed by DTI and IVIM MRI, respectively. In this study, the novel ste-RS-EPI diffusion MRI protocol originally developed for Achilles tendon imaging was applied to image healthy PT. For the first time, DTI and IVIM images were acquired of PT for microstructure and microcirculation evaluation.
Introduction
The patellar tendon (PT) is essential for knee extension. Patellar tendinopathy causes persistent anterior knee pain and occurs in ~14% of recreational athletes1,2. PT microstructure and microcirculation play crucial roles in the progression of tendinopathy and tendon repair3. Diffusion tensor imaging (DTI) and intravoxel incoherent motion (IVIM) imaging can non-invasively evaluate the microstructure and microcirculation, respectively, of biological tissue. Application to the PT is challenging due to the short T2/T2* values of tendons (~7 ms) and the requirement of long echo time (TE) (~50-80 ms). In this study, a stimulated-echo readout-segmented EPI (ste-RS-EPI) diffusion MRI protocol, originally developed for Achilles tendon imaging4,5, was applied to PT of healthy subjects.Methods
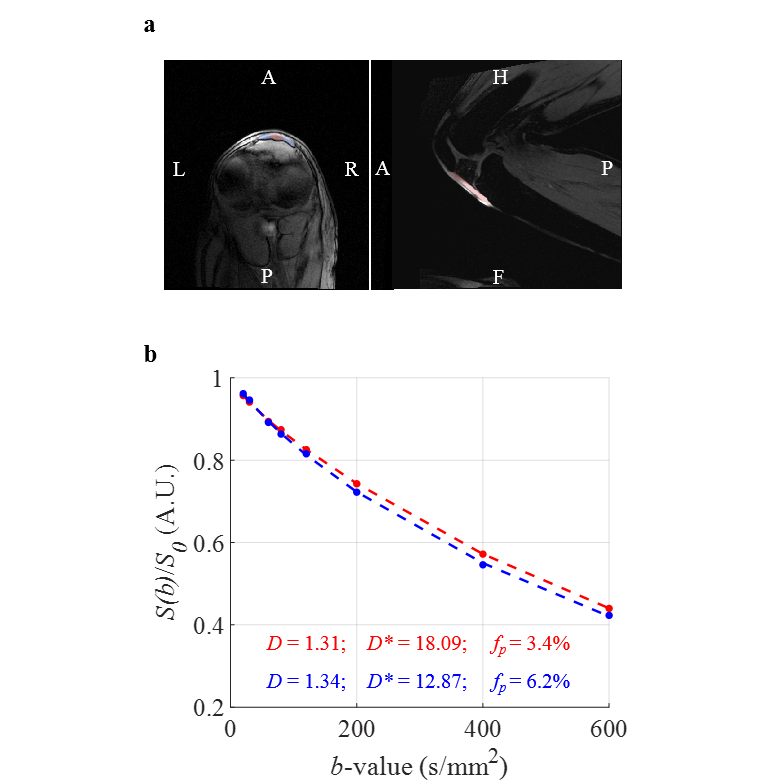
Eight healthy subjects were recruited for this IRB approved study on a Siemens Prisma 3T magnet with 4 cm single-channel loop coil. Participants were imaged in the lateral recumbent position with their PT positioned at ~55° with respect to the magnet B0 to increase tendon signal via the magic angle effect6,7. The ste-RS-EPI acquisition parameters were as follow: FOV of 128×77 mm2; matrix of 96×58; 7 axial slices with thickness of 6 mm; TR/TE/TM of 2100/22/200 ms; readout segmentation factor of 5. For IVIM: b-values of 0, 20, 30, 60, 80, 120, 200, 400, and 600 s/mm2; 3 diffusion directions; total acquisition time of ~5.5 min. For DTI: b-values of 0 and 800 s/mm2; 12 diffusion directions; total acquisition time of ~8 min. Additionally, T2* was mapped using a multi-echo gradient echo variable-TE (vTE) sequence (28) with total acquisition time of ~2.5 min. The PT was manually segmented from the baseline b = 0 s/mm2 images. ROIs for the middle-third and outer-two thirds of the segmented PT were automatically determined from the cross-sectional length at each slice. The average IVIM signal within the two regions of interest was fit with the standard IVIM model8: $$S(b)=S_0[f_pe^{-bD^*}+(1-f_p)e^{-bD}]$$
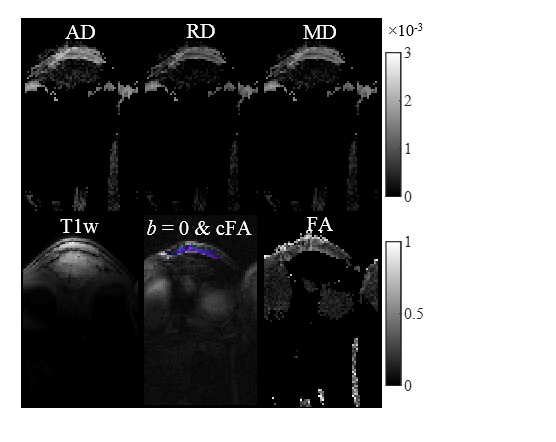
The values of fp and D*×fp are directly proportional to blood volume and blood flow respectively9. The absolute microvascular blood volume fraction (Vb) was estimated from fp, based on the T1 and T2 differences between blood and tendon tissue water4. Differences in parameters sensitive to blood volume (fp and Vb) and blood flow (D*×fp and D*×Vb), between middle-third and outer-two thirds PT regions were assessed with the paired, two-tailed t-test. A p-value less than 0.05 was considered statistically significant. DTI images were processed with DtiStudio (http://lbam.med.jhmi.edu )10 to calculate axial diffusivity (AD), radial diffusivity (RD), mean diffusivity (MD), and fractional anisotropy (FA).
Results & Discussion
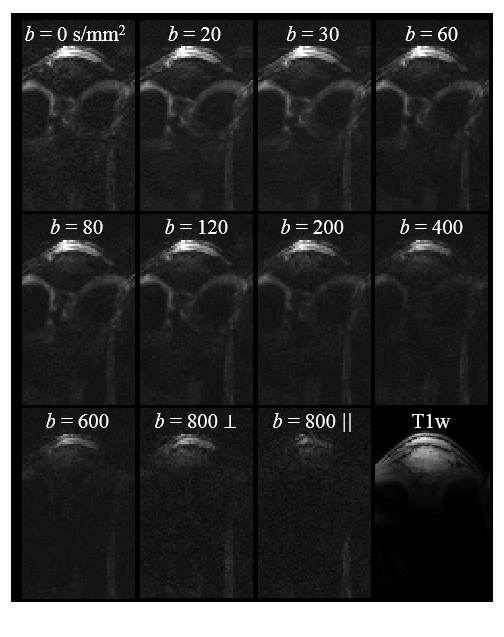
Figure 1 shows the ste-RS-EPI images for a representative subject. The short TE and long T2 achieved with ste-RS-EPI and magic angle effect, respectively, resulted in high MR signal from the PT, even for a b-value of 800 s/mm2. The ROI selection for the same healthy participant with corresponding IVIM fit is displayed in Figure 2. The estimated DTI parameter maps for the same subject are displayed in Figure 3. Table 1 lists the average values of PT DTI parameters, T2*, and the exact PT angle with respect to the scanner B0 for the 8 healthy participants. The estimated PT AD and RD were higher than those observed in Achilles tendon (AT)5, potentially reflecting larger collagen fiber thickness and greater intra-collagen fiber spacing, respectively, in PT compared to AT11,12.
Table 2 lists the average values of middle-third and outer-two thirds PT IVIM parameters and absolute microvascular blood volume parameters for the 8 healthy participants. Similar measurements of fp and Vb were observed in PT when compared to previous results in AT4. This is in good agreement with a previous study using red lasers that observed similar baseline values of total hemoglobin in AT and PT13. All four microcirculation parameters (fp, D*×fp, Vb, and D*×Vb) were significantly higher in the outer-two thirds region of the PT when compared to the middle-third region. ACL reconstruction is often performed using a bone-patellar tendon-bone (BPTB) graft, with the graft generally harvested from the middle-third region of the PT due to a rich vascular bed. Our results demonstrate that the outer-two thirds have higher total microvascular blood volume and blood flow, suggesting that one of the outer-thirds of the PT could be better suited for BPTB grafts in ACL reconstruction.
Conclusion
DTI and IVIM of the PT using the ste-RS-EPI protocol can investigate PT microstructure and microcirculation in healthy participants. The method presented in this study can be readily applied to study patients with patellar tendinopathy, with the possibility of developing biomarkers for early disease detection and treatment response assessment.Acknowledgements
No acknowledgement found.References
1. Maffulli N, Khan KM, Puddu G. Overuse tendon conditions: time to change a confusing terminology. Arthroscopy. 1998;14(8):840-843.
2. Lian OB, Engebretsen L, Bahr R. Prevalence of jumper's knee among elite athletes from different sports: a cross-sectional study. The American journal of sports medicine. 2005;33(4):561-567.
3. Cook JL, Purdam CR. Is tendon pathology a continuum? A pathology model to explain the clinical presentation of load-induced tendinopathy. Br J Sports Med. 2009;43(6):409-416.
4. Wengler K, Fukuda T, Tank D, et al. Intravoxel incoherent motion (IVIM) imaging in human achilles tendon. J Magn Reson Imaging. 2018.
5. Wengler K, Tank D, Fukuda T, et al. Diffusion tensor imaging of human Achilles tendon by stimulated echo readout-segmented EPI (ste-RS-EPI). Magn Reson Med. 2018.
6. Fullerton GD, Rahal A. Collagen structure: the molecular source of the tendon magic angle effect. J Magn Reson Imaging. 2007;25(2):345-361.
7. Richardson ML, Amini B, Richards TL. Some new angles on the magic angle: what MSK radiologists know and don’t know about this phenomenon. Skeletal radiology. 2018:1-9.
8. Le Bihan D, Breton E, Lallemand D, Aubin ML, Vignaud J, Laval-Jeantet M. Separation of diffusion and perfusion in intravoxel incoherent motion MR imaging. Radiology. 1988;168(2):497-505.
9. Le Bihan D, Turner R. The capillary network: a link between ivim and classical perfusion. Magnetic Resonance in Medicine. 1992;27(1):171-178.
10. Jiang H, van Zijl PC, Kim J, Pearlson GD, Mori S. DtiStudio: resource program for diffusion tensor computation and fiber bundle tracking. Computer methods and programs in biomedicine. 2006;81(2):106-116.
11. Franchi M, Trire A, Quaranta M, Orsini E, Ottani V. Collagen structure of tendon relates to function. ScientificWorldJournal. 2007;7:404-420.
12. Hadjicostas PT, Soucacos PN, Paessler HH, Koleganova N, Berger I. Morphologic and histologic comparison between the patella and hamstring tendons grafts: a descriptive and anatomic study. Arthroscopy. 2007;23(7):751-756. 13. Kubo K, Ikebukuro T. Blood circulation of patellar and achilles tendons during contractions and heating. Medicine and science in sports and exercise. 2012;44(11):2111-2117.
Figures