0408
Cardiac dark-blood T2 mapping increases effective myocardial thickness by 35-75% for T2 evaluation in healthy subjects and patients1Yale University, New Haven, CT, United States
Synopsis
Cardiac dark-blood T2 mapping is an emerging technique to measure myocardial T2 with simultaneous suppression of blood pool and pericardial fat. In this work, we compared dark-blood T2 mapping with conventional bright-blood T2 mapping in terms of accuracy, precision, and effective myocardial thickness, in 8 healthy subjects and 7 patients. We found similar accuracy and precision between the two T2 mapping methods, but a largely improved effective myocardial thickness with dark-blood T2 mapping, due to reduced partial-voluming. The increased thickness may improve the accuracy of T2 in thin-walled structures for clinical evaluation.
Purpose
Cardiac dark-blood T2 mapping is an emerging technique to measure myocardial T2 with simultaneous suppression of blood pool and pericardial fat1. In this work, we compared dark-blood T2 mapping with conventional bright-blood T2 mapping in terms of accuracy, precision, and effective myocardial thickness, in 8 healthy subjects and 7 patients.Methods
The study was IRB-approved, and all subjects provided written informed consent. The dark-blood T2 mapping comprises of 4 single-shot T2-prep balanced Steady-State Free Precession (bSSFP) acquisitions, including 1 dummy, and 3 TEs=0ms, 24ms, and 55ms, lasting for 11 heartbeats. Blood was suppressed with double inversion-recovery (DIR) preparation performed in mid-diastole, one heartbeat prior to each acquisition2 and fat suppressed with spectrally selective RF immediately prior to the bSSFP echo-train. The conventional bright-blood T2 mapping comprises 3 T2-prep bSSFP acquisitions in 7 heartbeats with the same TE values3.
Imaging: Eight healthy subjects (age 30±10, 4 male) were scanned in a 3T scanner (Siemens Trio), in basal, mid-ventricular, and apical slices. Both T2-mapping methods had the same parameters: FOV/image size/slice-thickness/flip-angle/parallel imaging/bandwidth = 360mm×270mm/192×108/8mm/30°/GRAPPA 2/1395Hz/pixel. A coplanar high-resolution T1-weighted dark-blood turbo-spin-echo (DB-TSE) sequence was performed as an anatomical reference for myocardial thickness (TE/image size/flip-angle/bandwidth/turbo-factor = 31ms/256×192/90°/781Hz/pixel/19).
Seven patients (age 53±16, 5 male) with indications including myocarditis, heart failure, and myocardial infarction were scanned in a 1.5T scanner (Siemens Avanto) in a basal ventricular slice, with T2-weighted black-blood reverse DIR TSE2, bright-blood T2 mapping, and dark-blood T2 mapping. The parameters of both T2-mapping sequences were: FOV/image size/slice-thickness/TR/flip-angle/parallel imaging/bandwidth = 400mm×320mm/192×108/6-10mm/2.9ms/70°/GRAPPA 2/898Hz/pixel. DB-TSE used the same FOV and slice-thickness but with the following parameters: TE/image size/ flip-angle/bandwidth = 65ms/256×208/90°/781Hz/pixel.
Data analysis: In healthy subjects, LV myocardium was manually delineated for the anatomical image and each T2 map, with careful exclusion of papillary muscles, trabeculation, and partial-volumed voxels, which exhibited consistent T2 variation in the radial direction. The delineation was used to determine the effective myocardial thickness for each imaging method. LV myocardium was divided based on the 16-segment AHA model to analyze the regional T2 value and standard deviation (precision), using this manual contouring.
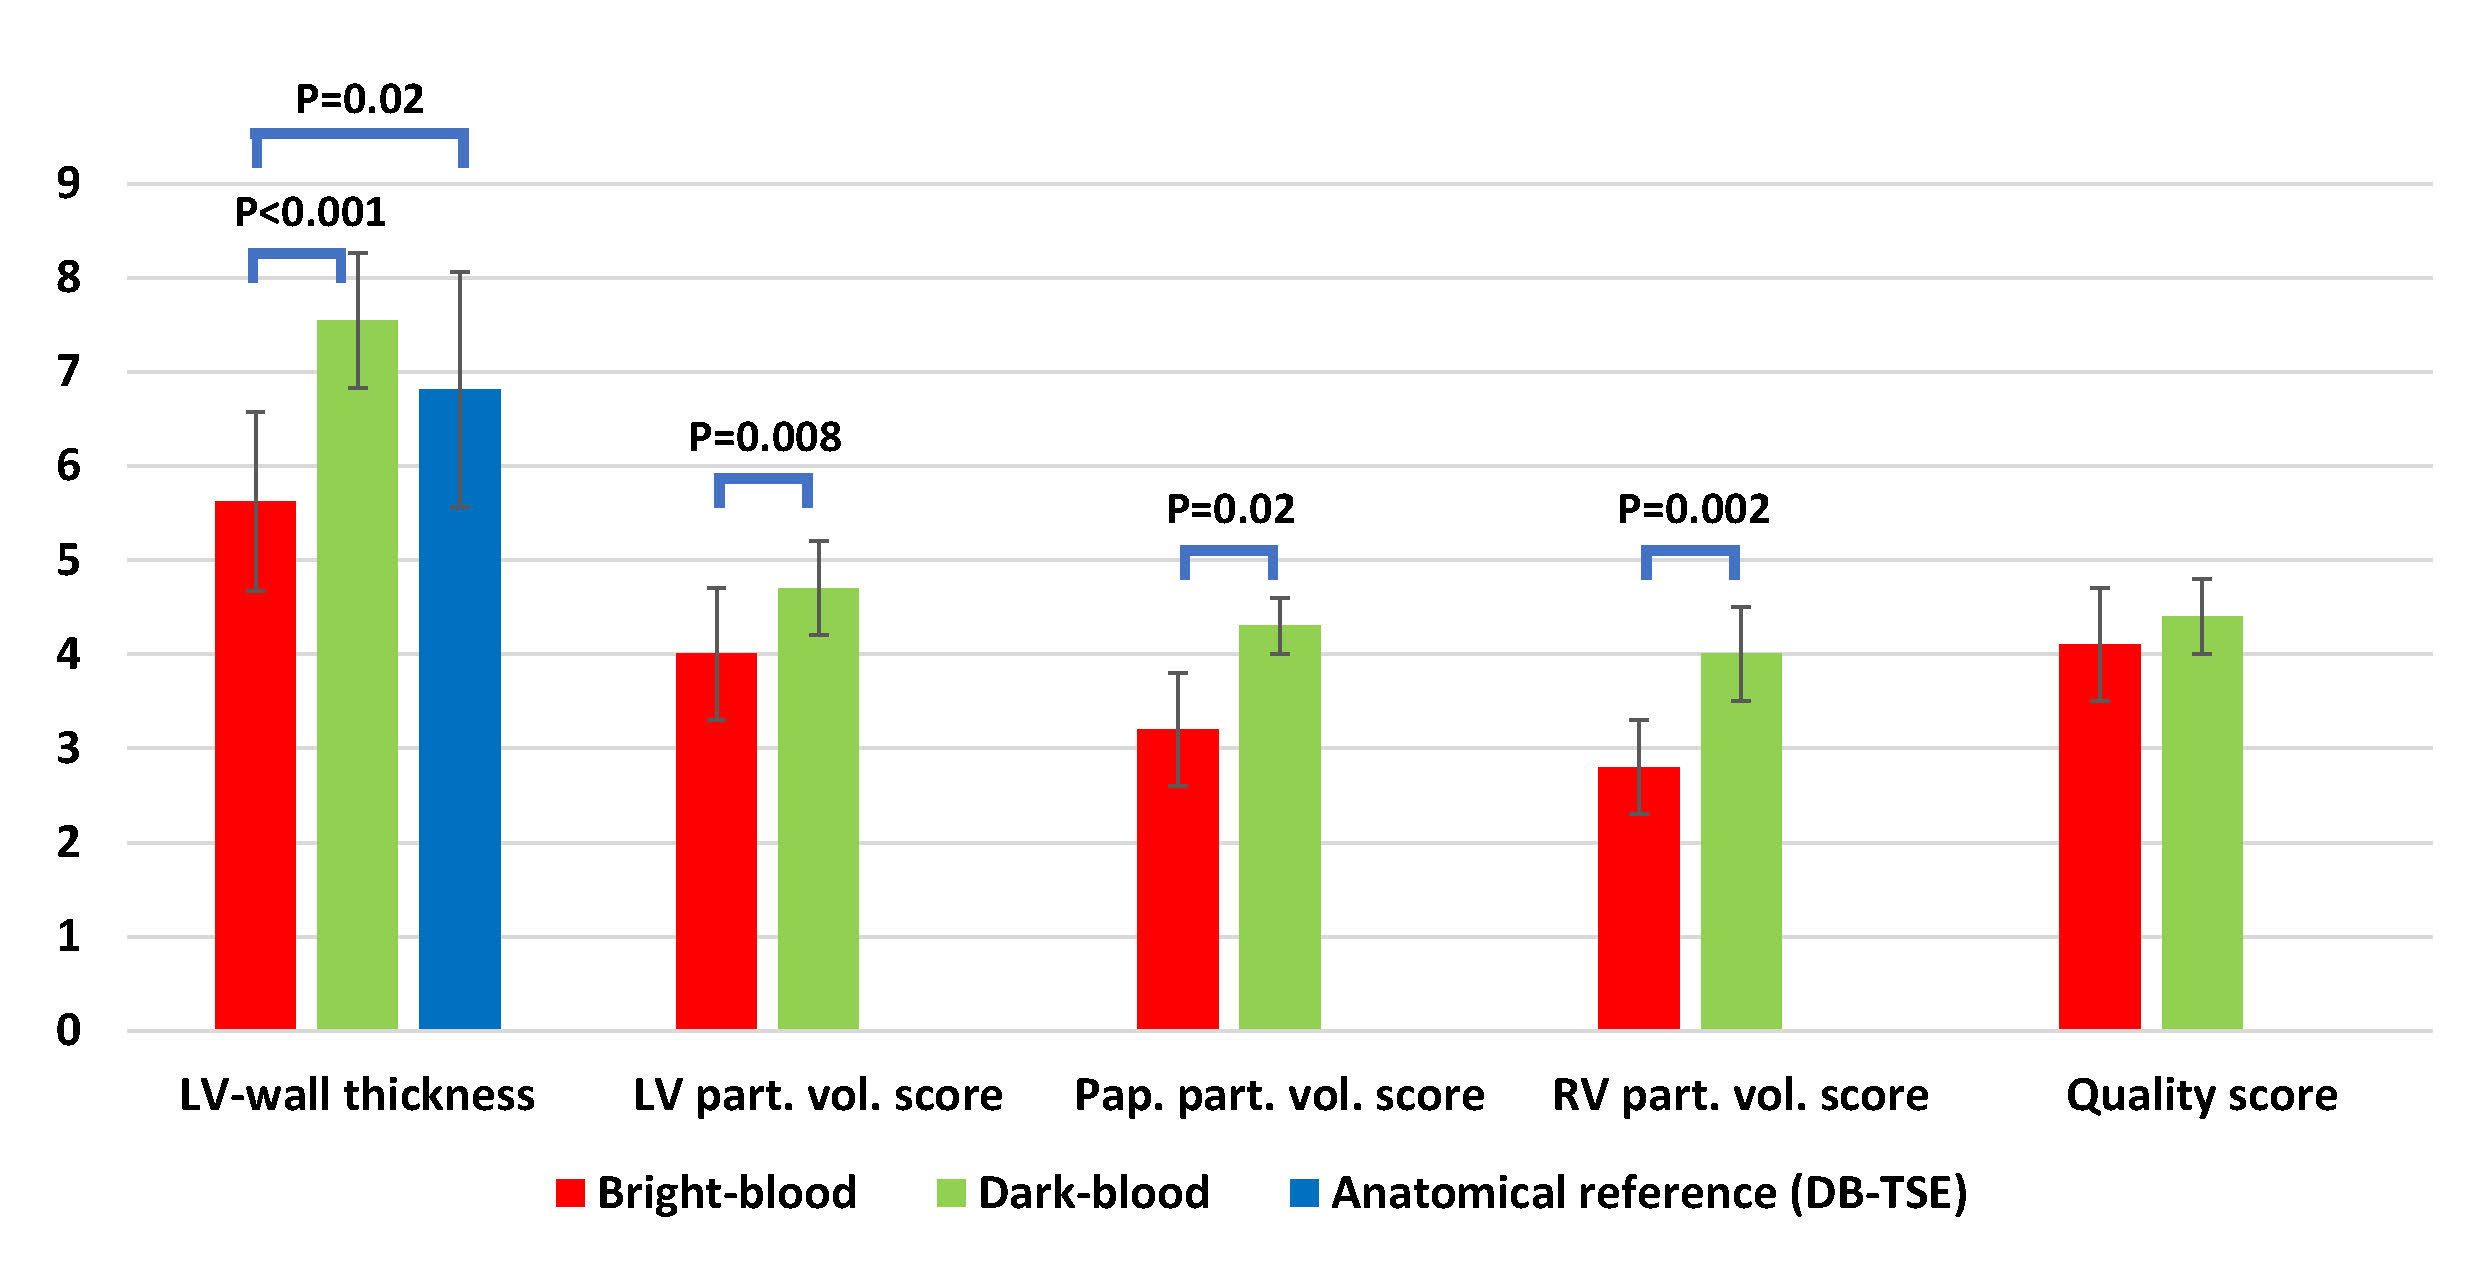
In patients, the LV myocardium was delineated in the same way as in healthy subjects to calculate effective myocardial thickness. Further, two experienced readers independently scored the two T2-mapping methods in terms of the partial-voluming severity in the LV wall, papillary muscles, and the right ventricle (RV). A quality score was also provided by each reader based on detailed chart review, including the patient’s clinical indication, medical history, and other imaging results (T2-weighted TSE, late gadolinium enhancement (LGE), etc) to reflect the mapping quality in the absence of a true gold standard.
Results
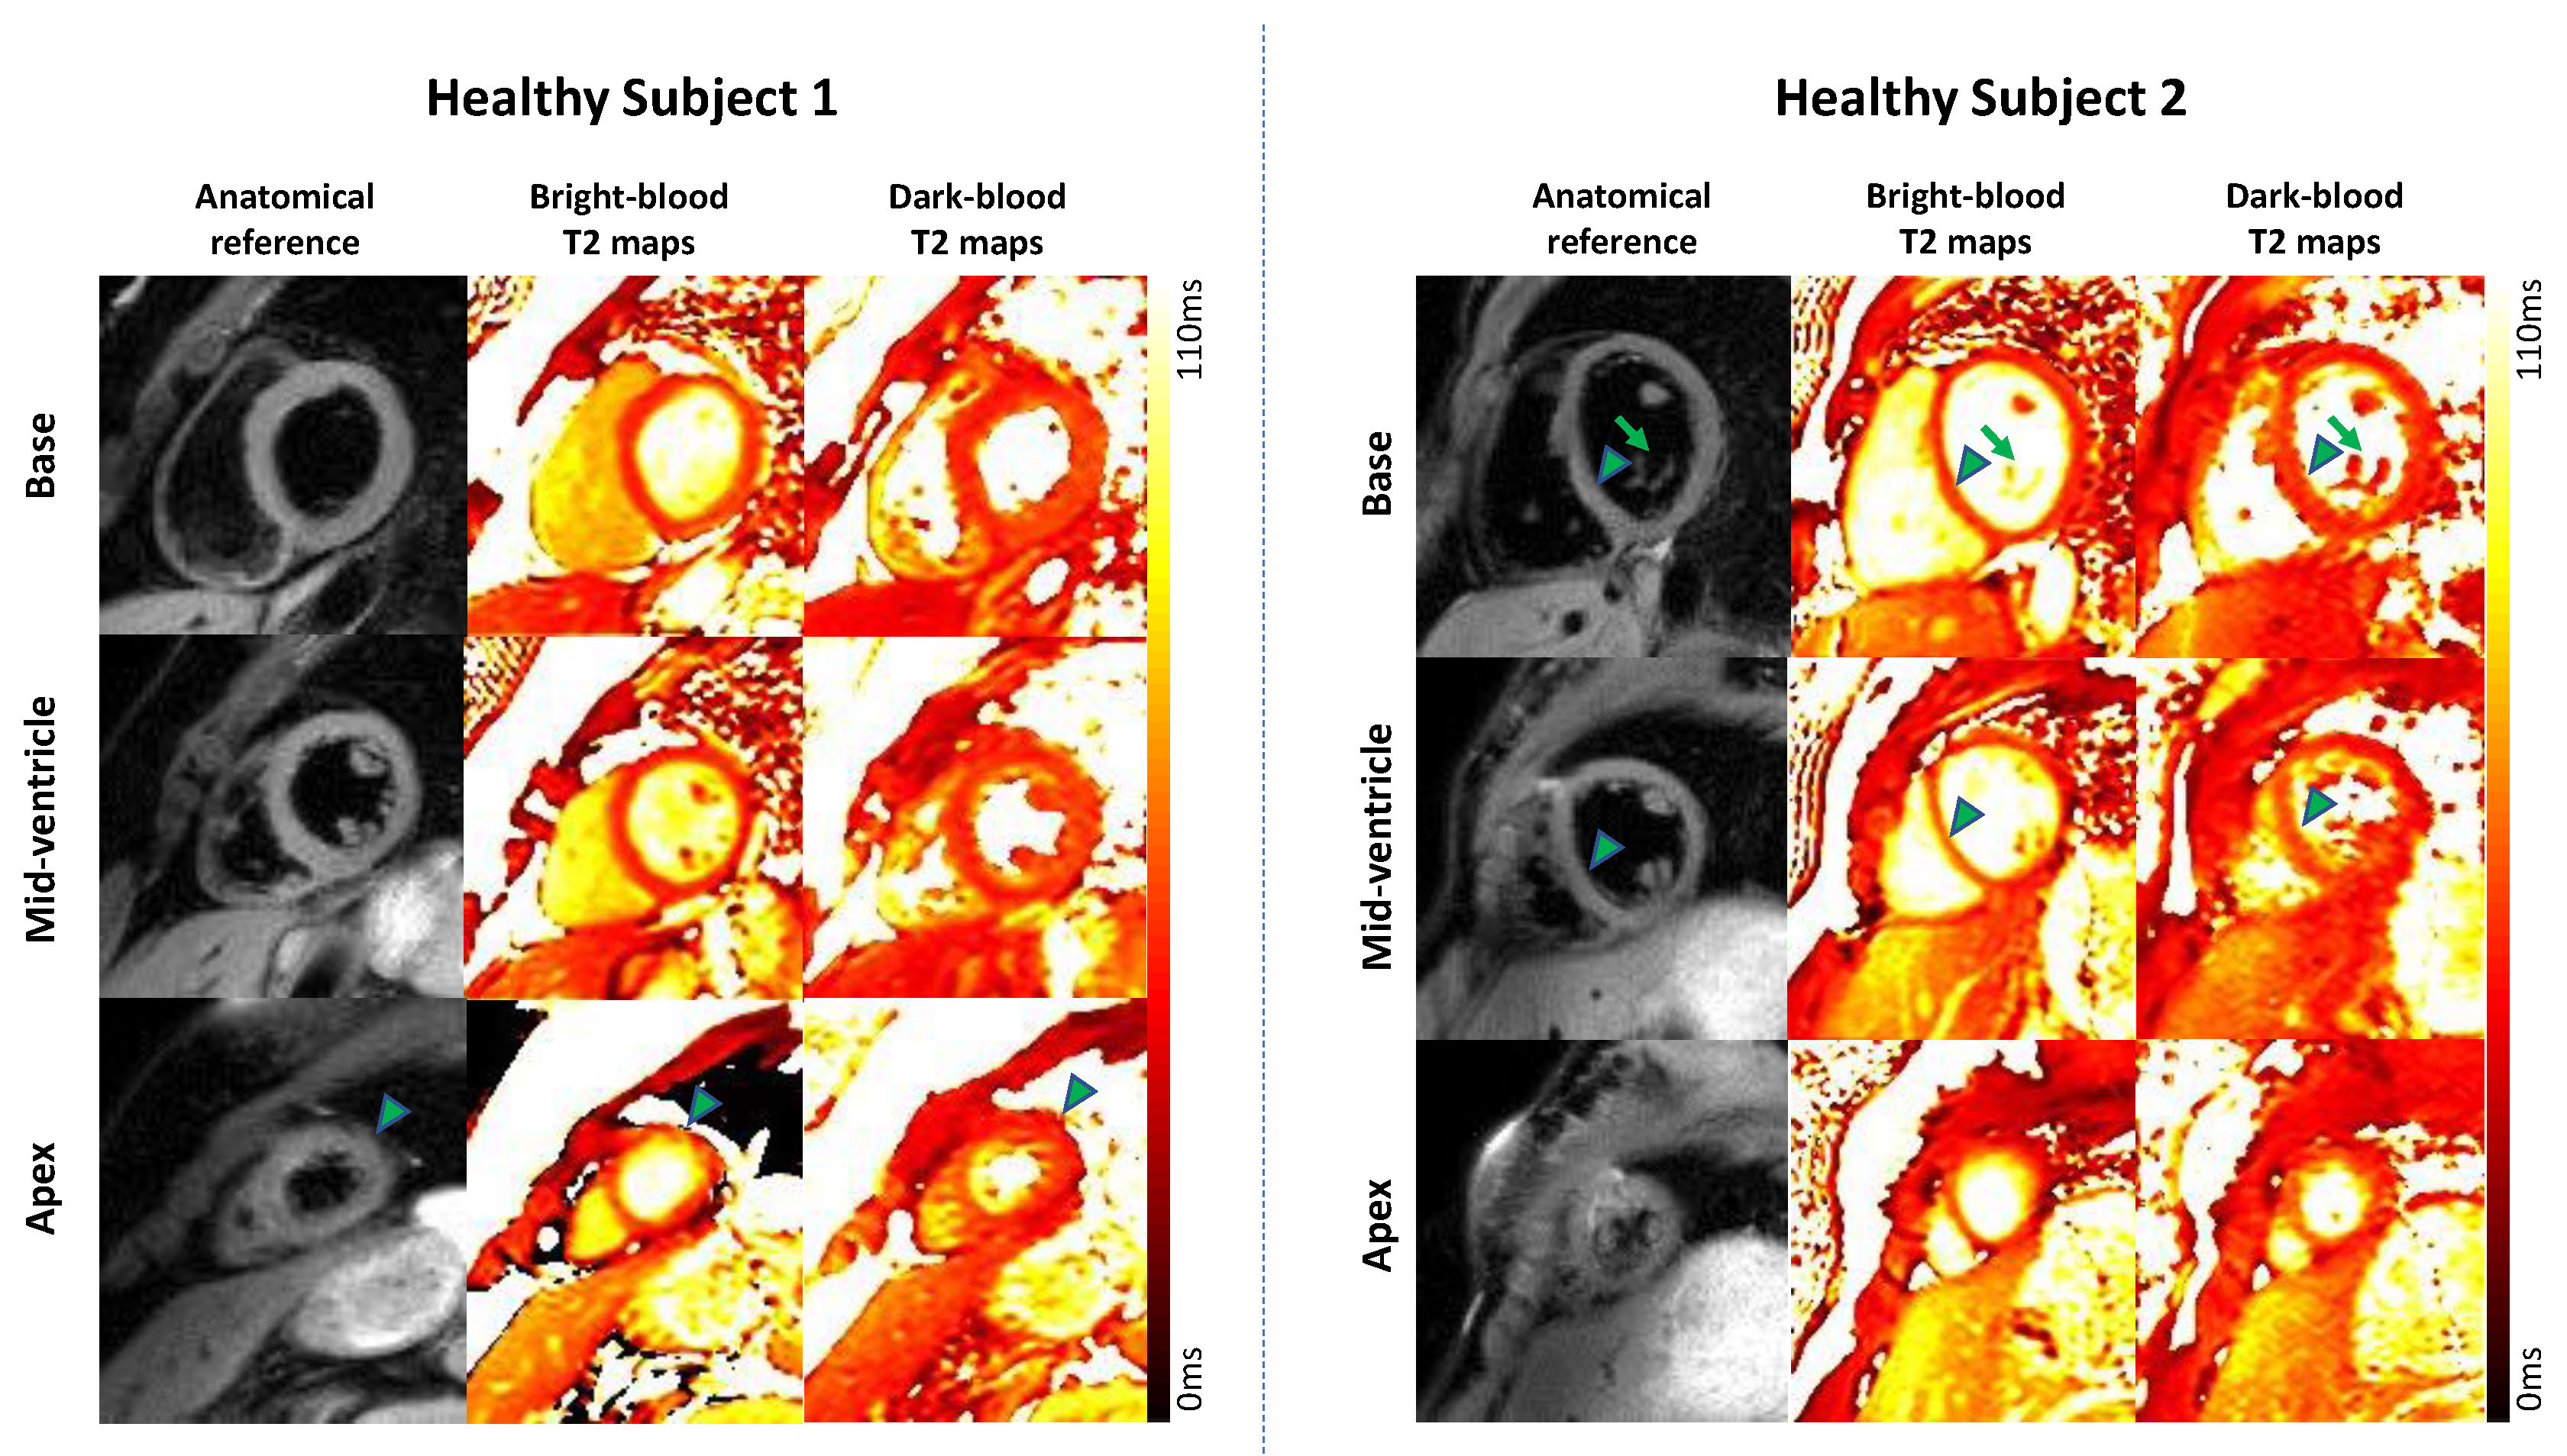
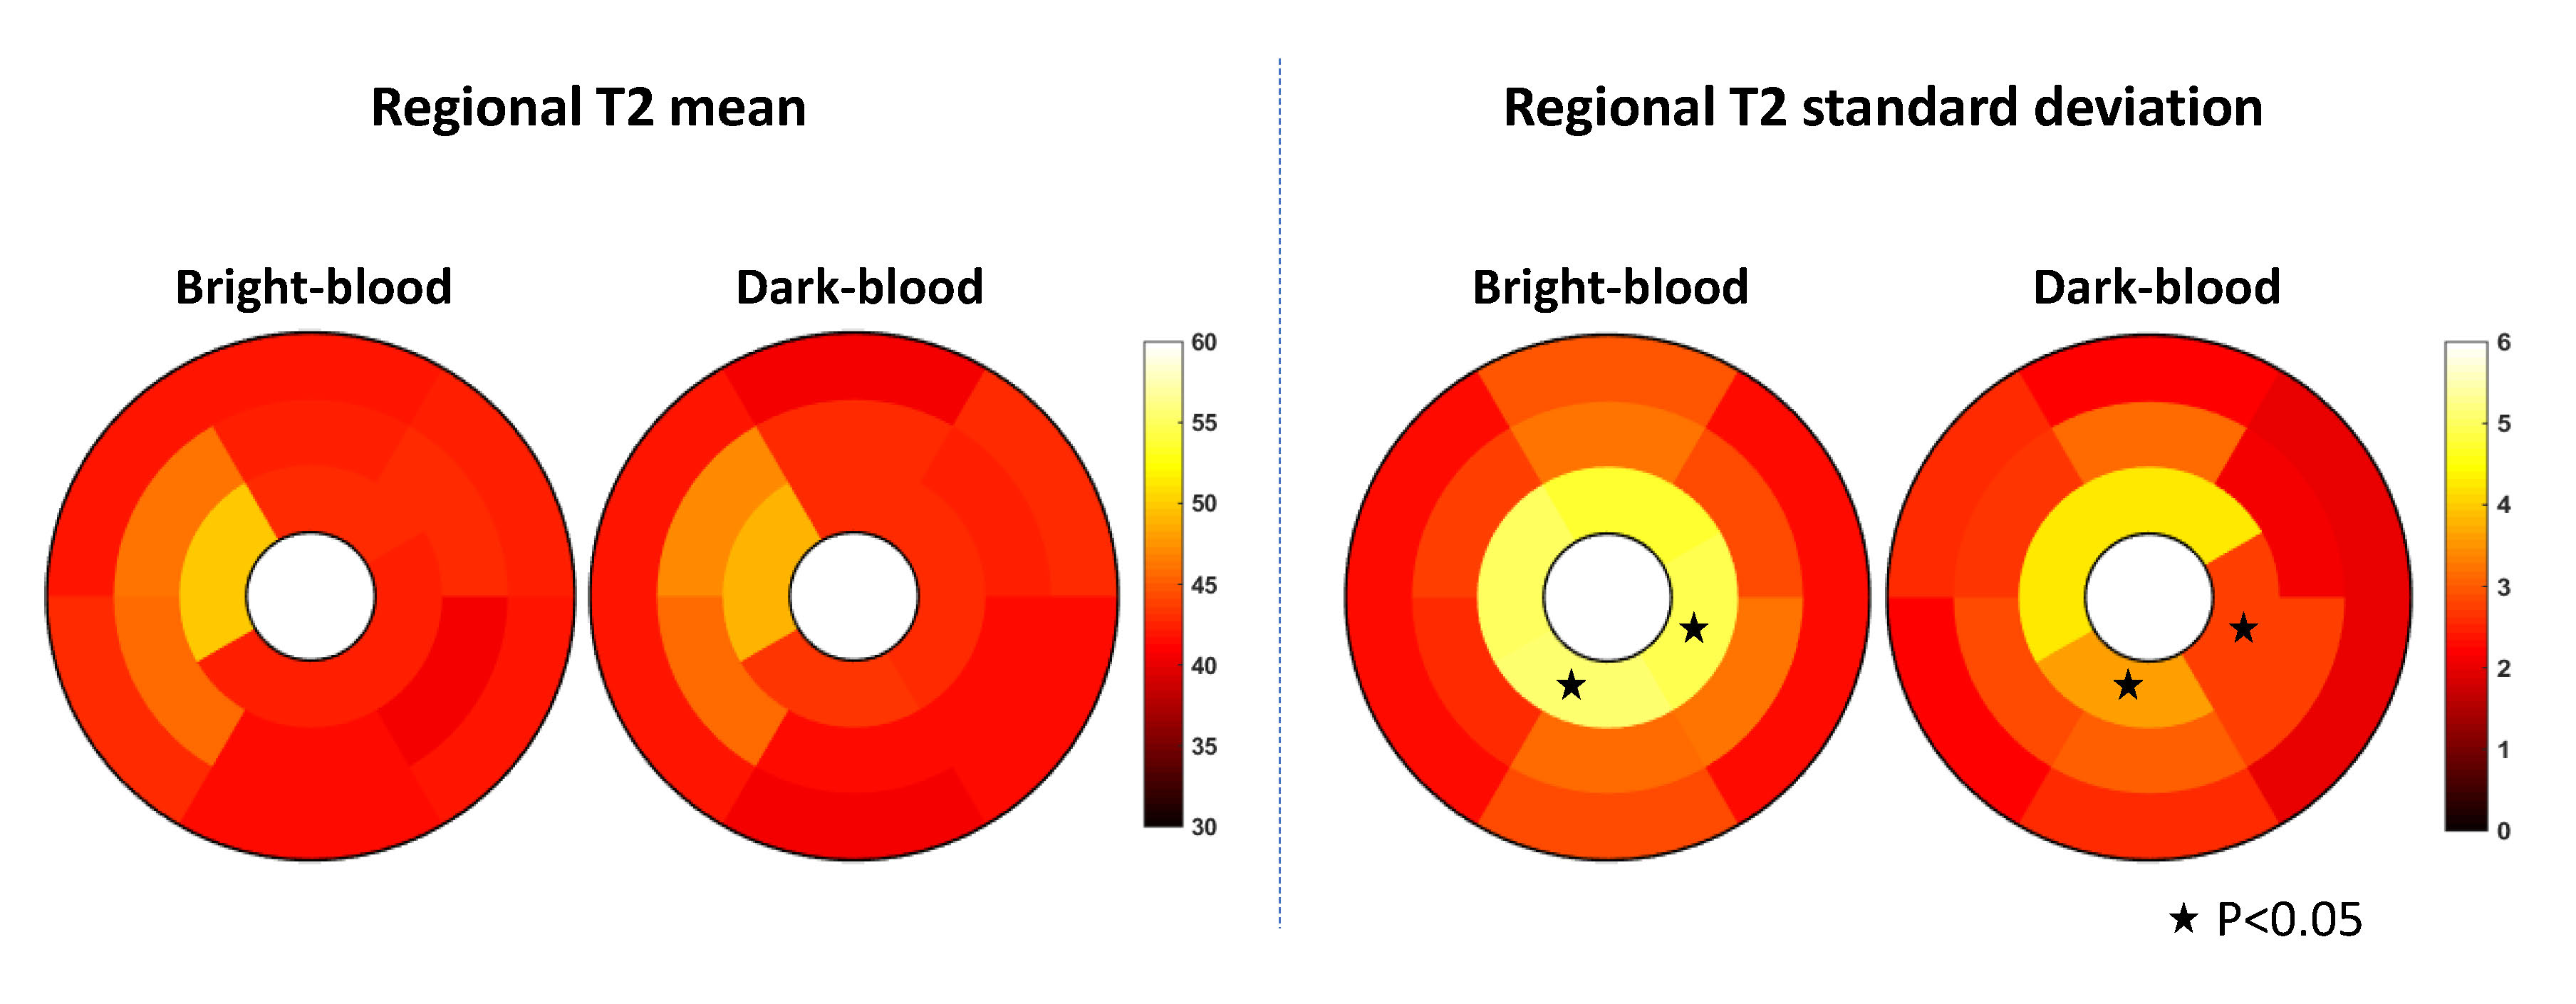
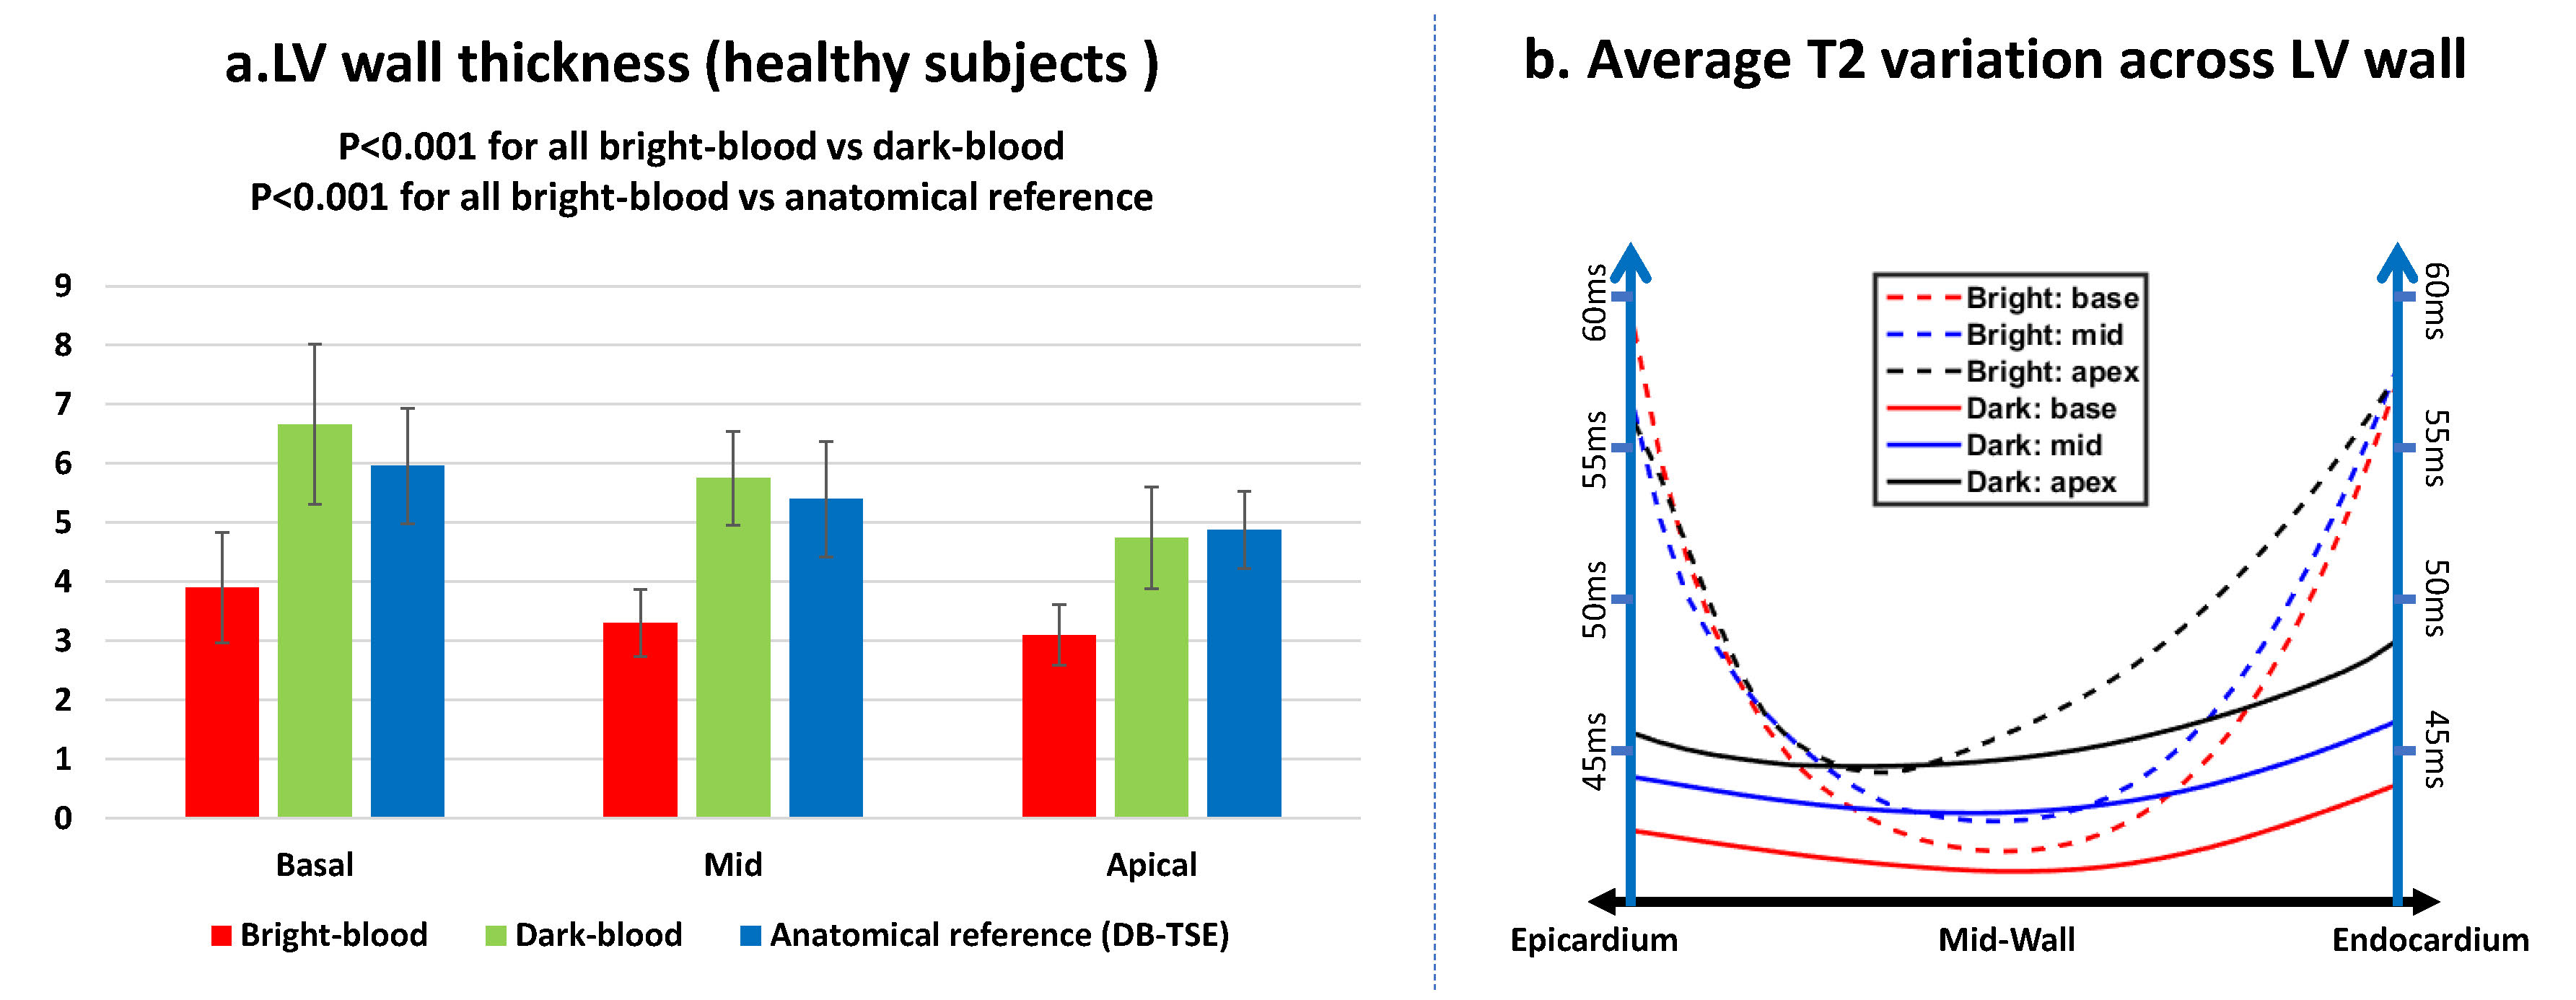
Figure 1 shows T2 maps in two representative healthy subjects, where a better depiction of the LV wall and papillary muscles was obtained with dark-blood T2 mapping. Figure 2 shows the regional T2 mean and standard deviation of the two T2-mapping techniques over 8 healthy subjects, where dark-blood T2 mapping led to better precision in the apical slice and similar accuracy and precision in the other regions. Figure 3a shows that dark-blood T2 mapping led to a thicker myocardium in all regions than bright-blood T2 mapping (by 55%-75%), and a similar thickness relative to the reference method. The thickness of bright-blood T2 mapping was limited by the largely increased partial-voluming (Figure 3b).
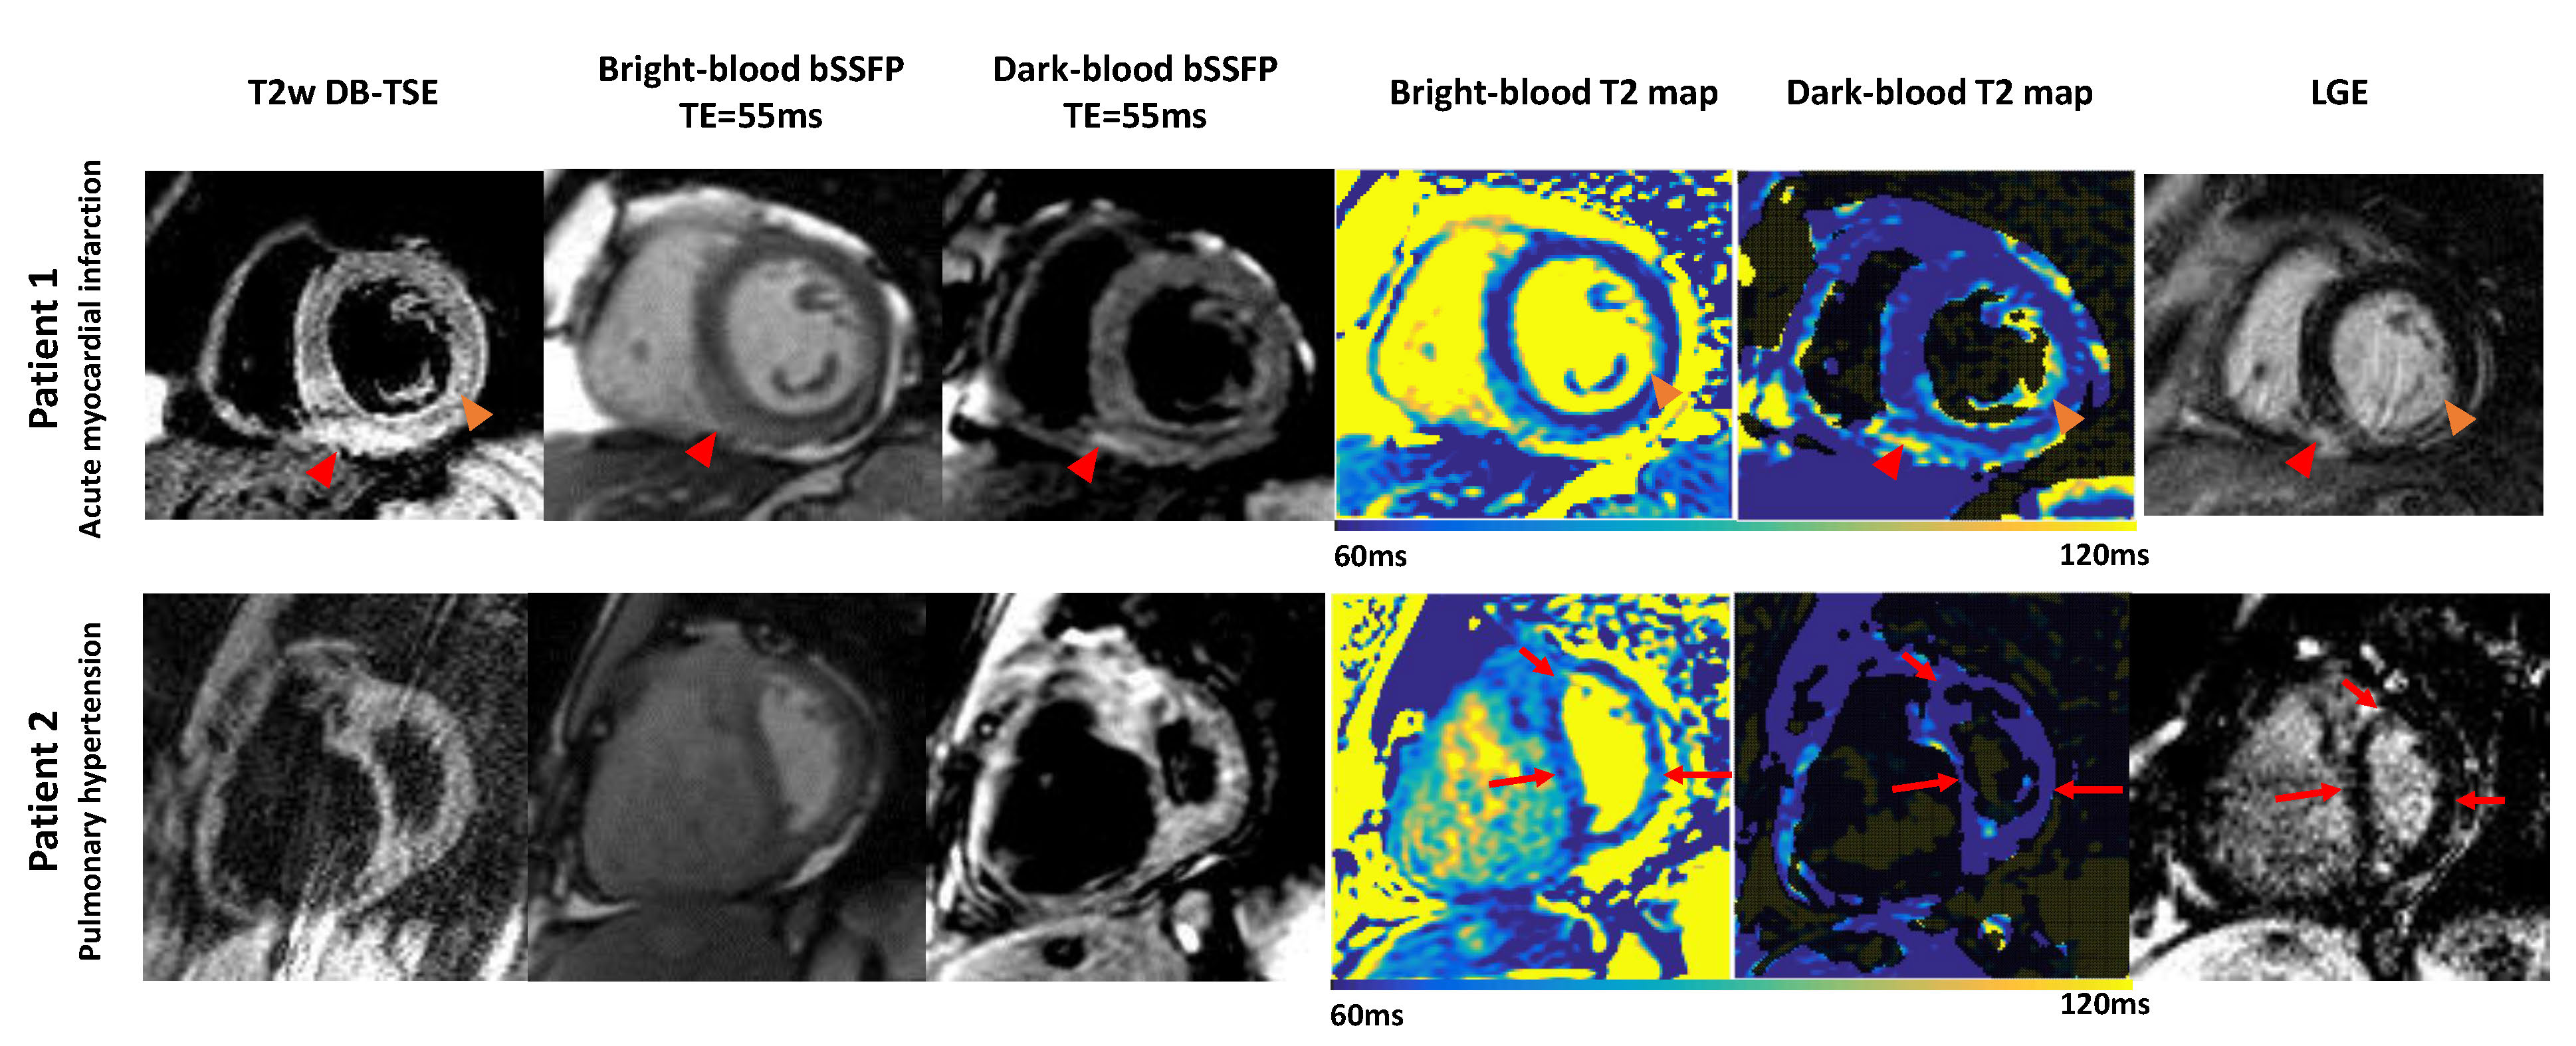
Figure 4 shows the representative images in two patients. For the first patient with acute myocardial infarction, the clinical reading confirmed the presence of edema from the inferoseptal to inferolateral wall. Dark-blood T2 mapping showed a better depiction of edema in the RV insertion point and between the inferolateral wall and the inferior papillary muscle. For the second patient with pulmonary hypertension, clinical reading suggested no edema. However, while dark-blood T2 mapping showed no edema, multiple enhancement arose in bright-blood T2 maps, potentially due to partial-voluming from the blood pool and the pericardial fluid. Figure 5 shows improved LV-wall thickness and partial-voluming scores in the LV, papillary muscles, and RV, and a similar quality score, comparing dark-blood to bright-blood T2 mapping.
Conclusions
The results showed that dark-blood T2 mapping improves the effective myocardial thickness in the LV for T2 evaluation. This finding is consistent with another dark-blood T2 mapping study, using a different blood nulling technique4. The increased thickness may improve the accuracy of T2 in thin-walled structures as shown in our examples. Confirmation of this improvement, however, would require a better gold standard, such as high-resolution T2 mapping or histology.Acknowledgements
No acknowledgement found.References
1. Hu and Peters, Dark-blood T2 mapping for improved assessment of the left ventricular subendocardium, right ventricle and left atrium, ISMRM 2018;
2. Hu et al, Reverse double inversion‐recovery: Improving motion robustness of cardiac T2‐weighted dark‐blood turbo spin‐echo sequence, JMRI 2017;
3. Giri et al, T2 quantification for improved detection of myocardial edema, JCMR 2009;
4. Wang et al. Black blood myocardial T2 mapping, MRM 2018
Figures