0403
Fast T1, T2 evaluation with machine learning for quantitative cardiac MRI1College of Control Science and Engineering, Zhejiang University, Hangzhou, China, 2Department of Radiological Sciences, David Geffen School of Medicine, University of California, Los Angeles, Los Angeles, CA, United States
Synopsis
Quantitative
T1/T2 mapping provides important cardiovascular prognostic value. Conventional dictionary-matching
based methods are time consuming for cardiac T1/T2 mapping as the dictionary
need to be generated on-line. In this work, we propose to use machine learning
algorithms for faster T1/T2 prediction. Bloch equation simulation was used to
generate training data. The XGBoost and DNN models were evaluated and compared
based on simulation, phantom and in vivo studies. Results demonstrated that
using the machine learning approach can generate cardiac T1 and T2 maps much
faster while generating similar T1 and T2 values compared to the conventional
dictionary-matching approach.
Introduction
Quantitative evaluation of MR parameters is important for diagnosis of diseases such as edema and diffuse fibrosis1-3. The conventional approach for quantitative evaluation of T1 and T24-8 is dictionary matching8-10. However, when dictionary matching is applied to cardiac MRI, the dictionary needed to be generated after the image was acquired due to the inconsistent cardiac activities, leading to much longer in-line T1/T2 map reconstruction time. Machine learning manifests effectiveness in classification and regression problems in biomedicine11-13. For instance, Hoppe et al. 14 applied convolutional neural network to Magnetic Resonance Fingerprinting. In this work, statistical learning methods with XGBoost15 and Deep Neural Network were used to predict T1 and T2 values pixel-by-pixel and was tested based on simulation, phantom and in vivo studies.Methods
A simultaneous radial T1/T2 mapping sequence16 was used, which can generate 110 images in 11 heartbeats, 10 images for each heartbeat. The T1 and T2 maps can be calculated using the conventional dictionary-matching approach by matching the Bloch-equations-simulated signal with the measured signal. However, it is time consuming. To save time, we generated training dataset offline by using Bloch equations to simulate the radial sequence for various T1, T2, flip angle (FA) and heart rates, and then train the machine learning algorithms to predict T1 and T2 directly using 120 features as input, including the 110 signal intensities and the 10 heartbeat intervals.
According to the normal parameters for 3T MRI, we randomly sampled T1 from 200 to 2000ms and T2 from 20 to 200ms, flip angle (FA) from 3° - 8° (nominal FA = 6° in the sequence) and heart rate from 40 to 100 bpm. 10% Gaussian noise was added to the heartbeat intervals before simulation. 1,200,000 samples were simulated in total. Then, 1,000,000 samples were randomly selected as training samples with 100,000 samples for validation set and test set, respectively. To improve the generalization ability, random noises (SNR=100) were added to the simulated signal.
XGBoost17-19 and Deep Neural Network, two typical algorithms representing tree boosting20 and deep learning11-12 usually used for large-volume data mining were applied for T1 and T2 prediction. The hyper-parameters for each algorithm were tuned based on performances on validation set. After the models training, the models were evaluated using the simulated test set, phantom and in vivo data, using the conventional dictionary-matching approach as reference for phantom and in vivo studies.
Results
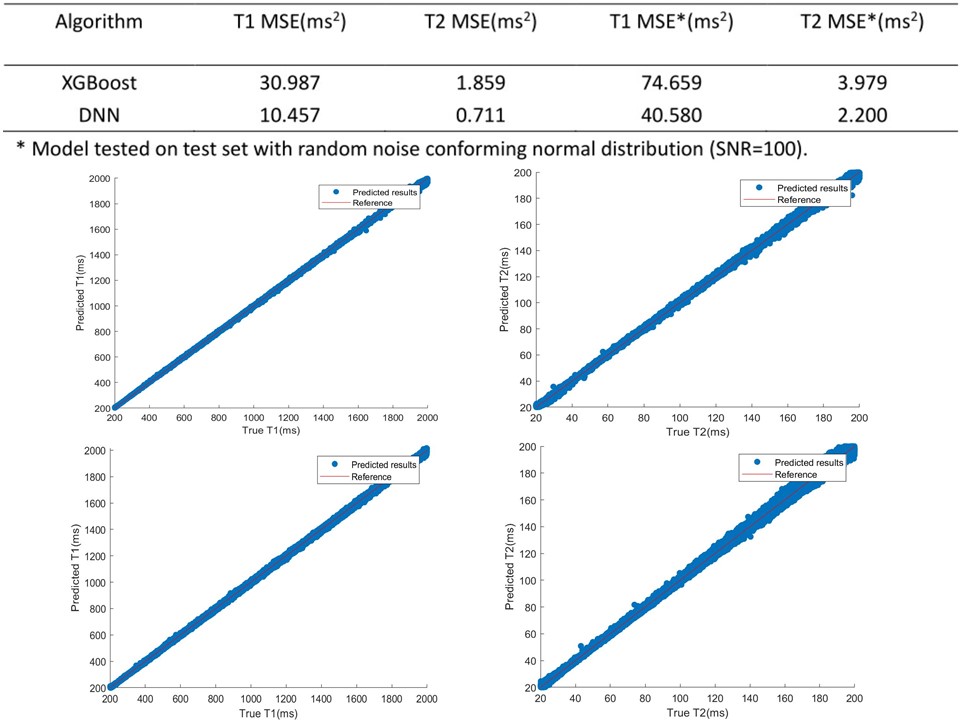
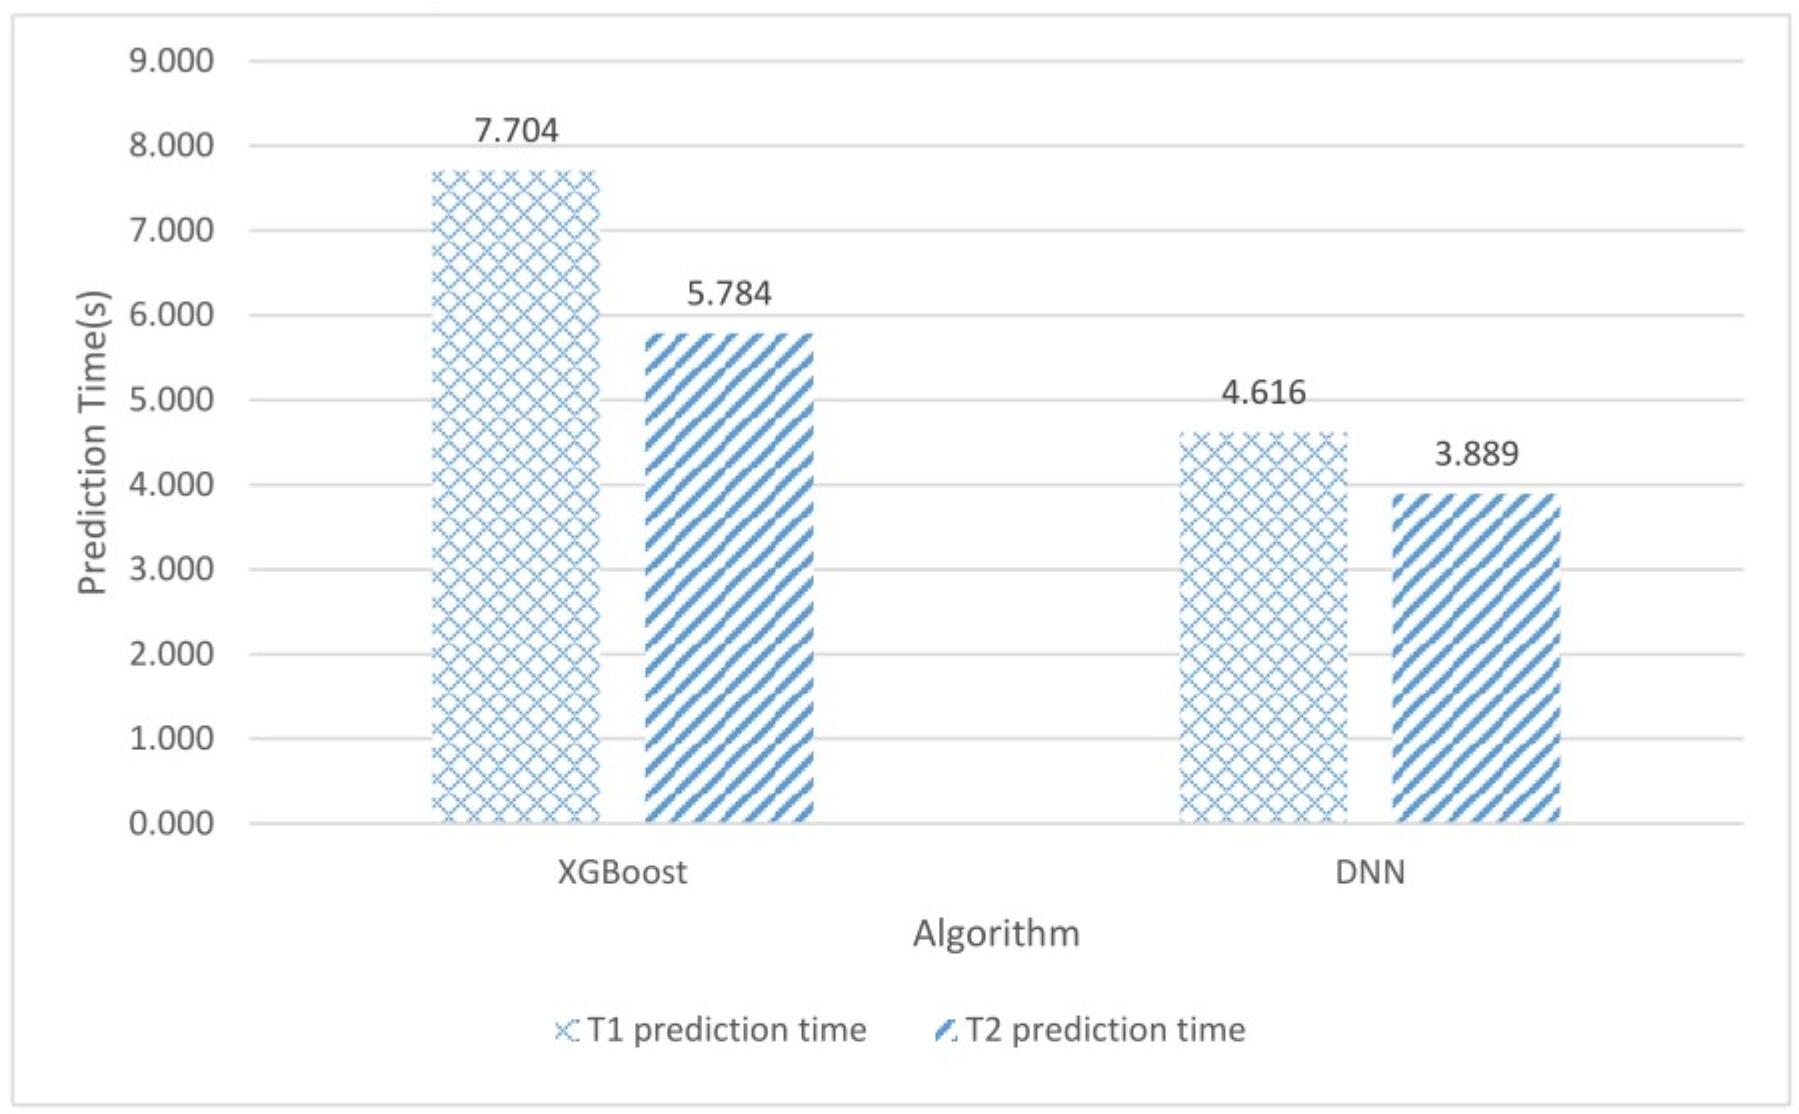
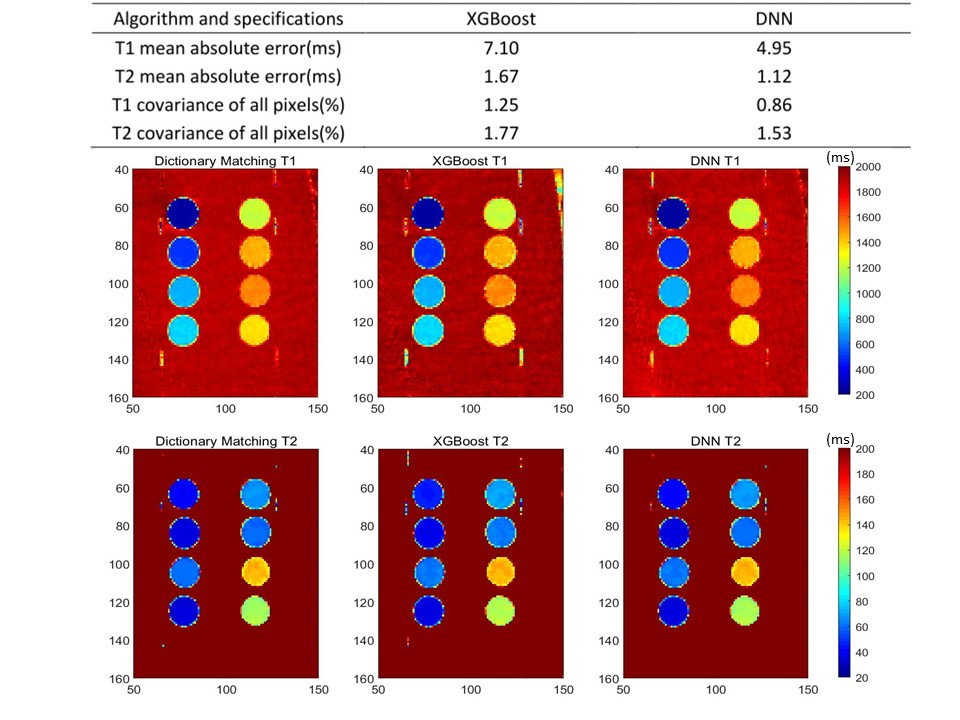
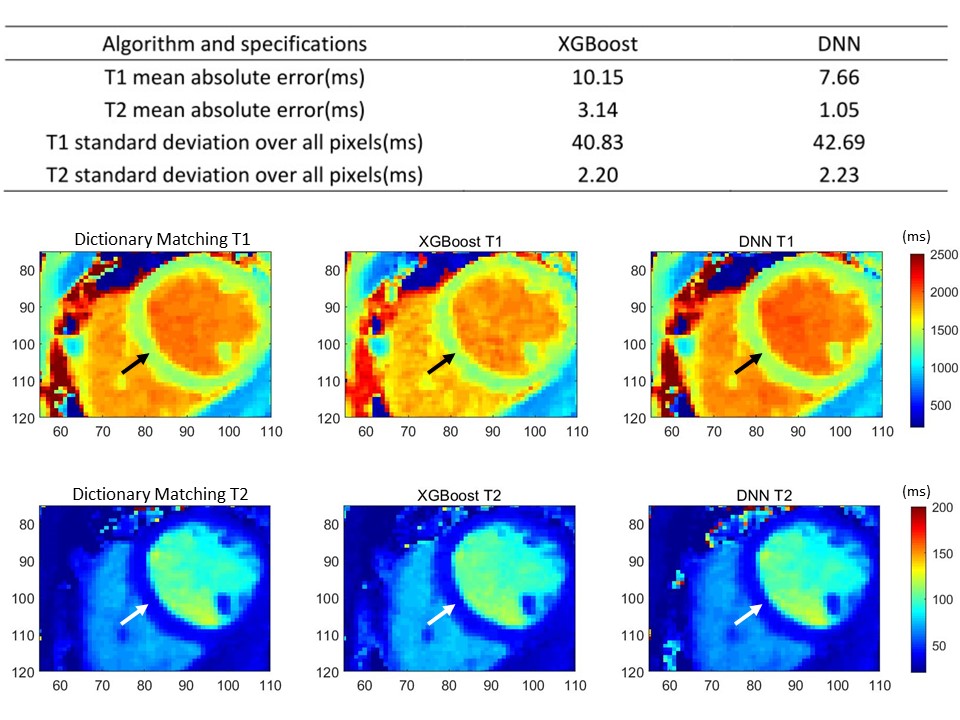
The performances of different models are shown in Figure 1. The average time costs of XGBoost and DNN models over 100,000 samples with a PC without GPU acceleration are shown in Figure 2. On phantom data sets, Figure 3 shows visualized results of dictionary-matching method, XGBoost and DNN over 8 phantoms with different T1/T2. Comparisons were also made between XGBoost and DNN with dictionary matching as reference. The in vivo study was based on MRI results of six volunteers with written approval. The results on myocardium regions are shown in Figure 4.Discussion
According to the results, in simulation study, over 100,000 noiseless validation samples and 100,000 noise-added test samples, the MSE of T1 and T2 are less than 75ms2 and 4ms2 respectively. When applied to phantom study and in vivo study, the best models have mean absolute error less than 10ms for T1 and less than 4ms for T2, which manifest the accuracy of machine-learning based T1 and T2 mapping for clinical applications. Meanwhile, the visualized results manifest the consistence among dictionary-matching method, XGBoost and DNN. Additionally, for 192-by-192 voxels T1/T2 image, the time cost is ~5s to 6s, which is much faster than dictionary matching methods that takes 1 hour to several hours depending on the size of the dictionary.Conclusion
Machine learning can be used for rapid T1 and T2 mapping for cardiac MRI. XGBoost and DNN show accuracy, fastness and robustness to noise in simulation, phantom and in vivo studies. In the future, more work will be done on model optimization with feature engineering methods for more accurate and more precise models.Acknowledgements
This work is supported by David Geffen School of Medicine, University of California, Los Angeles.References
1. Warntjes J B, Dahlqvist O, Lundberg P. Novel method for rapid, simultaneous T1, T2*, and proton density quantification[J]. Magnetic Resonance in Medicine, 2010, 57(3):528-537.
2. Warntjes J, Leinhard O J, Lundberg P. Rapid magnetic resonance quantification on the brain: Optimization for clinical usage[J]. Magnetic Resonance in Medicine, 2010, 60(2):320-329.
3. Schmitt P, Griswold M A, Jakob P M, et al. Inversion recovery TrueFISP: Quantification of T 1, T 2, and spin density[J]. Magnetic Resonance in Medicine, 2004, 51(4):661–667.
4. Peter K, Hansen M S. T1-mapping in the heart: accuracy and precision[J]. J Cardiovasc Magn Reson, 2014, 16(1):2-2.
5. Moon J C, Messroghli D R, Peter K, et al. Myocardial T1 mapping and extracellular volume quantification: a Society for Cardiovascular Magnetic Resonance (SCMR) and CMR Working Group of the European Society of Cardiology consensus statement[J]. J Cardiovasc Magn Reson, 2013, 15(1):92-92. 6. Wong T C, Piehler K M, Kang I A, et al. Myocardial extracellular volume fraction quantified by cardiovascular magnetic resonance is increased in diabetes and associated with mortality and incident heart failure admission[J]. European Heart Journal, 2014, 35(10):657.
7. Messroghli D R, Niendorf T, Schulzmenger J, et al. T1 mapping in patients with acute myocardial infarction.[J]. J Cardiovasc Magn Reson, 2003, 5(2):353-359.
8. Dan Ma, Vikas Gulani, Nicole Seiberlich, et al. Magnetic Resonance Fingerprinting[J]. Nature, 2013, 495(7440):187-192.
9. Cauley S F, Setsompop K, Ma D, et al. Fast group matching for MR fingerprinting reconstruction[J]. Magnetic Resonance in Medicine, 2015, 74(2):523-528.
10. Wang Z, Zhang Q, Yuan J, et al. MRF denoising with compressed sensing and adaptive filtering[C]// IEEE, International Symposium on Biomedical Imaging. IEEE, 2014:870-873.
11. Würfl T, Ghesu F C, Christlein V, et al. Deep Learning Computed Tomography[M]// Medical Image Computing and Computer-Assisted Intervention -- MICCAI 2016. Springer International Publishing, 2016:432-440.
12. Hammernik K, Würfl T, Pock T, et al. A Deep Learning Architecture for Limited-Angle Computed Tomography Reconstruction[M]// Bildverarbeitung für die Medizin 2017. Springer Berlin Heidelberg, 2017. 13. Zhan, X.; Guan, X.; Wu, R.; Wang, Z.; Wang, Y.; Li, G. Discrimination between Alternative Herbal Medicines from Different Categories with the Electronic Nose. Sensors 2018, 18, 2936.
14. Hoppe E, Körzdörfer G, Würfl T, et al. Deep Learning for Magnetic Resonance Fingerprinting: A New Approach for Predicting Quantitative Parameter Values from Time Series[J]. Studies in Health Technology & Informatics, 2017, 243:202.
15. Chen T, Guestrin C. XGBoost:A Scalable Tree Boosting System[C]// ACM SIGKDD International Conference on Knowledge Discovery and Data Mining. ACM, 2016:785-794.
16. Shao J, Zhou Z, Nguyen K, Hu P. Simultaneous myocardial T1 and T2 mapping using a radial sequence with inversion recovery and T2 preparation. SCMR 2019 (Accepted)
17. T. Chen, S. Singh, B. Taskar, C. Guestrin. Efficient second-order gradient boosting for conditional random fields. In Proceeding of 18th Artificial Intelligence and Statistics Conference (AISTATS’ 15), volume 1, 2015.
18. J. Bennett and S. Lanning. The Netflix Prize. In Proceedings of the KDD Cup Workshop 2007, pages 3-6, New York, Aug. 2007.
19. P. Li. Robust Logitboost and adaptive base class (ABC) Logitboost. In Proceedings of the Twenty-Sixth Conference Annual Conference on Uncertainty in Artificial Intelligence (UAI’10), pages 302-311, 2010.
20. Friedman J H. Greedy function approximation: A gradient boosting machine.[J]. Annals of Statistics, 2001, 29(5):1189-1232.
21. Kingma D P, Ba J. Adam: A Method for Stochastic Optimization[J]. Computer Science, 2014.
Figures