0399
Quantitative intra-tumoral-susceptibility-signal (ITSS) vasculature volume (IVV) using QSM vs R2* approach for Glioma Grading1Center for Biomedical Engineering, Indian Institute of Technology, Delhi, NEW DELHI, India, 2Philips Health Systems, Philips India Limited, Gurugram, India, 3Health Systems, Philips India Limited, Philips Innovation Campus, Bangalore, India, 4Department of Radiology, Fortis Memorial Research Institute, Gurugram, India, 5Department of Biomedical Engineering, All India Institute of Medical Science, New Delhi, India
Synopsis
Susceptibility-weighted imaging (SWI) improves the diagnostic accuracy by detecting intra-tumoral-susceptibility-signal-intensities (ITSS). Existing semi-quantitative methods are observer-dependent which manually counts intra-tumoral-susceptibility-signal-intensities (ITSS); a combination of haemorrhage and vasculature.
Purpose
Susceptibility-weighted-imaging (SWI) is combined with other MRI-techniques such as diffusion-weighted-imaging (DWI), dynamic-susceptibility-contrast(DSC) or dynamic-contrast-enhanced(DCE) to improve the Glioma grading1-2. SWI provides information about intra-tumoral-susceptibility-signal (ITSS) or the low-signal-intensities seen on magnitude-SWI images. Park.et.al3 has established semi-quantitative-method of manually counting ITSS from SWI and grade the tumors according to the degree of presence of ITSS. This semi-quantitative-count is manual and observer-dependent. In a recently reported study4, ITSS was automatically segmented into hemorrhage and tumor-vasculature using SWI data based R2* map. Segmented tumor volume was used for quantitative-ITSS-vasculature-volume (IVV) estimation, which provided improved glioma grading. Studies have shown5-6 that quantitative-susceptibility-mapping (QSM) helps to characterize different stages of intracranial-hemorrhages and calcifications. Objectives of the current study was to use QSM for segmentation of ITSS into hemorrhage and vasculature; compute IVV and compare the results with R2*-based-IVV; evaluate its role in glioma grading.Method
This IRB-approved-retrospective-study included total 30 glioma patients (10 each of grade II, III and IV, grades confirmed histologically as per WHO-2016-criteria). These patients underwent MRI on a 3.0T scanner (Ingenia, Philips Healthcare, The Netherlands). SWI data were acquired with 4 echoes at 5.6, 11.8, 18, 24.2ms(TR=31ms; flip-angle=17°, slice-thickness=1.0mm, acquisition-matrix=384×384, FOV=240×240mm2). SW-Magnitude images were obtained from scanner by multiplying fast-field-echo (FFE)-M image with a phase-mask derived from PADRE(Phase-Difference-Enhanced-imaging) filtering process. The R2*-maps were calculated from SWI-multi-echo-magnitude images using method described by Haacke et.al7. QSM-maps were generated as reported by Meineke et.al8. Field map generated from all 4-echoes, was taken as input into a regularized de-convolution algorithm for obtaining the source susceptibility map from the field data. ITSS were segmented by MATLAB-based in-house developed thresholding and shape-based-structural algorithm4. These ITSS masks were generated for all the slices containing tumor. R2* and QSM values for hemorrhage-tissues were picked from five proven chronic-hemorrhage-non-tumor-cases (identified by expert radiologists). These observations go in-line with intra-cerebral hemorrhage QSM values reported by Chang et.al.5 R2*-hemorrhage and QSM-hemorrhage values were used as thresholds for detecting hemorrhage within tumors. Hemorrhages normally can be seen as large-conglomerating-blobs. R2*-threshold = 125 1/s, QSM-threshold=0.4 parts-per-million was used to ensure that all components of hemorrhage could be discarded using this lower-limit-threshold in combination with connected-component-analysis. The vasculature-separation algorithm reported in literature4 was replicated using R2*-threshold as well as QSM-threshold values to segment vasculature within ITSS. This segmentation was performed over all the tumor slices to finally calculate R2*-based-IVV and QSM-based-IVV. Statistical unpaired-t-test was performed using Medcalc9 to check whether there is any significant difference of QSM-based-IVV between various grades, compared to R2*-based-IVV and semi-quantitative-ITSS-count. Correlation-coefficient, Dice and Jaccard similarity-measures were computed between R2* vs QSM-based-IVV.Results
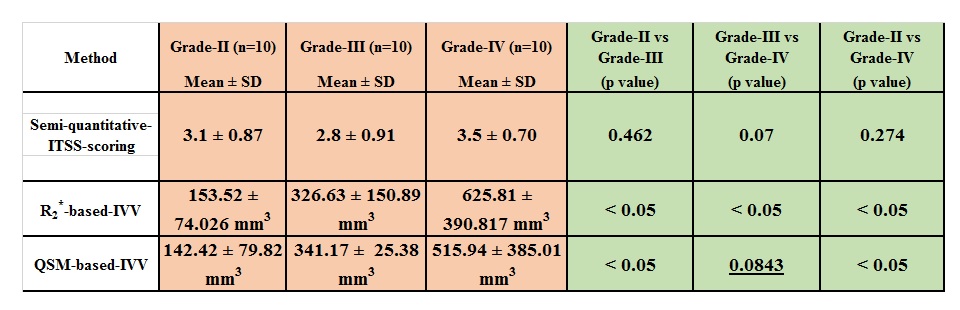
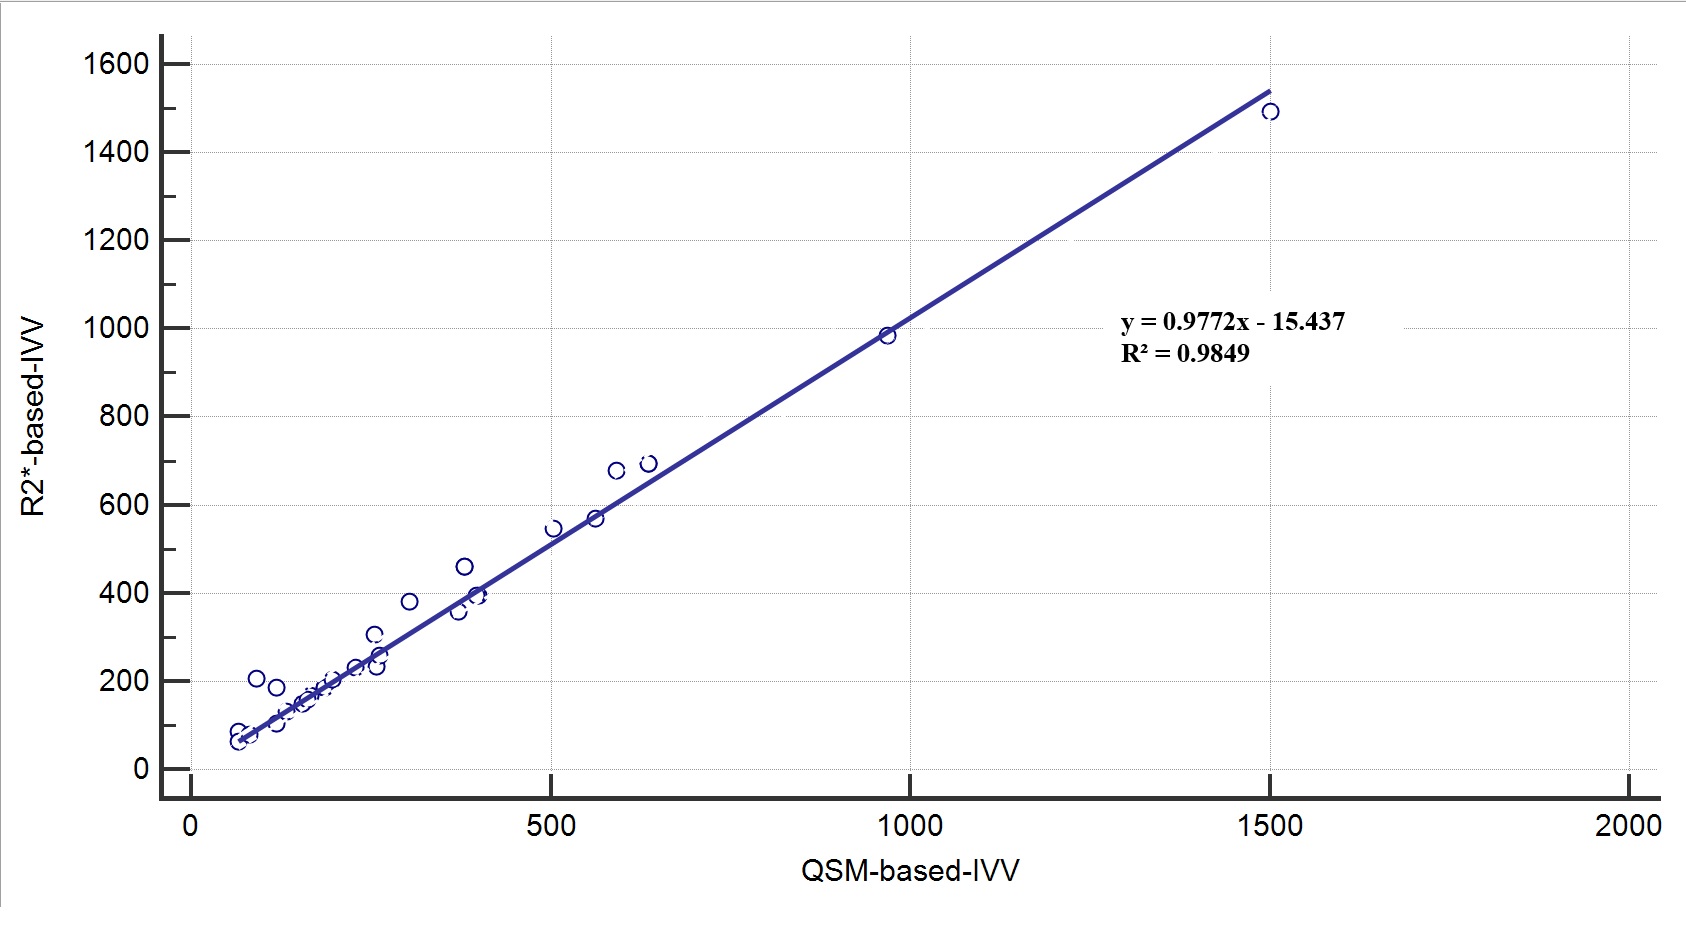
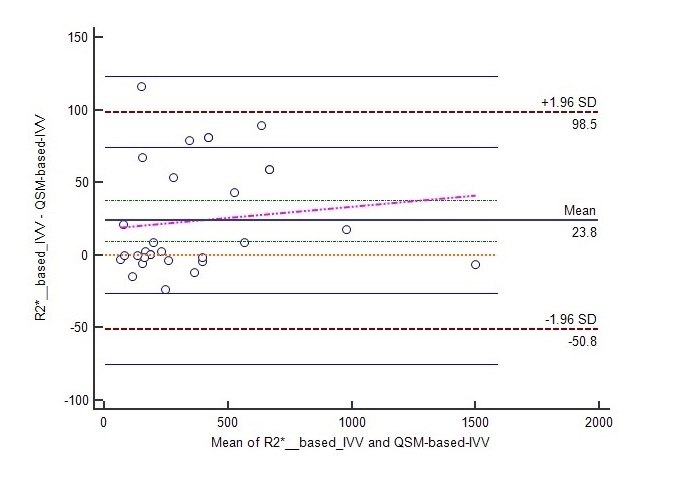
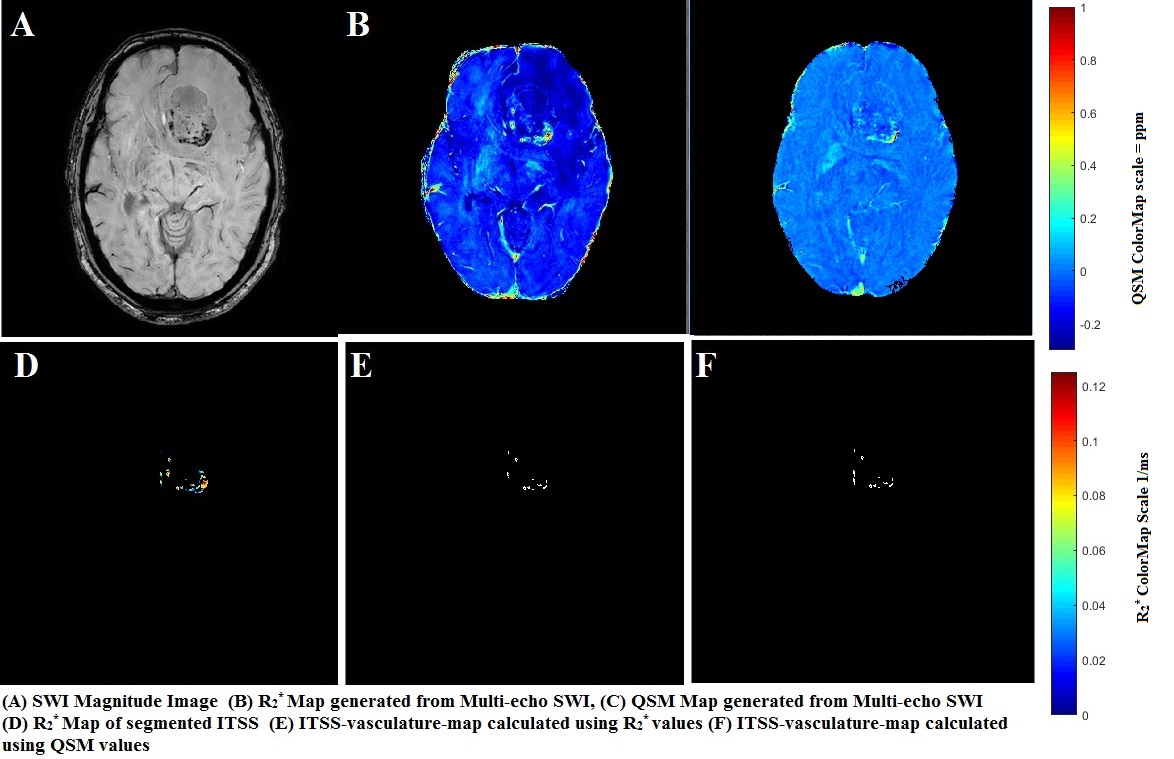
Table-1 summarizes the mean and SD values for R2*-based-IVV, QSM-based-IVV and semi-quantitative-ITSS-count for grade II, III and IV glioma cases. IVV was higher in grade III compared to grade II; in grade IV compared to grade II and III in both R2*-based as well as QSM-based approach. Unpaired-t-test between R2*-based-IVV of grade-II-vs-III, III-IV, II-vs-IV resulted in significant difference (p<0.05). QSM-based-IVV was significantly different for grade II-vs-III and grade-II-vs-IV. Scatterplot regression analysis and Bland-Altman plots using R2*-based-IVV and QSM-based-IVV are shown in figure-1 and 2. The correlation was r = 0.98 and limit-of-agreement was -50.8 to 98.5 between these two methods. Figure-3 shows a sample-case of IVV calculation using both approaches. The average Dice and Jaccard coefficients for grade-II, grade-III and grade-IV patients between R2*-based-IVV and QSM-based-IVV were 0.94 and 0.88, 0.91 and 0.84, 0.75 and 0.79 respectively.Discussion and Conclusion
Both R2*-based-IVV and QSM-based-IVV calculation helps to discriminate between grade-II vs III and grade-II vs IV of glioma significantly compared to semi-quantitative grading; for glioma cases where SWI has visible ITSS. R2*-based-IVV scores better in significantly differentiating grade-III vs grade-IV compared to QSM-based-IVV. The Dice and Jaccard coefficients are also the lowest for grade-IV between these two methods. Both R2* and quantitative-susceptibility represent tumor-hypoxia which induces intra-tumoral-vasculature caused by formation of the neo-vasculature and increased intra-tumoral-oxygen demand. The higher correlation-coefficient between these two methods strengthens the above concept. This also goes in-line with the studies reported in hepatic regions comparing mean R2* and QSM values11. QSM and R2* contrast for hemorrhage is mainly determined by the increased-BOLD-effect which is caused by higher deposition of hemosiderin and deoxyhemoglobin in hemorrhage components. Therefore both these methods can be used interchangeably to calculate IVV for grade-II-vs-III and grade-II-vs-IV. For grade-III-vs-IV R2*-based-IVV still remains the preferred option. This QSM-based-IVV approach needs to be further evaluated in a larger-sample-size of different groups of glioma patients.Acknowledgements
The authors acknowledge technical support of Philips India Limited and Philips Research team in Hamburg.References
[1] Saini, J., Gupta, P. K., Sahoo, P., Singh, A., Patir, R., Ahlawat, S., Gupta, R. K. (2018). Differentiation of grade II/III and grade IV glioma by combining “T1 contrast-enhanced brain perfusion imaging” and susceptibility-weighted quantitative imaging. Neuroradiology, 60(1), 43–50.
[2] Xu, Jianxing, Hai Xu, Wei Zhang and Jiangang Zheng. “Contribution of susceptibility- and diffusion-weighted magnetic resonance imaging for grading gliomas.” Experimental and therapeutic medicine 15 6 (2018): 5113-5118.
[3] Park MJ, Kim HS, Jahng GH, et al. Semiquantitative assessment of intratumoral susceptibility signals using non-contrast-enhanced high-field high-resolution susceptibility-weighted imaging in patients with gliomas: comparison with MR perfusion imaging. AJNR Am J Neuroradiol Aug 2009: 30:1402– 08
[4] Bhattacharjee R, Budania P, Gupta PK, Gupta RK, Ahlawat S, Singh A. Quantitative Micro-Vasculature Volume Assessment of Intra Tumoral Susceptibility Signal (ITSS) in differentiating Grade-III from IV glioma. ISMRM-ESMRMB 2018, Paris, France (Proc.Intl.Soc.Mag.Reson.Med. 26(2018), Page Nu-3420).
[5] Chang, Shixin et al. “Quantitative Susceptibility Mapping of Intracerebral Hemorrhages at Various Stages” Journal of magnetic resonance imaging : JMRI vol. 44,2 (2015): 420-5.
[6] Chen, Weiwei et al. “Intracranial calcifications and hemorrhages: characterization with quantitative susceptibility mapping” Radiology vol. 270,2 (2014): 496-505.
[7] Haacke EM, Cheng NY, House MJ, et al. Imaging iron stores in the brain using magnetic resonance imaging. Magn Reson Imaging 2005; 23: 1–25.
[8] Meineke J, Wenzel F, Wilkinson I, Katscher U. No significant increase of magnetic susceptibility found in subcortical gray matter of patients with Alzheimer’s Disease. In: ISMRM 25th Annual Meeting, Honolulu, HI. ; 2017:#2348
[9] MedCalc Statistical Software Version 14.8.1 (2014) MedCalc Software Bvba, Ostend.
[10] Sharma, Samir D et al. “MRI-based quantitative susceptibility mapping (QSM) and R2* mapping of liver iron overload: Comparison with SQUID-based biomagnetic liver susceptometry” Magnetic resonance in medicine vol. 78,1 (2016): 264-270.
Figures