0398
Differentiation of IDH1 mutant and wild-type gliomas based on metabolic signatures obtained from pH- and oxygen-sensitive molecular MRI1Brain Tumor Imaging Laboratory (BTIL), Center of Computer Vision and Imaging Biomarker, David Geffen School of Medicine, University of California, Los Angeles, Los Angeles, CA, United States, 2Department of Bioengineering, Henry Samueli School of Engineering and Applied Science, University of California, Los Angeles, Los Angeles, CA, United States, 3Department of Radiological Sciences, David Geffen School of Medicine, University of California, Los Angeles, Los Angeles, CA, United States, 4Department of Neurosurgery, David Geffen School of Medicine, University of California, Los Angeles, Los Angeles, CA, United States, 5UCLA Brain Research Institute (BRI), David Geffen School of Medicine, University of California, Los Angeles, Los Angeles, CA, United States, 6Brain Tissue Translational Resource (BTTR), David Geffen School of Medicine, University of California, Los Angeles, Los Angeles, CA, United States, 7Department of Pathology and Laboratory Medicine, David Geffen School of Medicine, University of California, Los Angeles, Los Angeles, CA, United States, 8Department of Neurology, David Geffen School of Medicine, University of California, Los Angeles, Los Angeles, CA, United States, 9Physics and Biology in Medicine, David Geffen School of Medicine, University of California, Los Angeles, Los Angeles, CA, United States, 10Department of Psychiatry and Biobehavioral Sciences, David Geffen School of Medicine, University of California, Los Angeles, Los Angeles, CA, United States
Synopsis
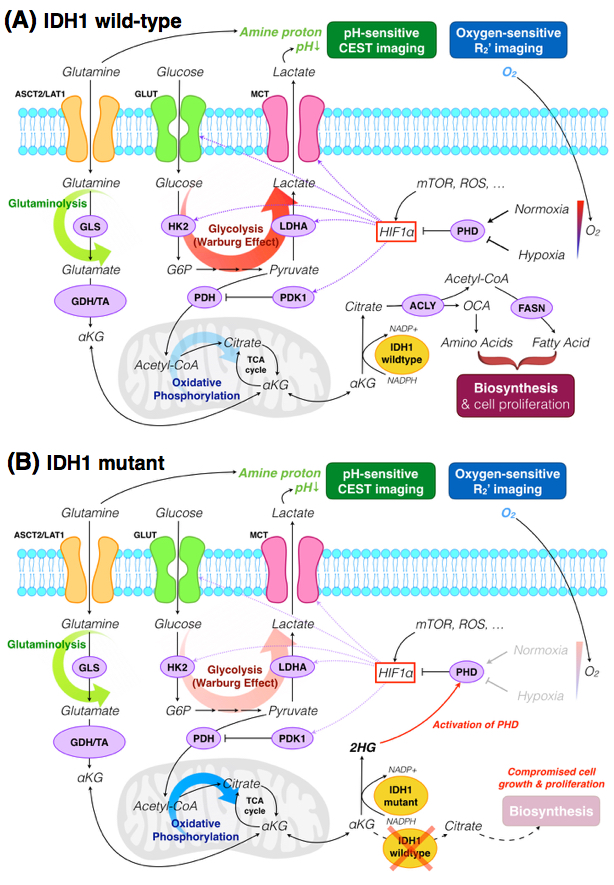
In the current study, we have demonstrated that pH- and oxygen-sensitive amine CEST-SAGE-EPI (chemical exchange saturation transfer spin-and-gradient-echo echoplanar imaging) is a clinically feasible, powerful imaging technique for distinguishing between IDH1-mutant and wild-type gliomas. Results suggest that IDH1 mutation is associated with lower MTRasym at 3.0ppm and lower R2’, implying lower acidity and vascular hypoxia. We hypothesize that 2-HG produced by IDH1-mutant activates PHD and the degradation of HIF1α, subsequently preventing a metabolic shift from oxidative phosphorylation to glycolysis. This is supported by our histological findings of loss of correlation between levels of hypoxia and HIF1α tissue expression in IDH1 mutants.
INTRODUCTION
Mutation in IDH is found in ~80% of WHO grade II, grade III gliomas along with secondary glioblastomas, but is rarely found in primary glioblastomas1. Almost all mutations in IDH1 occur at R132 residue, which impairs the protein’s ability to bind isocitrate, and converts alpha-ketoglutarate (α-KG) to R-2-hydroxyglutarate (R-2-HG)2. R-2-HG regulates the activity of α-KG-dependent dioxygenases, including prolyl-hydroxylase domain (PHD), which hydroxylate hypoxia-inducible-factor 1-alpha (HIF1α) and participates in its degradation3. The role of 2-HG in modulating activity of PHD remains controversial, though contemporary studies support the notion that 2-HG activates PHD resulting in inhibition of HIF1α4. HIF1α is a key factor that mediates the cell energy production under hypoxia, shifting glucose metabolism from oxidative phosphorylation to less efficient glycolysis pathway5, leading to the accumulation of lactate and a reduction in extracellular pH. Additionally, HIF1α activates angiogenesis-related signaling5 and plays part in tumor cell self-renewal and proliferation6.
In the current study we demonstrate the ability for amine chemical exchange saturation transfer spin-and-gradient-echo echoplanar imaging (CEST-SAGE-EPI)7 to simultaneously quantify contrast based on pH-dependent chemical exchange and oxygen-sensitive reversible transverse relaxation rate (R2’) to delineate IDH1 mutant and wild-type gliomas, and demonstrate the link between these measurements and immunohistochemistry to better understand metabolic changes in human tumors.
METHODS
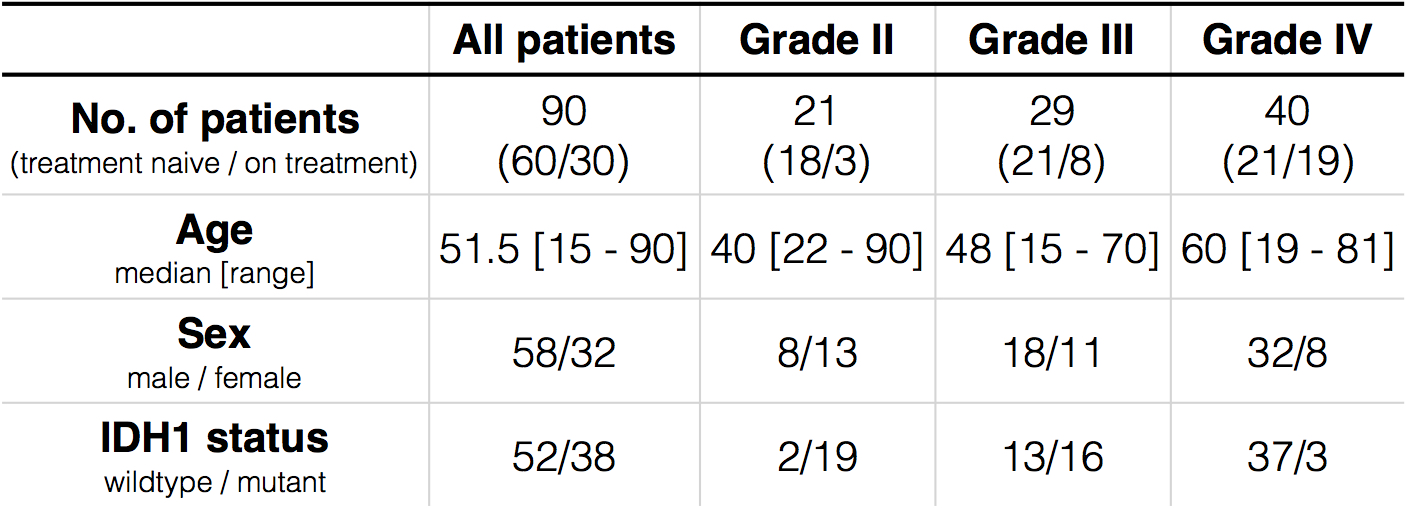
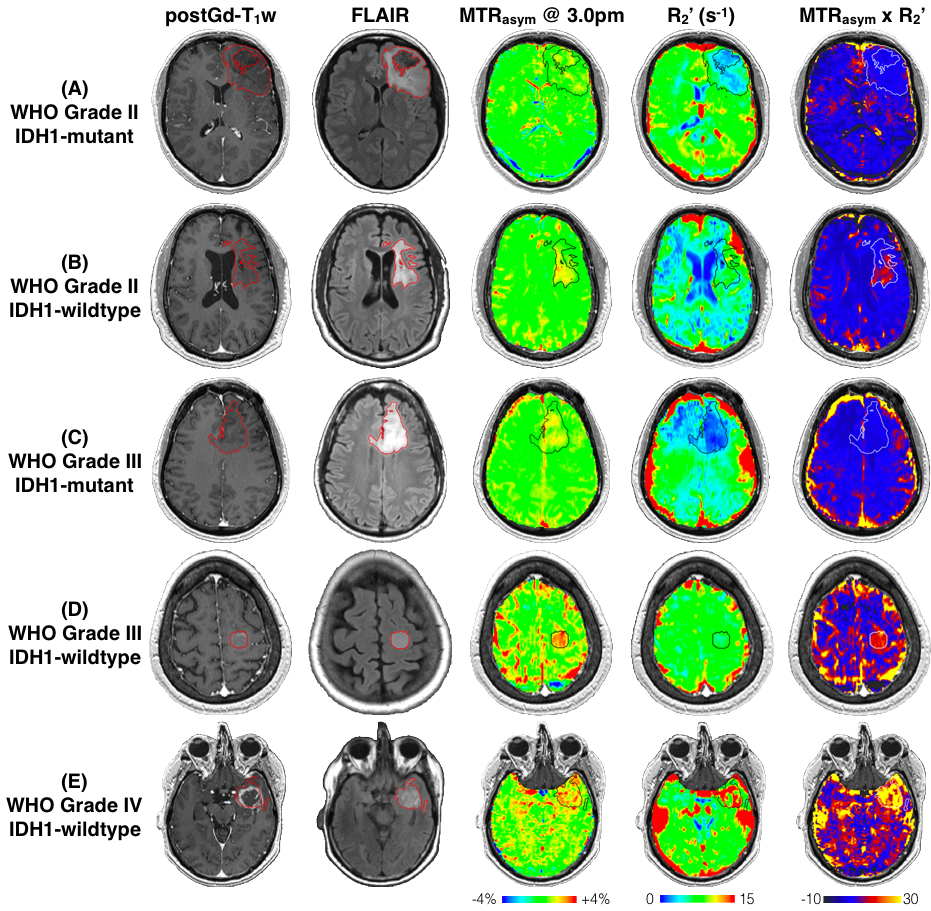
Patient: 90 histologically confirmed glioma patients (WHO II, N=21; WHO III, N=29; WHO IV, N=40) were enrolled in this retrospective study (Table 1). IDH1 status was determined by genomic sequencing or IHC staining of biopsy/surgical resection tissue. Amine CEST-MRI: pH-weighted amine CEST images were collected with CEST-EPI8 (N=35) or CEST-SAGE-EPI7 (N=55). Off-resonance saturation was applied using a pulse train of 3x100ms Gaussian pulses with peak amplitude of 6µT. Post processing of CEST data consists of motion correction, z-spectra based B0 correction, followed by the calculation of magnetization transfer ratio asymmetry (MTRasym) at amine proton resonance frequency (3.0ppm) as the metric of CEST contrast. Using CEST-SAGE-EPI, the signal intensity from four echoes were used to estimate R2, R2*, and R2’ as described previously7. Based on the hypothesis that IDH1-mutant gliomas would have both lower acidity and lower hypoxia, we propose the product of MTRasym at 3.0ppm and R2’ (MTRasym x R2’) as a stronger imaging biomarker for discrimination of genotype. IHC staining: 58 MRI guided biopsy/tissue resection samples from 26 patients were stained with HIF1α and Ki67. “Positive cell percentage” was defined as the ratio of positive cells to total cells.RESULTS
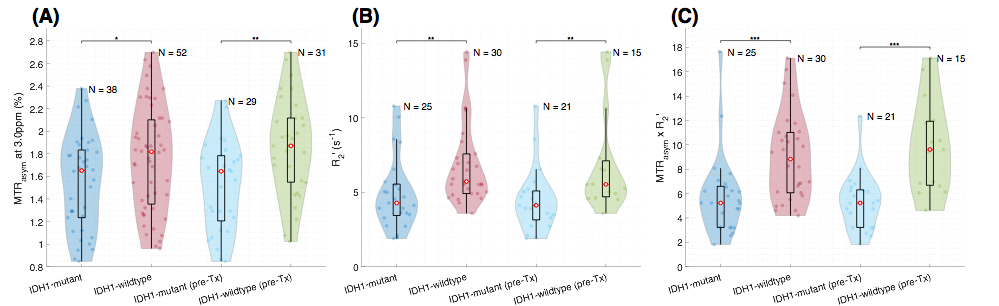
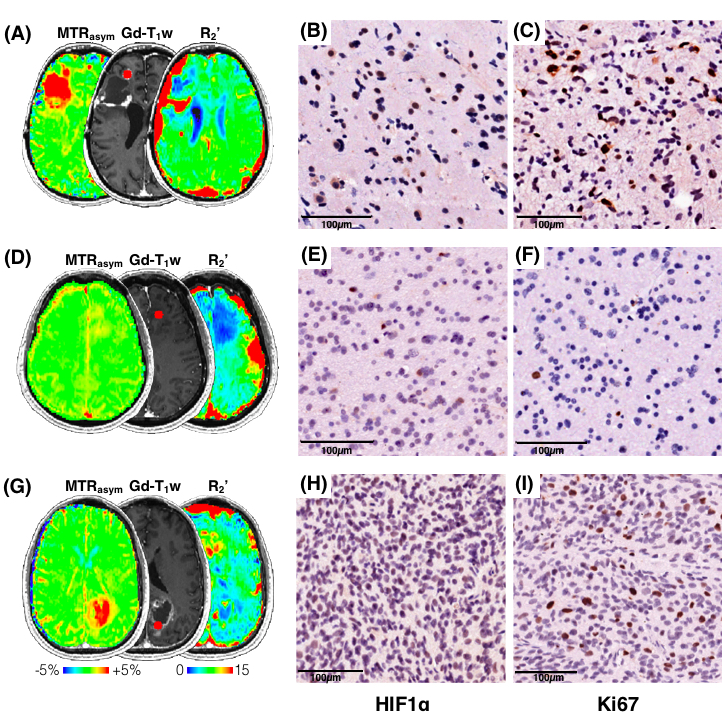
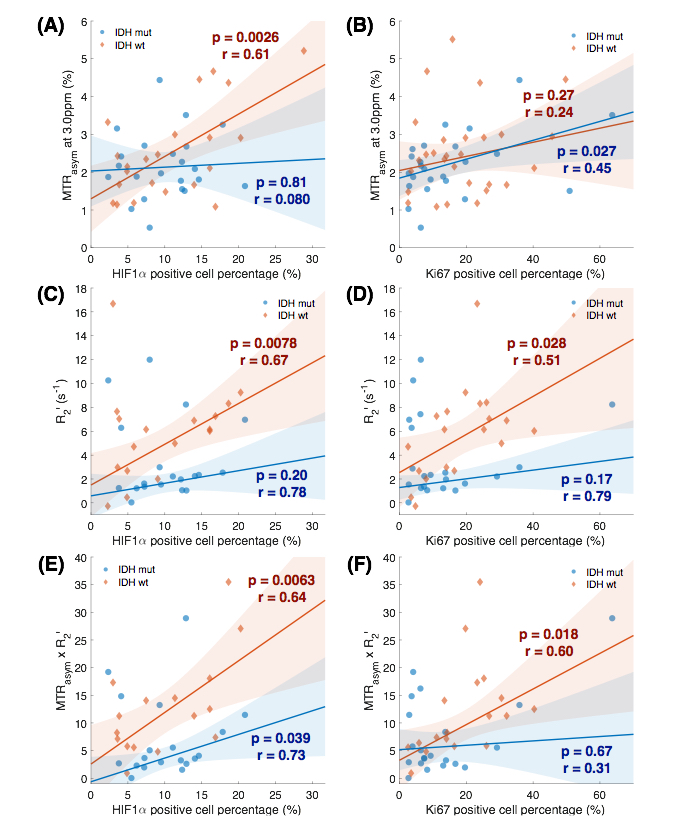
When comparing across grades, all three metrics (MTRasym at 3.0ppm, R2’, and MTRasym x R2’) show significant difference (p=0.0053; p=0.0047; p=0.013), with increasing values in higher grades (Figure 1). MTRasym is found to be significantly higher in IDH1-wildtype gliomas compared to IDH1-mutant ones (p=0.026, Figure 2(A)). We also observed significantly higher R2’ in IDH1-wildtype gliomas (p=0.0011, Figure 2(B)). The same trend is observed in MTRasym x R2’, with higher significance (p=0.0007, Figure (C)). When including only grade II and III gliomas, R2’ and MTRasym x R2’ are still significantly higher in IDH1-wildtype gliomas (p=0.033; p=0.010), but not with MTRasym (p=0.14). ROC analysis was performed to assess the ability of the three pH- and oxygen-sensitive metrics to differentiate IDH1 mutation status. The best differentiation is achieved with MTRasym x R2’ (AUC=0.85, threshold=6.58, prediction accuracy=80.6%). Examples of MRI-guided targeting of tissue samples and corresponding HIF1α and Ki67 stainings are shown in Figure 3. Significant positive correlation is found between MTRasym and HIF1α (p=0.0026, Figure 4(A)), as well as between R2’ and HIF1α (p=0.0078, Figure 4(B)), in IDH1-wildtype gliomas. These correlations no longer exist in IDH1-mutant gliomas (p=0.81; p=0.20). Significant correlation is observed between MTRasym x R2’ and HIF1α, in both IDH1-mutant and wild-type gliomas (p=0.039; p=0.0063), although the latter shows a greater slope. In terms of Ki67, both R2’ and MTRasym x R2’ show significant correlation with Ki67 in IDH1-wildtype gliomas (p=0.028; p=0.018). This correlation is again absent in IDH1-mutant gliomas (p=0.17; p=0.67).DISCUSSION AND CONCLUSION
We have demonstrated that pH- and oxygen-sensitive amine CEST-SAGE-EPI is a clinically feasible, powerful imaging technique for distinguishing between IDH1 mutant and wild-type gliomas. Results suggest the IDH1 mutation is associated with lower MTRasym at 3.0ppm and lower R2’, implying lower acidity and vascular hypoxia. This supports the hypothesis that 2-HG produced by IDH1-mutant activates PHD and the degradation of HIF1α, subsequently preventing a metabolic shift from oxidative phosphorylation to glycolysis (Figure 5). This is further supported by our histological findings of loss of correlation between levels of hypoxia and HIF1α tissue expression in IDH1 mutants.Acknowledgements
No acknowledgement found.References
1. Yan H, Parsons DW, Jin G, McLendon R, Rasheed BA, Yuan W, Kos I, Batinic-Haberle I, Jones S, Riggins GJ, Friedman H. IDH1 and IDH2 mutations in gliomas. New England Journal of Medicine. 2009 Feb 19;360(8):765-73.
2. Jin G, Reitman ZJ, Spasojevic I, Batinic-Haberle I, Yang J, Schmidt-Kittler O, Bigner DD, Yan H. 2-hydroxyglutarate production, but not dominant negative function, is conferred by glioma-derived NADP+-dependent isocitrate dehydrogenase mutations. PloS one. 2011 Feb 4;6(2):e16812.
3. Xu W, Yang H, Liu Y, Yang Y, Wang P, Kim SH, Ito S, Yang C, Wang P, Xiao MT, Liu LX. Oncometabolite 2-hydroxyglutarate is a competitive inhibitor of α-ketoglutarate-dependent dioxygenases. Cancer cell. 2011 Jan 18;19(1):17-30.
4. Koivunen P, Lee S, Duncan CG, Lopez G, Lu G, Ramkissoon S, Losman JA, Joensuu P, Bergmann U, Gross S, Travins J. Transformation by the (R)-enantiomer of 2-hydroxyglutarate linked to EGLN activation. Nature. 2012 Mar;483(7390):484.
5. Masoud GN, Li W. HIF-1α pathway: role, regulation and intervention for cancer therapy. Acta Pharmaceutica Sinica B. 2015 Sep 1;5(5):378-89.
6. Li Z, Bao S, Wu Q, Wang H, Eyler C, Sathornsumetee S, Shi Q, Cao Y, Lathia J, McLendon RE, Hjelmeland AB. Hypoxia-inducible factors regulate tumorigenic capacity of glioma stem cells. Cancer cell. 2009 Jun 2;15(6):501-13.
7. Harris RJ, Yao J, Chakhoyan A, Raymond C, Leu K, Liau LM, Nghiemphu PL, Lai A, Salamon N, Pope WB, Cloughesy TF. Simultaneous p H‐sensitive and oxygen‐sensitive MRI of human gliomas at 3 T using multi‐echo amine proton chemical exchange saturation transfer spin‐and‐gradient echo echo‐planar imaging (CEST‐SAGE‐EPI). Magnetic resonance in medicine. 2018 Apr 6.
8. Harris RJ, Cloughesy TF, Liau LM, Prins RM, Antonios JP, Li D, Yong WH, Pope WB, Lai A, Nghiemphu PL, Ellingson BM. pH-weighted molecular imaging of gliomas using amine chemical exchange saturation transfer MRI. Neuro-oncology. 2015 Jun 24;17(11):1514-24.
Figures