0392
Investigating the Influence of DSC-MRI Acquisition Methods on the Clinical Application of Percentage Signal Recovery in Brain Tumors1Division of Neuroimaging Research, Barrow Neurological Institute, Phoenix, AZ, United States, 2Alpert Medical School Brown University, Providence, RI, United States, 3Department of Diagnostic Imaging, Rhode Island Hospital, Providence, RI, United States
Synopsis
Percentage signal recovery (PSR) derived from DSC-MRI has been shown to exhibit unique properties between enhancing malignant lesions, due to T1 and T2* contrast agent leakage effects.
Introduction
DSC-MRI-derived percentage signal recovery (PSR) has the potential to differentiate between enhancing brain tumors [1,2]. PSR values depend on both acquisition methods and pathophysiologic factors that contribute to T1 and T2* contrast agent leakage effects. In this work, a validated DSC-MRI digital reference object (DRO) is used to identify optimal acquisition methods that enable the use of PSR to differentiate GBM, metastases, and lymphoma.Methods
A validated computational strategy termed the finite perturber finite difference method is used to drive the DRO, which computes MRI signals for 3D tissue structures [5,6]. Simulation input parameters were distinctly chosen to represent the three tumor types (based on imaging and histopathologic data). In order to ensure that the DRO’s simulated signals accurately represent the magnitude and distribution of contrast agent (CA)-induced T1 and T2* changes observed across each tumor type, we used voxel-wise patient data to train the DRO to identify the relevant structural features. The training dataset included pathology-proven patient data from 14 GBMs (21,706 voxels), 7 lymphomas (5,207 voxels), and 20 metastases (17,077 voxels). All training data sets were acquired using TE=40ms, TR=1.29s, flip-angle=60o, with a dosing scheme of quarter-dose preload followed by full-dose injection of Gd-BT-DO3A at 1.5T. For each tumor type, the DRO’s input tissue structure (e.g. cell size, shape) and physical parameters (e.g. pre-contrast T1) were systematically permutated until the distribution of PSR values and their mean and standard deviation across all the simulated signals closely matched those in the training dataset. This process yielded a DRO that consists of 3,000 unique voxels for each tumor type. A separate dataset consisting of DSC-MRI data in GBM (n = 7) and metastases (n = 6) patients was used to validate the DRO’s ability to recapitulate the range of PSR values for data acquired using different pulse sequence parameters and CA dosing schemes.Results and Discussion
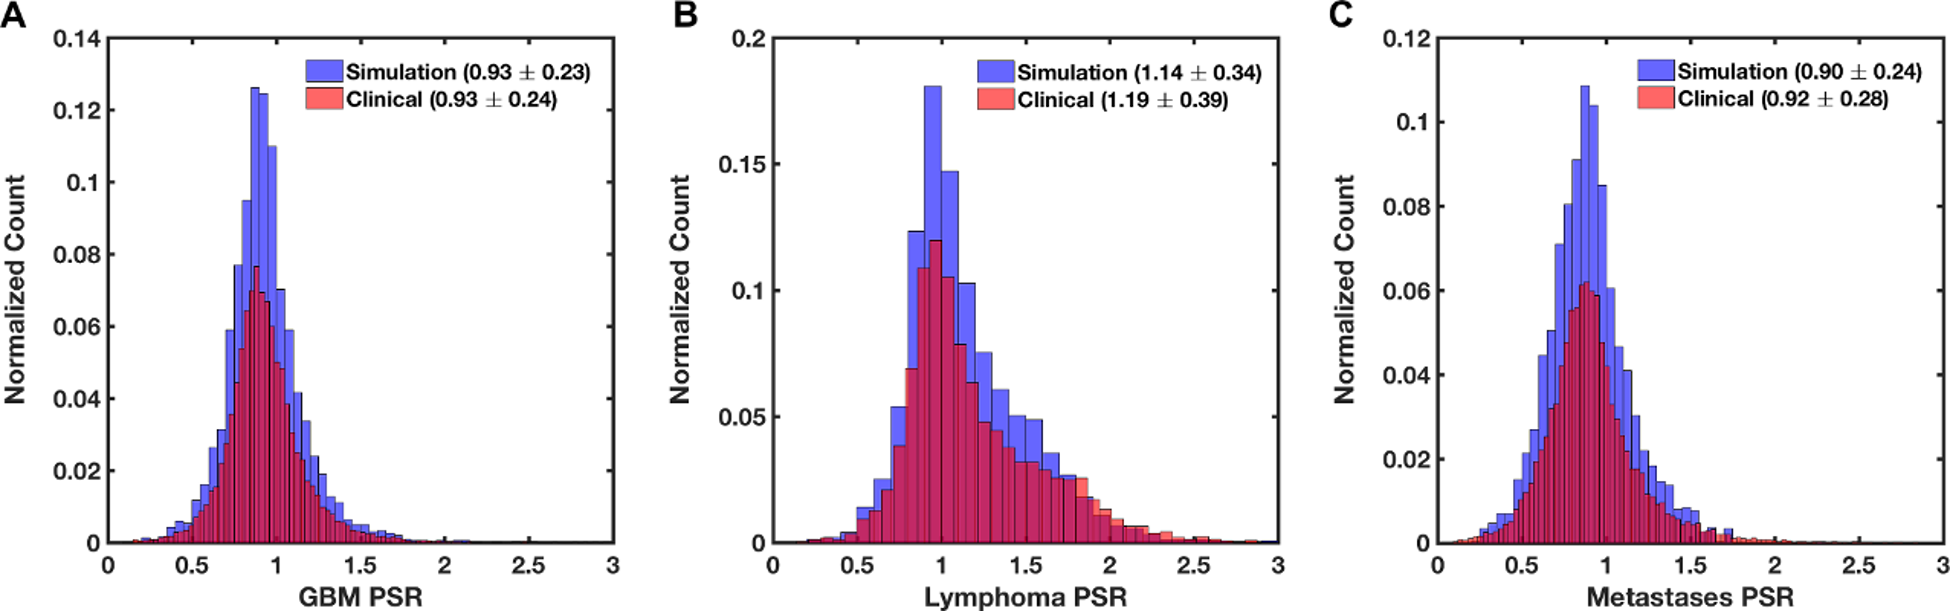
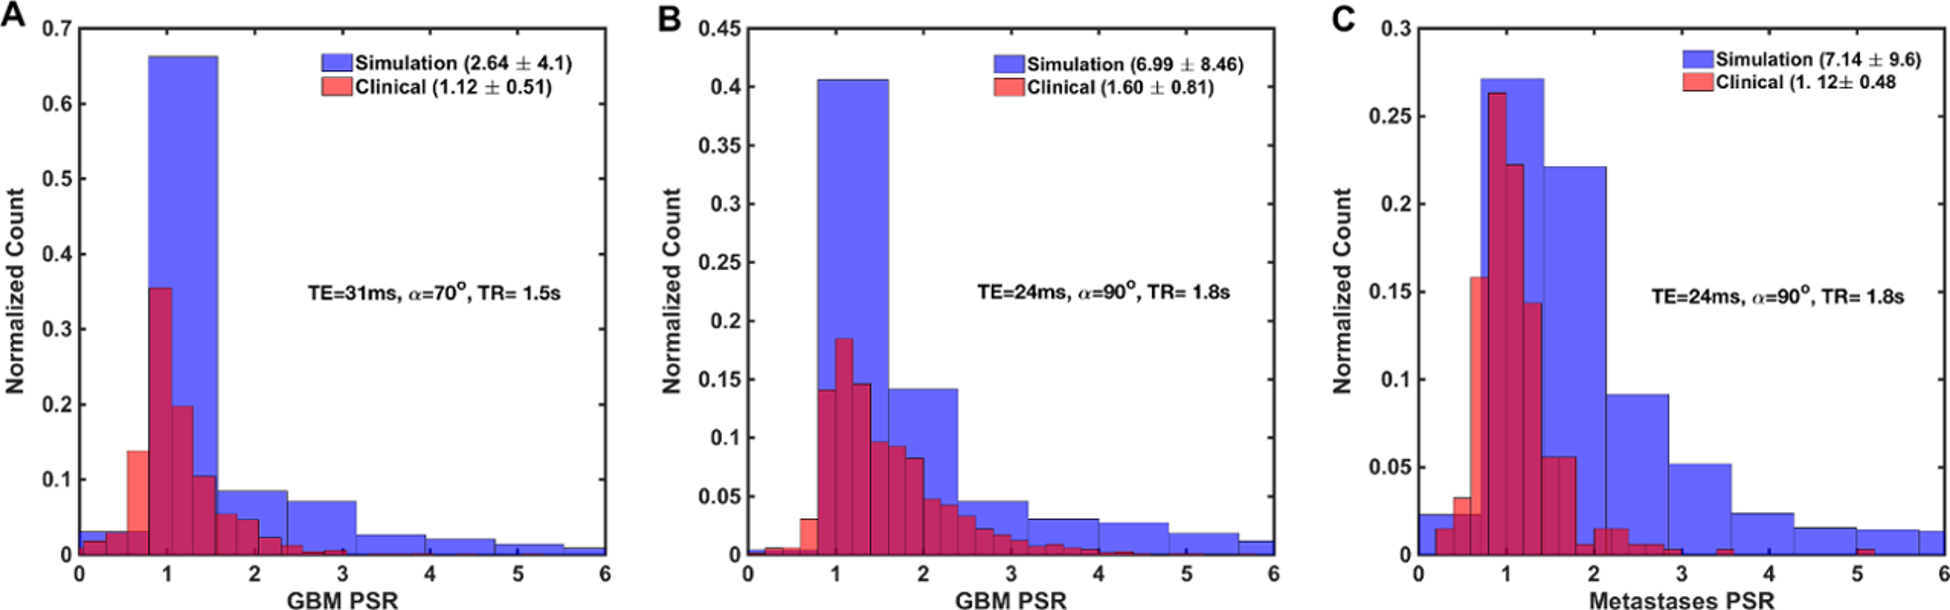
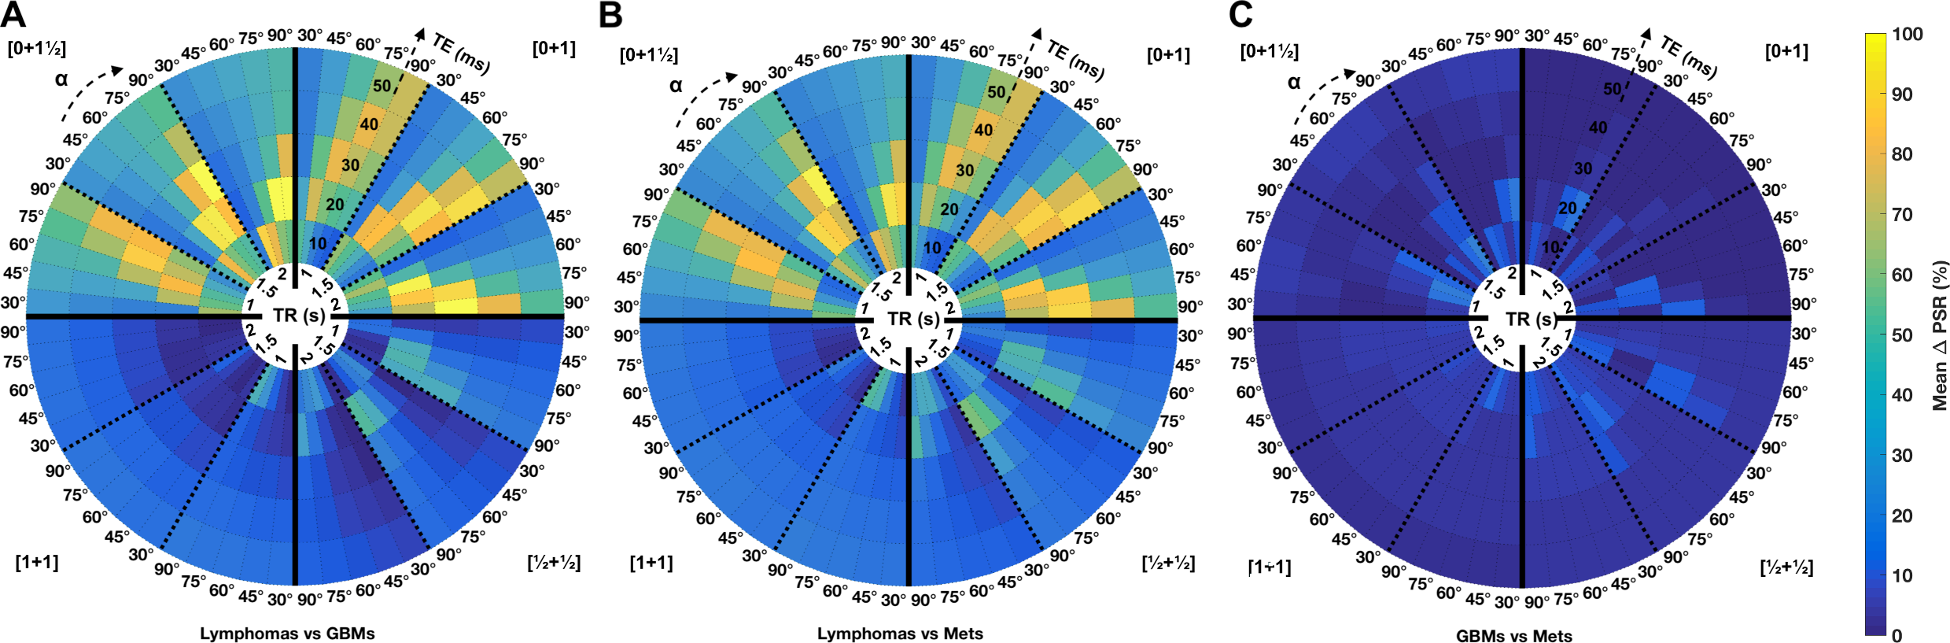
Figure 1A-C shows the agreement between the in vivo and simulated mean and standard deviation of PSR for each tumor type in the training dataset. Figure 2A-C compares simulated and in vivo PSR distribution for the validation dataset. The DRO captured the full range of PSR values for GBM data acquired using TE=31ms, TR=1.5s and flip angle=70o and GBM and metastases data acquired using TE=24ms, TR=1.8s, and flip angle=90o. The results indicate that the trained DRO can accurately model the full range of CA-induced T1 and T2* effects for different sets of pulse sequence parameters and CA dosing schemes. Figure 3A-C shows paired heat maps of mean PSR percentage difference between the three tumor types for 5 flip-angles, 5 TEs, 3 TRs, and 4 CA dosing schemes at B0=3T. As expected, these results show that effective differentiation of lymphomas from metastases and GBM can be achieved using appropriate T1-and T2*-weighted DSC-MRI parameters. Specifically, no-preload dosing schemes ([0+1½] and [0+1]) combined with intermediate TEs (20-40 ms) and intermediate to high flip-angles (60o-90o) maximizes the PSR difference between lymphoma versus GBM and metastases by providing adequate T1 weighting for lymphomas (which exhibit high PSR values owing to CA-induced T1 leakage effects) while maintaining at least some T2* weighting in order to detect the CA-induced T2* leakage effects introduced by GBM and metastases, due to their larger cell sizes. DSC-MRI data acquired with preload dosing schemes (e.g. [1+1] and [½+½]) markedly reduce the PSR differences between the three tumor types, primarily because T1 leakage effects are minimized. The PSR differences between GBM and metastasis were substantially smaller than that found for lymphomas, likely reflecting tumor cell sizes in the vicinity of the static dephasing regime, yielding similar T2* leakage effects. Across all methods, the use of lower TEs and higher flip-angles with no-preload or with small preload dosing provided the largest differences between GBM and metastasis PSR values.Conclusion
These results further demonstrate that pulse sequence parameters and contrast agent dosing schemes impact the use of PSR as a biomarker and highlight DSC-MRI methods that optimize clinical utility. Of particular note, the acquisition methods required to maximize PSR utility provide poor CBV accuracy (and vice versa), indicating that if PSR information is desired it should be acquired during preload injection for DSC-MRI, while data for CBV mapping should be acquired during subsequent bolus injection. Alternatively, the use of dual- or multi-echo DSC-MRI data would enable simultaneous acquisition of datasets for optimal PSR and CBV estimation. We are currently expanding this investigation to include DSC-MRI methods at 1.5T and with additional dosing schemes.Acknowledgements
NCI R01 CA158079References
[1] Mangla R, Kolar B, Zhu T, Zhong J, Almast J, Ekholm S. Percentage signal recovery derived from MR dynamic susceptibility contrast imaging is useful to differentiate common enhancing malignant lesions of the brain. AJNR Am J Neuroradiol 2011;32:1004–10. doi:10.3174/ajnr.A2441.
[2] Liu X, Kolar B, Tian W, Germin BI, Huang Y, Hu R, et al. MR perfusion-weighted imaging may help in differentiating between nonenhancing gliomas and nonneoplastic lesions in the cervicomedullary junction. J Magn Reson Imaging 2011. doi:10.1002/jmri.22594.
[3] Boxerman JL, Paulson ES, Prah MA, Schmainda KM. The effect of pulse sequence parameters and contrast agent dose on percentage signal recovery in DSC-MRI: implications for clinical applications. AJNR Am J Neuroradiol 2013;34:1364–9. doi:10.3174/ajnr.A3477.
[4] Laura C. Bell, Leland S. Hu, Ashley M. Stokes, Samuel C. McGee, Leslie C. Baxter and Quarles CC. Characterizing the Influence of Preload Dosing on Percent Signal Recovery (PSR) and Cerebral Blood Volume (CBV) Measurements in a Patient Population With High-Grade Glioma Using Dynamic Susceptibility Contrast MRI. Tomography 2017;3:89–95. doi:10.18383/j.tom.2017.00004.
[5] Semmineh NB, Stokes AM, Bell LC, Boxerman JL, Quarles CC. A population based digital reference object (DRO) for optimizing dynamic susceptibility contrast (DSC) MRI methods for clinical trials. Tomography n.d.
[6] Semmineh NB, Xu J, Boxerman JL, Delaney GW, Cleary PW, Gore JC, et al. An efficient computational approach to characterize DSC-MRI signals arising from three-dimensional heterogeneous tissue structures. PLoS One 2014;9. doi:10.1371/journal.pone.0084764.
Figures