0391
MRI-based Oxygen Extraction Fraction and Cerebral Metabolic Rate of Oxygen Mapping in High-Grade Glioma Using a Combined Quantitative Susceptibility Mapping and Quantitative Blood Oxygenation Level-Dependent Approach1Computer Assisted Clincial Medicine, Medical Faculty Mannheim, Heidelberg University, Mannheim, Germany, 2Department of Biomedical Engineering, Cornell University, Ithaca, NY, United States, 3Department of Radiology, Weill Cornell Medical College, New York, NY, United States, 4Department of Radiology, Tongji Hospital, Wuhan, China
Synopsis
MRI-based oxygenation mapping would be beneficial for treatment planning of high-grade gliomas. We used dynamic contrast-enhanced imaging and a combined quantitative susceptibility mapping and blood oxygenation level-dependent approach to quantify the oxygen extraction fraction (OEF) and cerebral metabolic rate of oxygen (CMRO2) in 6 patients with glioblastoma multiforme and 2 with anaplastic astrocytoma. Robust reconstruction of physiologically meaningful uniform OEF maps in healthy tissue was achieved and OEF was significantly lower in the tumor compared to the contralateral side. Blood flow was significantly higher in the tumor only for glioblastoma multiforme. CMRO2 showed no significant differences.
Introduction
Hypoxia is known to be a major contributor to the therapy resistance and poor treatment outcome for high-grade malignant primary brain tumors.1,2 Yet, a robust and widely accessible method for imaging tissue oxygenation is still not established in the clinic. Cho et al.3 proposed a promising MRI-based approach to map the oxygen extraction fraction (OEF) and cerebral metabolic rate of oxygen (CMRO2) by combining quantitative susceptibility mapping (QSM) and blood oxygenation level-dependent (qBOLD) methods. In this study, we applied this QSM+qBOLD approach to 8 high-grade glioma patients for the first time to robustly map oxygenation and perfusion parameters.Methods
The MRI data of 6 and 2 patients diagnosed with glioblastoma multiforme and anaplastic astrocytoma respectively prior to treatment was analyzed retrospectively. The study was approved by the local institutional review board. Magnetic susceptibilities were calculated from multi-gradient echo (GRE) scans using the MEDI toolbox from Cornell University4-6 with automated referencing to the ventricles.7 Cerebral blood flow (CBF) and volume (CBV) maps were reconstructed from dynamic contrast-enhanced (DCE) data using the ROCKETSHIP framework8 to fit for the two-compartment exchange model9 with the arterial input function placed inside the superior sagittal sinus.10 T1-weighted images with contrast agent were used as morphological reference. All data sets were registered to GRE using SPM12. The combined QSM+qBOLD approach3 was employed to calculate OEF, deoxygenated blood volume ν, R2 and non-blood magnetic susceptibility χnb. Starting values for OEF were estimated from the straight sinus and νstart$$$\,$$$=$$$\,$$$0.77·CBV,11 R2,start$$$\,$$$=$$$\,$$$20$$$\,$$$Hz, χnb,start$$$\,$$$=$$$\,$$$0$$$\,$$$ppm. Instead of directly fitting the QSM+qBOLD model, voxel with similar magnitude decay were collected into groups by the X-means algorithm12 and only one set of parameters was fitted to each group. This intermediate map then initialized the voxelwise optimization. CMRO2 was calculated from OEF and CBF according to CMRO2$$$\,$$$=$$$\,$$$4·SaO2·[Hb]·OEF·CBF with arterial oxygen saturation SaO2$$$\,$$$=$$$\,$$$0.98 and hemoglobin molar concentration [Hb]$$$\,$$$=$$$\,$$$1.88$$$\,$$$μmol/mL for a hematocrit13 Hct$$$\,$$$=$$$\,$$$0.357. The tumor region-of-interest (ROI) was manually segmented and representative ROIs in the contrast-enhanced tumor (CET), edema (Ede) and normal appearing gray (nGM) and white matter (nWM) were drawn. Mean values of OEF, CBF and CMRO2 within the tumor were compared to the contralateral side using Student’s t-test. OEF vs CBF inside the different ROIs was plotted.Results
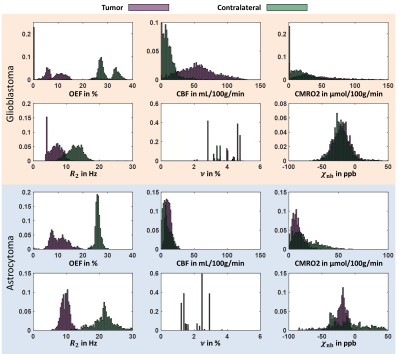
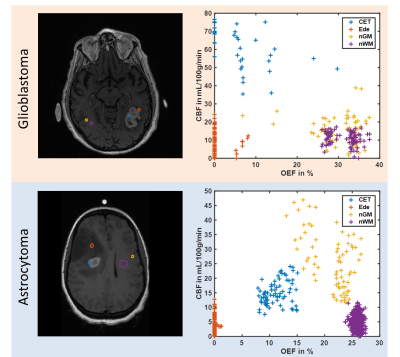
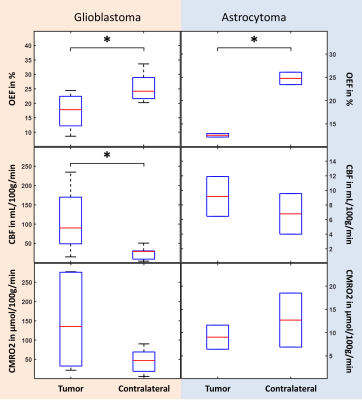
Figure 1 depicts a representative slice of the reconstructed parameters for one glioblastoma and astrocytoma patient together with the corresponding T1-weighted image with contrast agent indicating the tumor and contralateral ROI. The histograms of the parameter distributions inside these two regions and for both patients are illustrated in Fig. 2. Both tumors reveal lower R2 and OEF and higher CBF and ν compared to the contralateral side. Figure 3 illustrates the OEF vs CBF inside the 4 ROIs for one glioblastoma and astrocytoma patient. The ROIs show distinct cluster with normal appearing gray and white matter having higher and the edema having lower OEF. The contrast-enhanced tumor has low to medium OEF with higher perfusion in the glioblastoma than in the astrocytoma. The intersubject means of OEF, CBF and CMRO2 inside the tumor and across all glioblastoma and astrocytoma patients are OEF$$$\,$$$=$$$\,$$$17.2$$$\,$$$±$$$\,$$$6.1$$$\,$$$%, CBF$$$\,$$$=$$$\,$$$108.1$$$\,$$$±$$$\,$$$83.3$$$\,$$$mL\100g\min, CMRO2$$$\,$$$=$$$\,$$$146.4$$$\,$$$±$$$\,$$$123.5$$$\,$$$μmol\100g\min and OEF$$$\,$$$=$$$\,$$$12.5$$$\,$$$±$$$\,$$$0.5$$$\,$$$%, CBF$$$\,$$$=$$$\,$$$9.2$$$\,$$$±$$$\,$$$3.9$$$\,$$$mL\100g\min, CMRO2$$$\,$$$=$$$\,$$$9.0±3.7$$$\,$$$μmol\100g\min respectively. For the contralateral side the values are OEF$$$\,$$$=$$$\,$$$25.5$$$\,$$$±$$$\,$$$5.0$$$\,$$$%, CBF$$$\,$$$=$$$\,$$$25.4$$$\,$$$±$$$\,$$$16.8$$$\,$$$mL\100g\min, CMRO2$$$\,$$$=$$$\,$$$46.4$$$\,$$$±$$$\,$$$31.1$$$\,$$$μmol\100g\min and OEF$$$\,$$$=$$$\,$$$24.8$$$\,$$$±$$$\,$$$1.9$$$\,$$$%, CBF$$$\,$$$=$$$\,$$$6.8$$$\,$$$±$$$\,$$$3.9$$$\,$$$mL\100g\min, CMRO2$$$\,$$$=$$$\,$$$12.7$$$\,$$$±$$$\,$$$8.2$$$\,$$$μmol\100g\min respectively. Significant tumor contrast (P$$$\,$$$<$$$\,$$$0.05) was observed in OEF and CBF for the glioblastoma (Fig. 6) but only in the OEF for the astrocytoma.Discussion
The performance of the combined QSM+qBOLD approach was found to be robust in patients with brain tumors. It not only enables the quantification of physiologically meaningful uniform OEF in healthy brain tissue but also in the greatly heterogeneous environment of high-grade gliomas. This approach is furthermore beneficial to multiparametric techniques14-16 relying on R2* due to the inclusion of χnb, which enables quantification of absolute rather than relative OEF. Our study found significantly reduced OEF in astrocytoma/glioblastoma and significantly increased CBF in glioblastomas confirming a prior multiparametric study.17 Moreover, a distinct clustering of OEF vs CBF for different healthy tissue and tumor ROIs was detected. The visible negative correlation among CET, nGM and nWM strongly resembles the findings from Preibisch et al.15 The very low OEF values in edema could indicate that the tissue is not viable anymore. Further studies including tissue biopsies are necessary to validate the approach presented here.Conclusion
The combined QSM+qBOLD method can robustly map the OEF both in healthy tissue and high-grade gliomas, which in combination with perfusion measurements could be valuable for treatment planning and response assessment.Acknowledgements
No acknowledgement found.References
1. Hockel M, Schlenger K, Mitze M, Schaffer U, Vaupel P. Hypoxia and Radiation Response in Human Tumors. Semin Radiat Oncol 1996;6(1):3-9.
2. Vaupel P, Mayer A. Hypoxia in cancer: significance and impact on clinical outcome. Cancer Metastasis Rev 2007;26(2):225-239.
3. Cho J, Kee Y, Spincemaille P, Nguyen TD, Zhang J, Gupta A, Zhang S, Wang Y. Cerebral Metabolic Rate of Oxygen (CMRO2) Mapping by Combining Quantitative Susceptibility Mapping (QSM) and Quantitative Blood Oxygenation Level-Dependent Imaging (qBOLD). Magn Reson Med 2018. doi: 10.1002/mrm.27135.
4. Liu T, Wisnieff C, Lou M, Chen W, Spincemaille P, Wang Y. Nonlinear formulation of the magnetic field to source relationship for robust quantitative susceptibility mapping. Magn Reson Med 2013;69(2):467-476.
5. Cusack R, Papadakis N. New robust 3-D phase unwrapping algorithms: application to magnetic field mapping and undistorting echoplanar images. Neuroimage 2002;16(3):754-764.
6. Liu T, Khalidov I, de Rochefort L, Spincemaille P, Liu J, Tsiouris AJ, Wang Y. A novel background field removal method for MRI using projection onto dipole fields (PDF). NMR Biomed 2011;24(9):1129-1136.
7. Liu Z, Spincemaille P, Yao Y, Zhang Y, Wang Y. MEDI+0: Morphology enabled dipole inversion with automatic uniform cerebrospinal fluid zero reference for quantitative susceptibility mapping. Magn Reson Med 2018;79(5):2795-2803.
8. Barnes SR, Ng TS, Santa-Maria N, Montagne A, Zlokovic BV, Jacobs RE. ROCKETSHIP: a flexible and modular software tool for the planning, processing and analysis of dynamic MRI studies. BMC Med Imaging 2015;15:19.
9. Zhou J, Wilson DA, Ulatowski JA, Traystman RJ, van Zijl PC. Two-compartment exchange model for perfusion quantification using arterial spin tagging. J Cereb Blood Flow Metab 2001;21(4):440-455.
10. Keil VC, Madler B, Gieseke J, Fimmers R, Hattingen E, Schild HH, Hadizadeh DR. Effects of arterial input function selection on kinetic parameters in brain dynamic contrast-enhanced MRI. Magn Reson Imaging 2017;40:83-90.
11. An H, Lin W. Cerebral venous and arterial blood volumes can be estimated separately in humans using magnetic resonance imaging. Magn Reson Med 2002;48(4):583-588.
12. Pelleg D, Moore AW. X-means: Extending K-means with Efficient Estimation of the Number of Clusters. Proceedings of the Seventeenth International Conference on Machine Learning. doi: Morgan Kaufmann Publishers Inc.; 2000. p 727-734.
13. Sakai F, Nakazawa K, Tazaki Y, Ishii K, Hino H, Igarashi H, Kanda T. Regional Cerebral Blood Volume and Hematocrit Measured in Normal Human Volunteers by Single-Photon Emission Computed Tomography. J Cereb Blood Flow Metab 1985;5:207-213.
14. Tóth V, Förschler A, Hirsch NM, den Hollander J, Kooijman H, Gempt J, Ringel F, Schlegel J, Zimmer C, Preibisch C. MR-based hypoxia measures in human glioma. J Neurooncol 2013;115(2):197-207.
15. Preibisch C, Shi K, Kluge A, et al. Characterizing hypoxia in human glioma: A simultaneous multimodal MRI and PET study. NMR Biomed 2017;30(11):e3775.
16. Wiestler B, Kluge A, Lukas M, et al. Multiparametric MRI-based differentiation of WHO grade II/III glioma and WHO grade IV glioblastoma. Sci Rep 2016;6:35142.
17. Stadlbauer A, Zimmermann M, Kitzwogerer M, Oberndorfer S, Rossler K, Dorfler A, Buchfelder M, Heinz G. MR Imaging-derived Oxygen Metabolism and Neovascularization Characterization for Grading and IDH Gene Mutation Detection of Gliomas. Radiology 2017;283(3):799-809.
Figures


