0390
To discriminate glioblastoma from solitary brain metastasis with inflow-based vascular-space-occupancy (iVASO): comparison with dynamic susceptibility contrast MR imaging1Department of Medical Imaging, Nanfang hospital, Southern Medical University, Guangzhou, China, 2School of Biomedical Engineering, Shanghai Jiao Tong University, Shanghai, China, 3Division of CT & MR, Radiology Department, First Affiliated Hospital of Gannan Medical University, Ganzhou, China, 4Philips Healthcare, Guangzhou, China, 5Kirby Research Center for Functional Brain Imaging, Kennedy Krieger Institute, Department of Radiology, Johns Hopkins University School of Medicine, Baltimore, MD, United States, 6Neurosection, Division of MRI Research, Department of Radiology, Johns Hopkins University School of Medicine, Baltimore, MD, United States, 7Division of Neuroradiology, Russell H. Morgan Department of Radiology and Radiological Science, Johns Hopkins University School of Medicine, Johns Hopkins Hospital, Baltimore, MD, United States, 8Department of Neurosurgery, Johns Hopkins University School of Medicine, Baltimore, MD, United States
Synopsis
Accurate differentiation between GBM and SBM is of vital importance clinically. DSC-MRI cannot differentiate them accurately using measures derived from tumoral regions. Moreover, DSC-MRI requires gadolinium contrast agent administration. Inflow-based vascular-space-occupancy (iVASO) is a novel perfusion technique without the need for exogenous contrast agents. In this study, the capability of iVASO in differentiating GBM and SBM was investigated and compared with that of DSC-MRI. The results showed that iVASO-based measures within tumoral regions could differentiate them accurately. This suggests that iVASO may be used as an alternative for perfusion study on brain tumor.
Purpose
Accurate differentiation between GBM and SBM is of vital importance clinically. Structural MR imaging does not allow for accurate differentiation between glioblastoma (GBM) and single brain metastasis (SBM). Dynamic susceptibility contrast (DSC) MR imaging can differentiate them accurately by measuring relative cerebral blood volume (rCBV) in peritumoral regions instead of within tumoral regions 1. However, the perfusion information within tumor is considered of more importance 2. Also, DSC-MRI requires gadolinium contrast agents. iVASO uses endogenous contrast agent to quantify arteriolar cerebral blood volume (CBVa) 3, 4, of which the capability to accurately predict glioma grading has been demonstrated 5. This study aimed to investigate its potential value in differentiating GBM and SBM.Methods
Fifteen patients with GBM and 19 patients with SBM confirmed by surgery and pathology underwent iVASO and DSC scan with a 3T clinical scanner (Achieva TX, Philips) preoperatively. 3D-iVASO was performed with gradient spin echo readout, TE = 10 ms; TR/TI = 5000/1040, 3100/862, 2500/756, 2000/641, 1700/558, 1300/430 ms; voxel = 2.5 × 2.5 × 6 mm3, 14 slices; parallel imaging acceleration (SENSE) = 2 × 2; crusher gradients of b = 0.3 s/mm2 and Venc = 10 cm/s on z-direction. DSC-MRI was performed with fast field echo echo-planar imaging (FFE-EPI), TR=1700ms, TE=40ms; voxel = 2 × 2 × 6 mm3, 20 slices. Two radiologists drew 4-6 regions of interest (ROI) in tumoral regions or peritumoral T2-weighted hyperintensity regions to obtain maximum CBVa and CBV independently,which were normalized to the contralateral white matter (rCBVa and rCBV). Receiver operating characteristic curve was used to evaluate the diagnostic performance of each perfusion parameter.Results
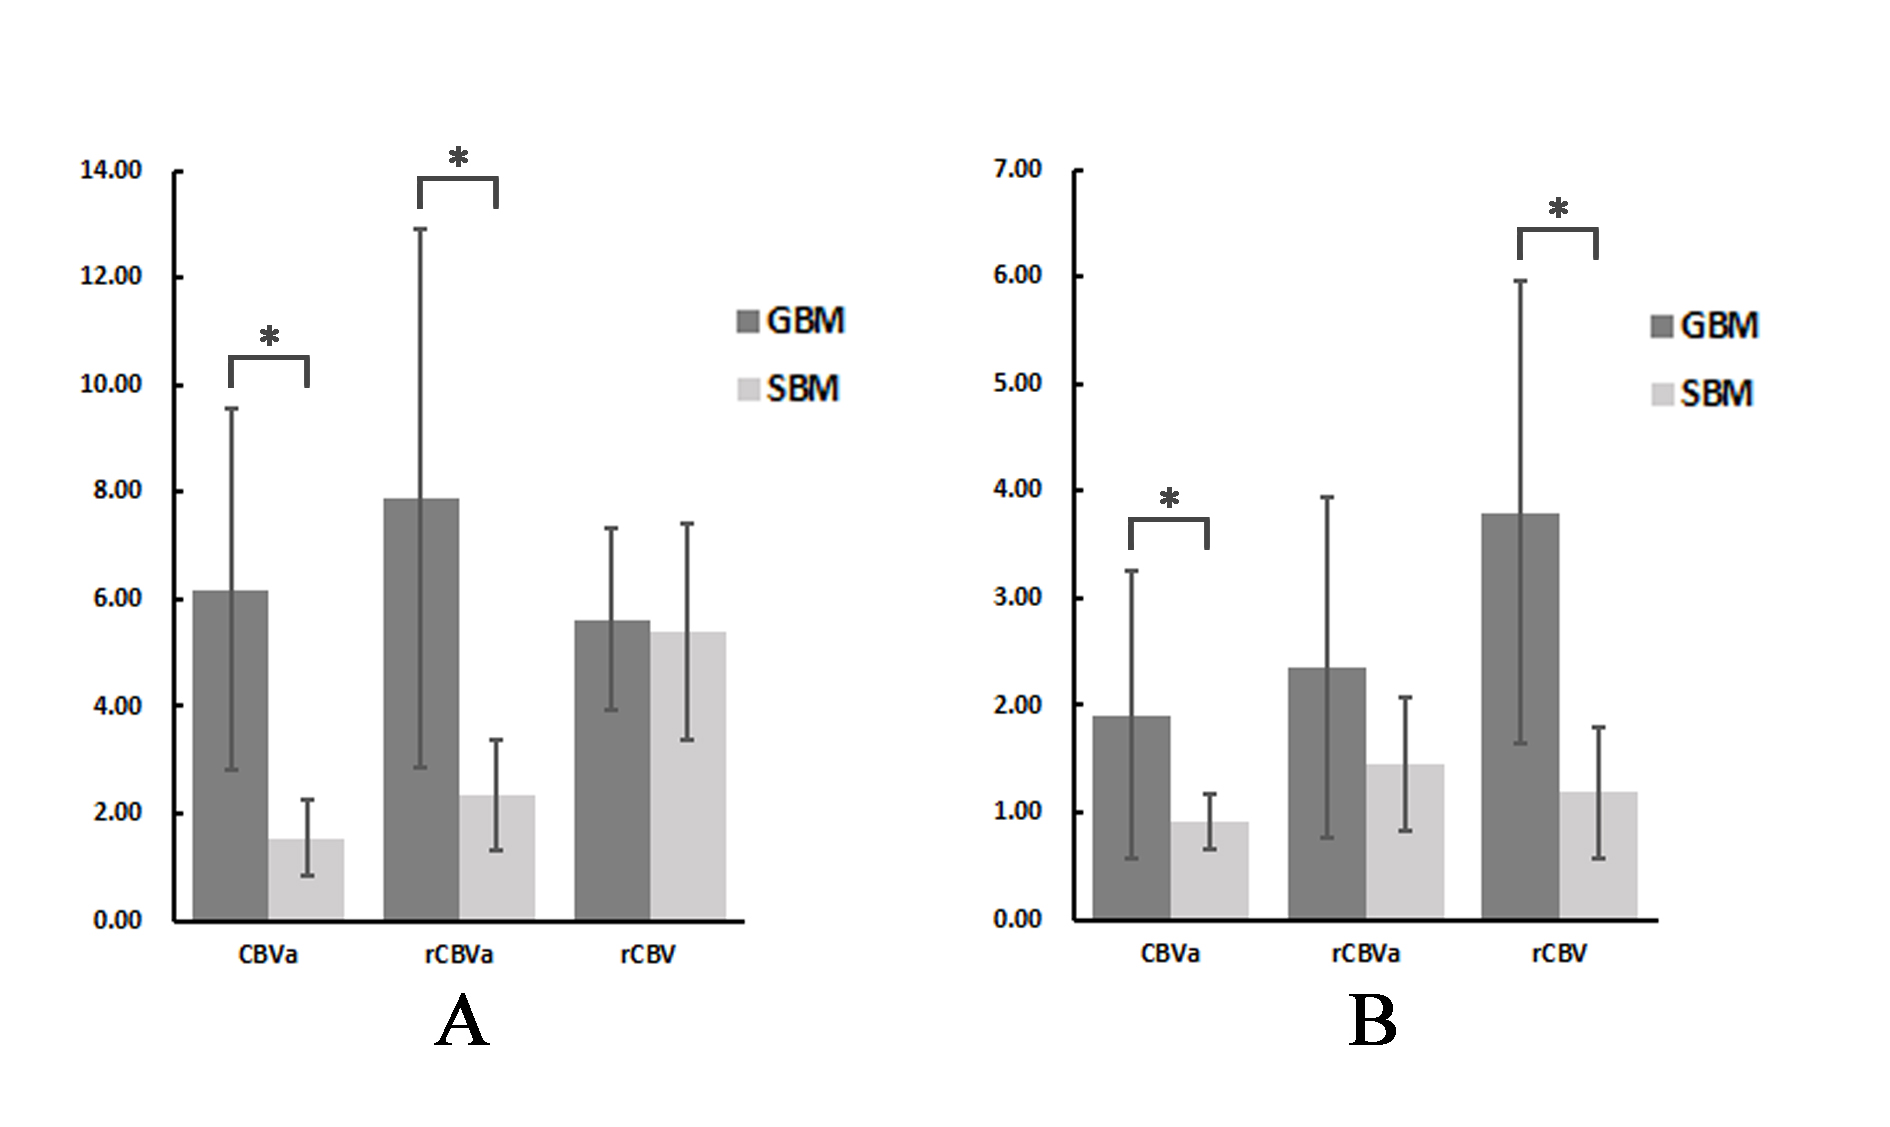
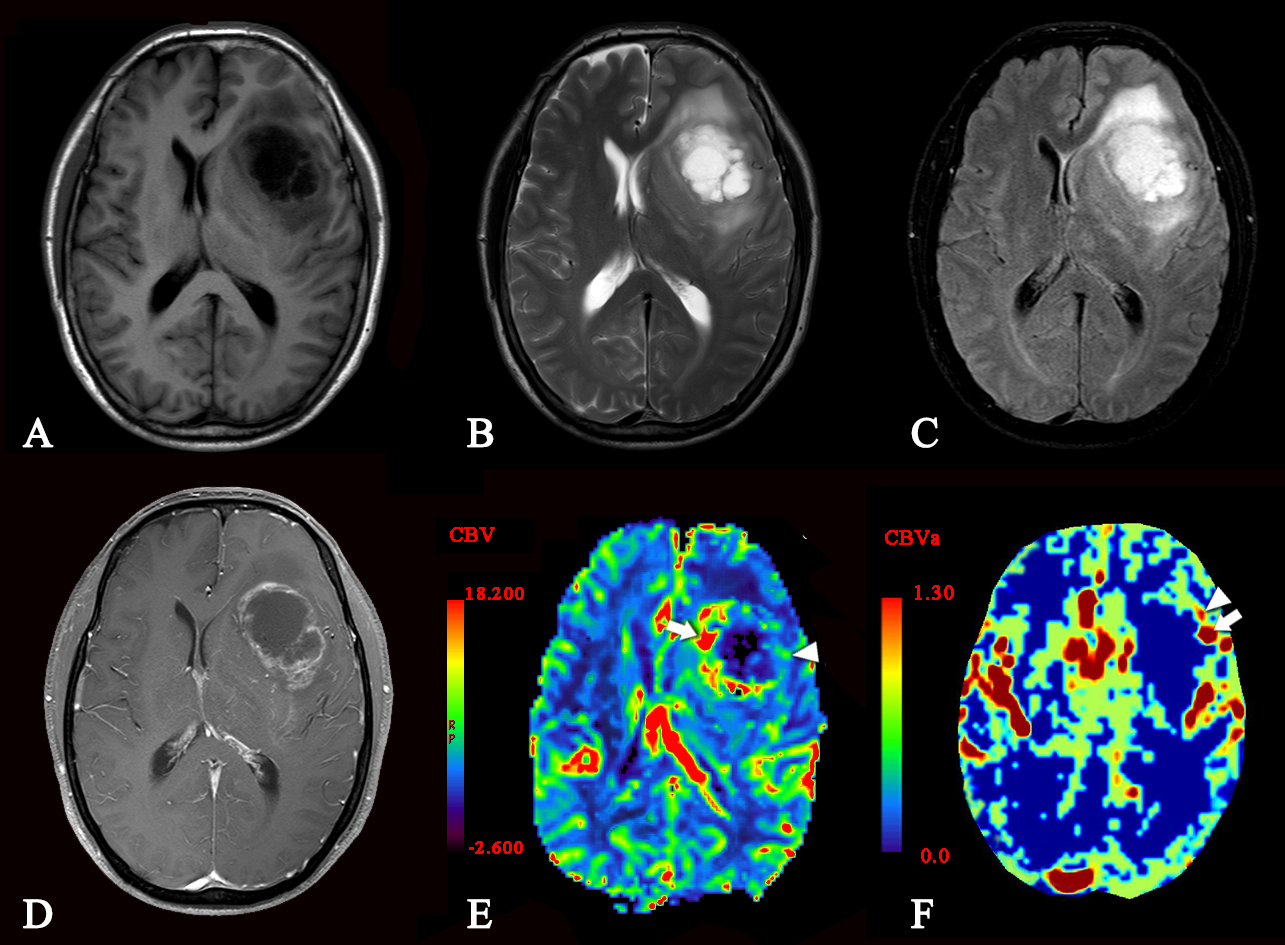
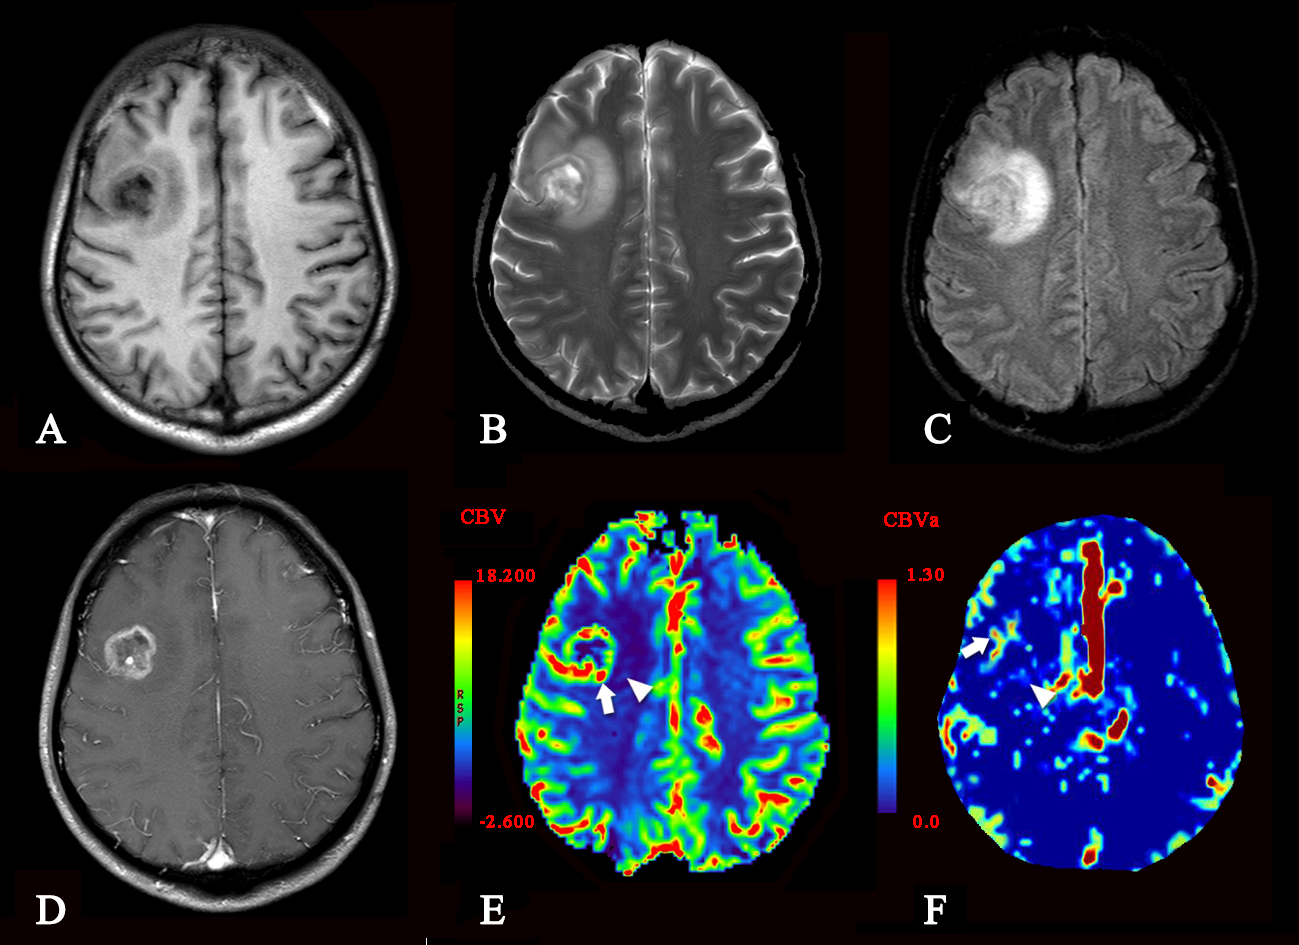
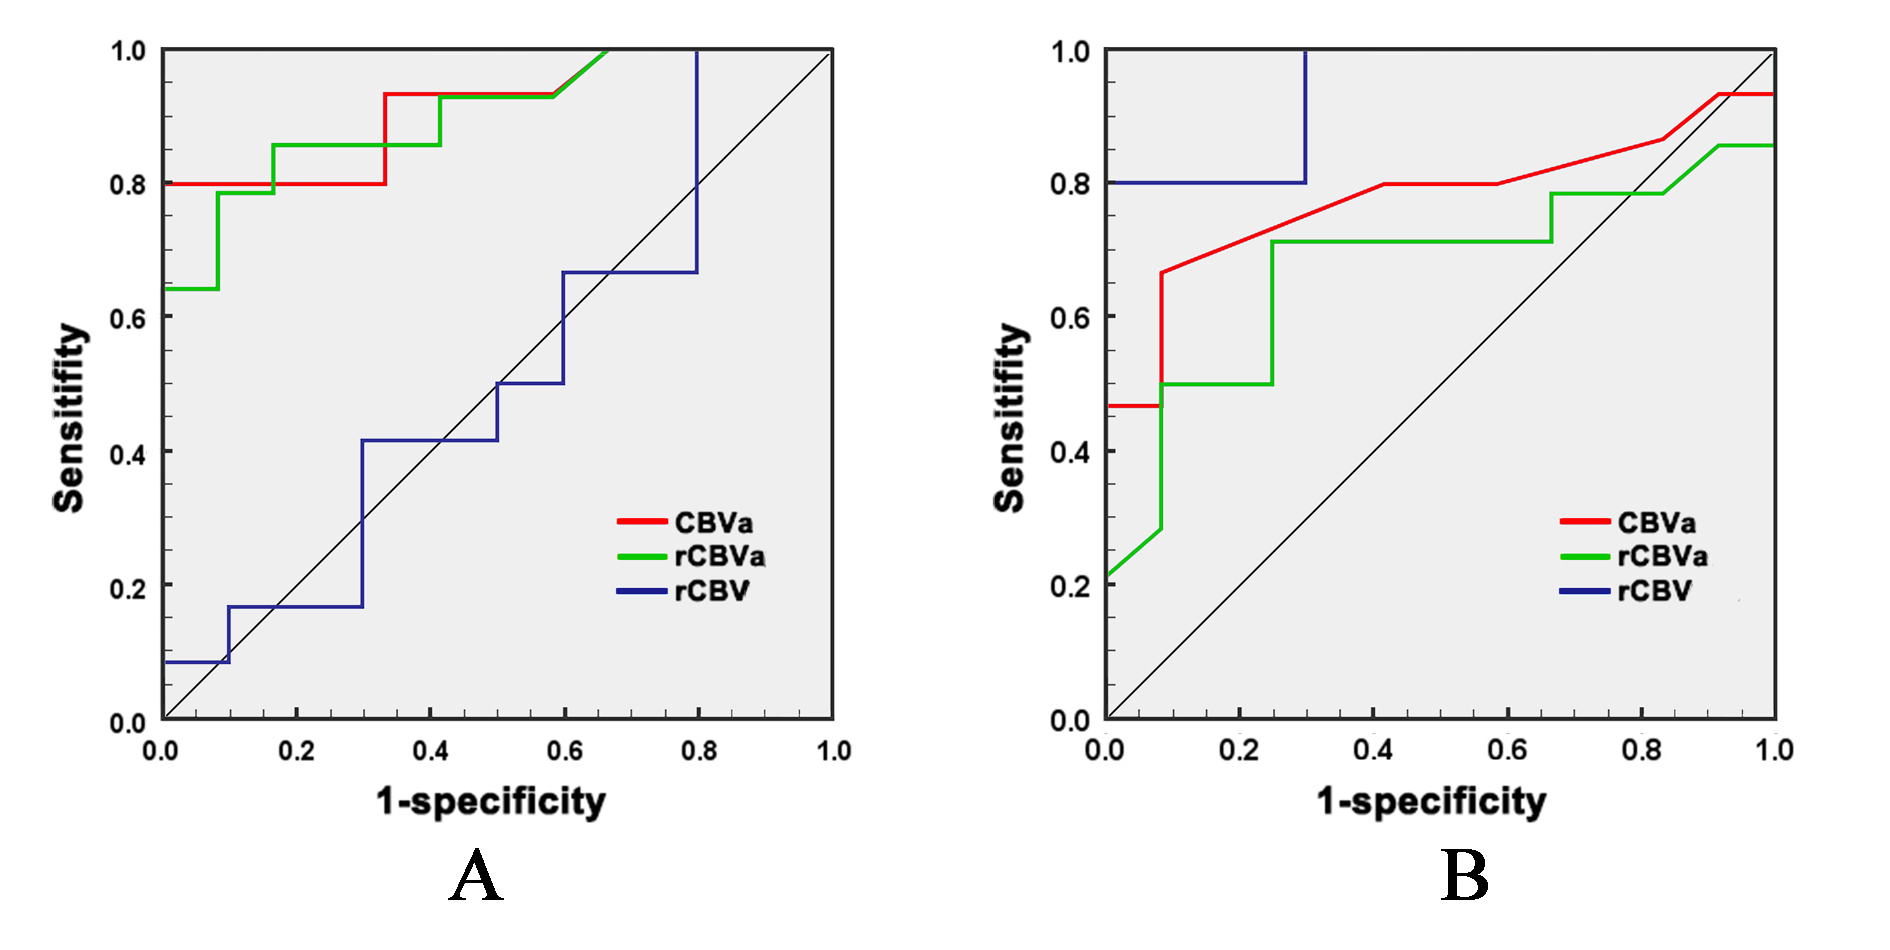
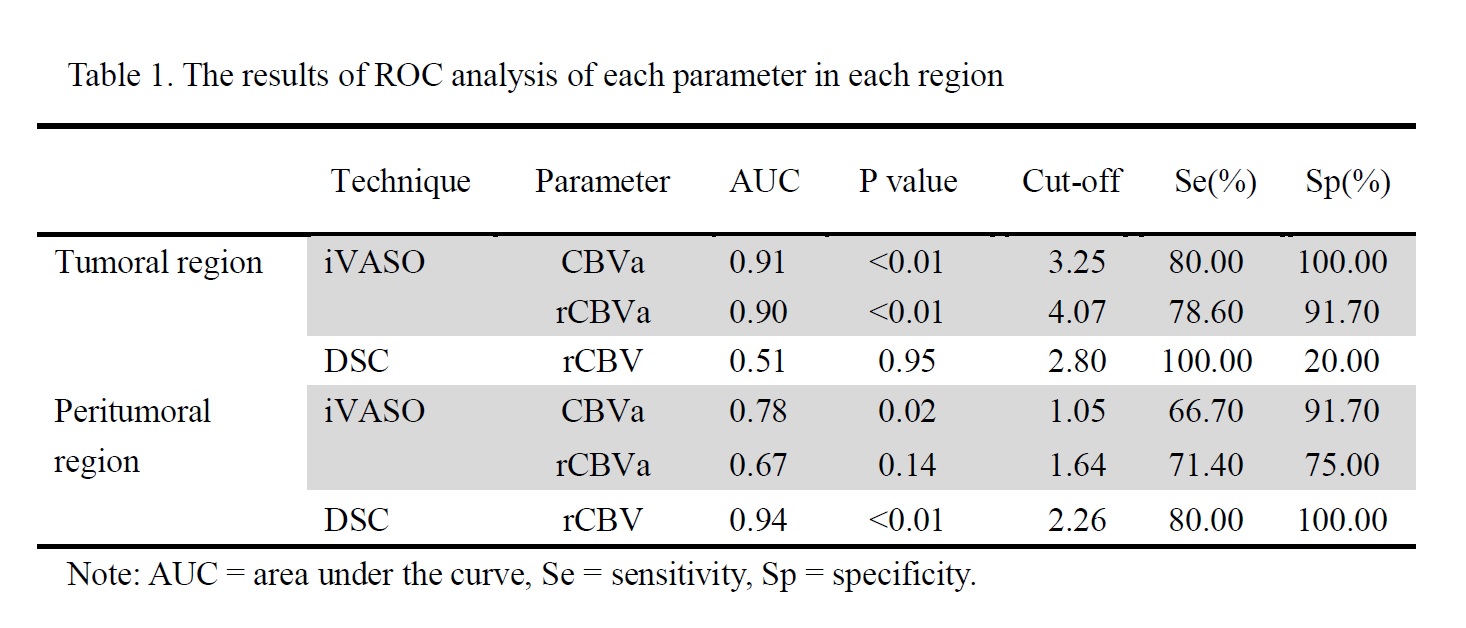
In the tumoral regions, both CBVa and rCBVa (both P < 0.01) differed between two groups, while rCBV did not show significant difference (P = 0.77) (Figures 1, 2 and 3). The area under the curve (AUC) was 0.91 and 0.90 for both CBVa and rCBVa in differentiation between GBM and SBM (Table 1, Figure 4). In the peritumoral T2-weighted hyperintensity regions, both CBVa (P = 0.01) and rCBV (P < 0.01) showed significant difference, while rCBVa did not show significant difference (P = 0. 07). The AUC was 0.94 for rCBV, which was higher than that of CBVa (AUC= 0.78) or rCBVa (AUC= 0.67).Discussion
In this study, iVASO was shown able to discriminate GBM from SBM effectively. In tumoral regions, CBVa and rCBVa had the advantage over rCBV in making the differential diagnosis. This might indicate that arteriolar blood volume measured with iVASO is more helpful than total blood volume measured by DSC in reflecting the perfusion difference between two groups. Arteriolar blood volume was considered the most sensitive indicator for pathophysiological and metabolic changes 6, 7. Of note, rCBV in the peritumoral regions showed better diagnostic performance than CBVa and rCBVa in the present study. This may be because that the measurement of CBVa is based on arterial transit time of gray matter and the sensitivity of iVASO in normal white matter regions diminishes due to a much longer arterial transit time in white matter 8. However, T2-weighted hyperintensity regions are commonly widespread in the setting of glioma and accurate identification of the so-called tumor border is relatively difficult and thus less reproducible 2. Furthermore, most studies demonstrated that perfusion information within tumoral regions is an important imaging marker for tumor biologic characteristics, gene mutation status, treatment response and prognosis prediction 2, 9, 10. Therefore, measurement of perfusion information in the tumors is more desirable clinically. Also, iVASO is a totally noninvasive perfusion technique without the need for gadolinium contrast agents, which will be greatly beneficial when used in daily clinical practice, especially for those elder patients, children population, as well as patients with compromised renal function.Conclusion
iVASO can be used to effectively discriminate GBM and SBM by measuring CBVa and can serve as a new perfusion technique for patients with brain tumors.Acknowledgements
We thank Queenie Chan for the insightful discussions and her help during the preparation of this paper.References
1. Suh CH, Kim HS, Jung SC, et al. Perfusion MRI as a diagnostic biomarker for differentiating glioma from brain metastasis: a systematic review and meta-analysis. European Radiology. 2018; 28(9):3819-3831.
2. Lemee JM, Clavreul A, Menei P. Intratumoral heterogeneity in glioblastoma: don't forget the peritumoral brain zone. Neuro Oncol. 2015; 17(10):1322-1332.
3. Hua J, Qin Q, Donahue MJ, et al. Inflow-based vascular-space-occupancy (iVASO) MRI. Magnetic Resonance in Medicine. 2011; 66(1):40-56.
4. Hua J, Qin Q, Pekar JJ, et al. Measurement of absolute arterial cerebral blood volume in human brain without using a contrast agent. NMR in Biomedicine. 2011; 24(10):1313-1325.
5. Wu Y, Agarwal S, Jones CK, et al. Measurement of arteriolar blood volume in brain tumors using MRI without exogenous contrast agent administration at 7T. J Magn Reson Imaging. 2016; 44(5):1244-1255.
6. Ito H, Kanno I, Iida H, et al. Arterial fraction of cerebral blood volume in humans measured by positron emission tomography. Ann Nucl Med. 2001; 2:111-116.
7. van Zijl PC, Eleff SM, Ulatowski JA, et al. Quantitative assessment of blood flow, blood volume and blood oxygenation effects in functional magnetic resonance imaging. Nat Med. 1998; 2:159-167.
8. van Osch MJ, Teeuwisse WM, van Walderveen MA, et al. Can arterial spin labeling detect white matter perfusion signal? Magn Reson Med. 2009; 62:165-173.
9. Nguyen TB, Cron GO, Bezzina K, et al. Correlation of Tumor Immunohistochemistry with Dynamic Contrast-Enhanced and DSC-MRI Parameters in Patients with Gliomas. AJNR Am J Neuroradiol. 2016; 37(12):2217-2223.
10. Hu L S, Ning S, Eschbacher JM, et al. Radiogenomics to characterize regional genetic heterogeneity in glioblastoma. Neuro Oncol. 2017; 19(1):128-137.
Figures