0381
New insights into the development of white matter microstructure across childhood and adolescence from ultra-strong gradients1Developmental Imaging, Murdoch Children's Research Institute, Parkville, Australia, 2Cardiff University Brain Research Imaging Centre (CUBRIC), School of Psychology, Cardiff University, Cardiff, United Kingdom, 3Department of Paediatrics, University of Melbourne, Parkville, Australia, 4School of Psychology, Australian Catholic University, Melbourne, Australia
Synopsis
Recent advancements in diffusion-weighted imaging analysis techniques, such as fixel-based analysis (FBA), have improved our understanding of fibre-specific patterns of white matter development over childhood. Here, we investigate differential patterns of fibre properties with age and sex, using multiple b-value sampling schemes. The body of the corpus callosum and cingulum undergo significant development over the ages of 8-18, and FBA was robust to these patterns across sampling schemes. However, apparent fibre density (AFD) may be overestimated in clinical sampling schemes for older children, suggesting that higher b-values may improve AFD estimation in emerging complex fibre configurations developing with age.
Introduction
Brain development over childhood and adolescence is characterised by macrostructural and microstructural expansion of the white matter, by virtue of axonal growth and myelination[1]. However, most studies quantify these patterns using voxel-averaged measures obtained using single-shell diffusion magnetic resonance imaging (MRI) data. Recent advances in diffusion MRI analysis techniques allow us to quantify fibre-population specific properties using fixel-based analysis (FBA)[2]. Combining FBA with the very latest in MRI gradient hardware (300 mT/m)[3], we quantify developmental patterns of apparent fibre density and morphology. We also separately assess the impact of different diffusion sampling schemes on developmental patterns, at b-values typically unachievable using clinical scanners.Methods
Image acquisition and pre-processing:
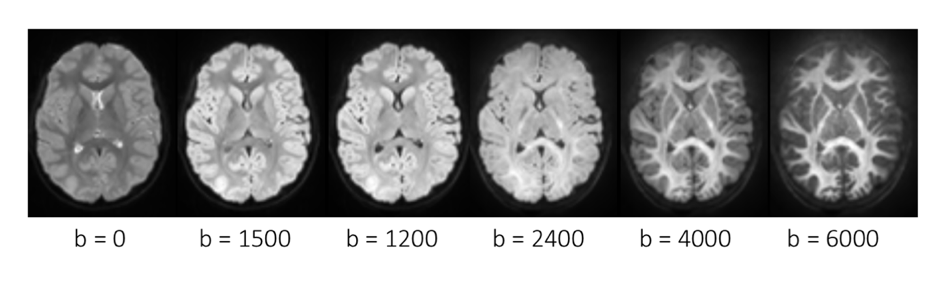
We recruited and scanned 37 typically developing children (23 female) aged 8–18 years on a 3.0T Siemens Connectom system with ultra-strong (300mT/m) gradients. Multi-shell diffusion MRI data were collected(Fig 1): TE/TR=48/2600ms; voxel size=2x2x2mm; b-values= 0(14 vols), 500;1200(30 dirs), and 2400;4000;6000(60 dirs)s/mm2. Data were acquired in an anterior-posterior (AP) phase-encoding direction, with one PA volume. Pre-processing involved: slicewise outlier-detection[4], denoising[5], and correction for drift; motion, eddy, and susceptibility-induced distortions[6]; gradient non-linearities; and Gibbs ringing artefact.
Image processing:
Data were processed in line with a recommended FBA framework in MRtrix (vRC3) for three separate sampling schemes: (1) all b-values; (2) a “clinical” dataset with b-values= 0,500,1200,2400s/mm2; and (3) a reduced sampling scheme with sensitivity to the intra-axonal signal with b-values= 0,500,1200,6000s/mm2. We performed multi-shell multi-tissue constrained spherical deconvolution to generate fibre-orientation distributions (FOD) for each participant, from which we derived a population template, and registered subject-specific FOD maps to this. Subsequently, we estimated apparent fibre density (AFD), and morphological measures of fibre cross-section (FC) and a combined micro/macroscopic estimate of fibre density and cross-section (FDC), for each subject[2].
Statistical analyses:
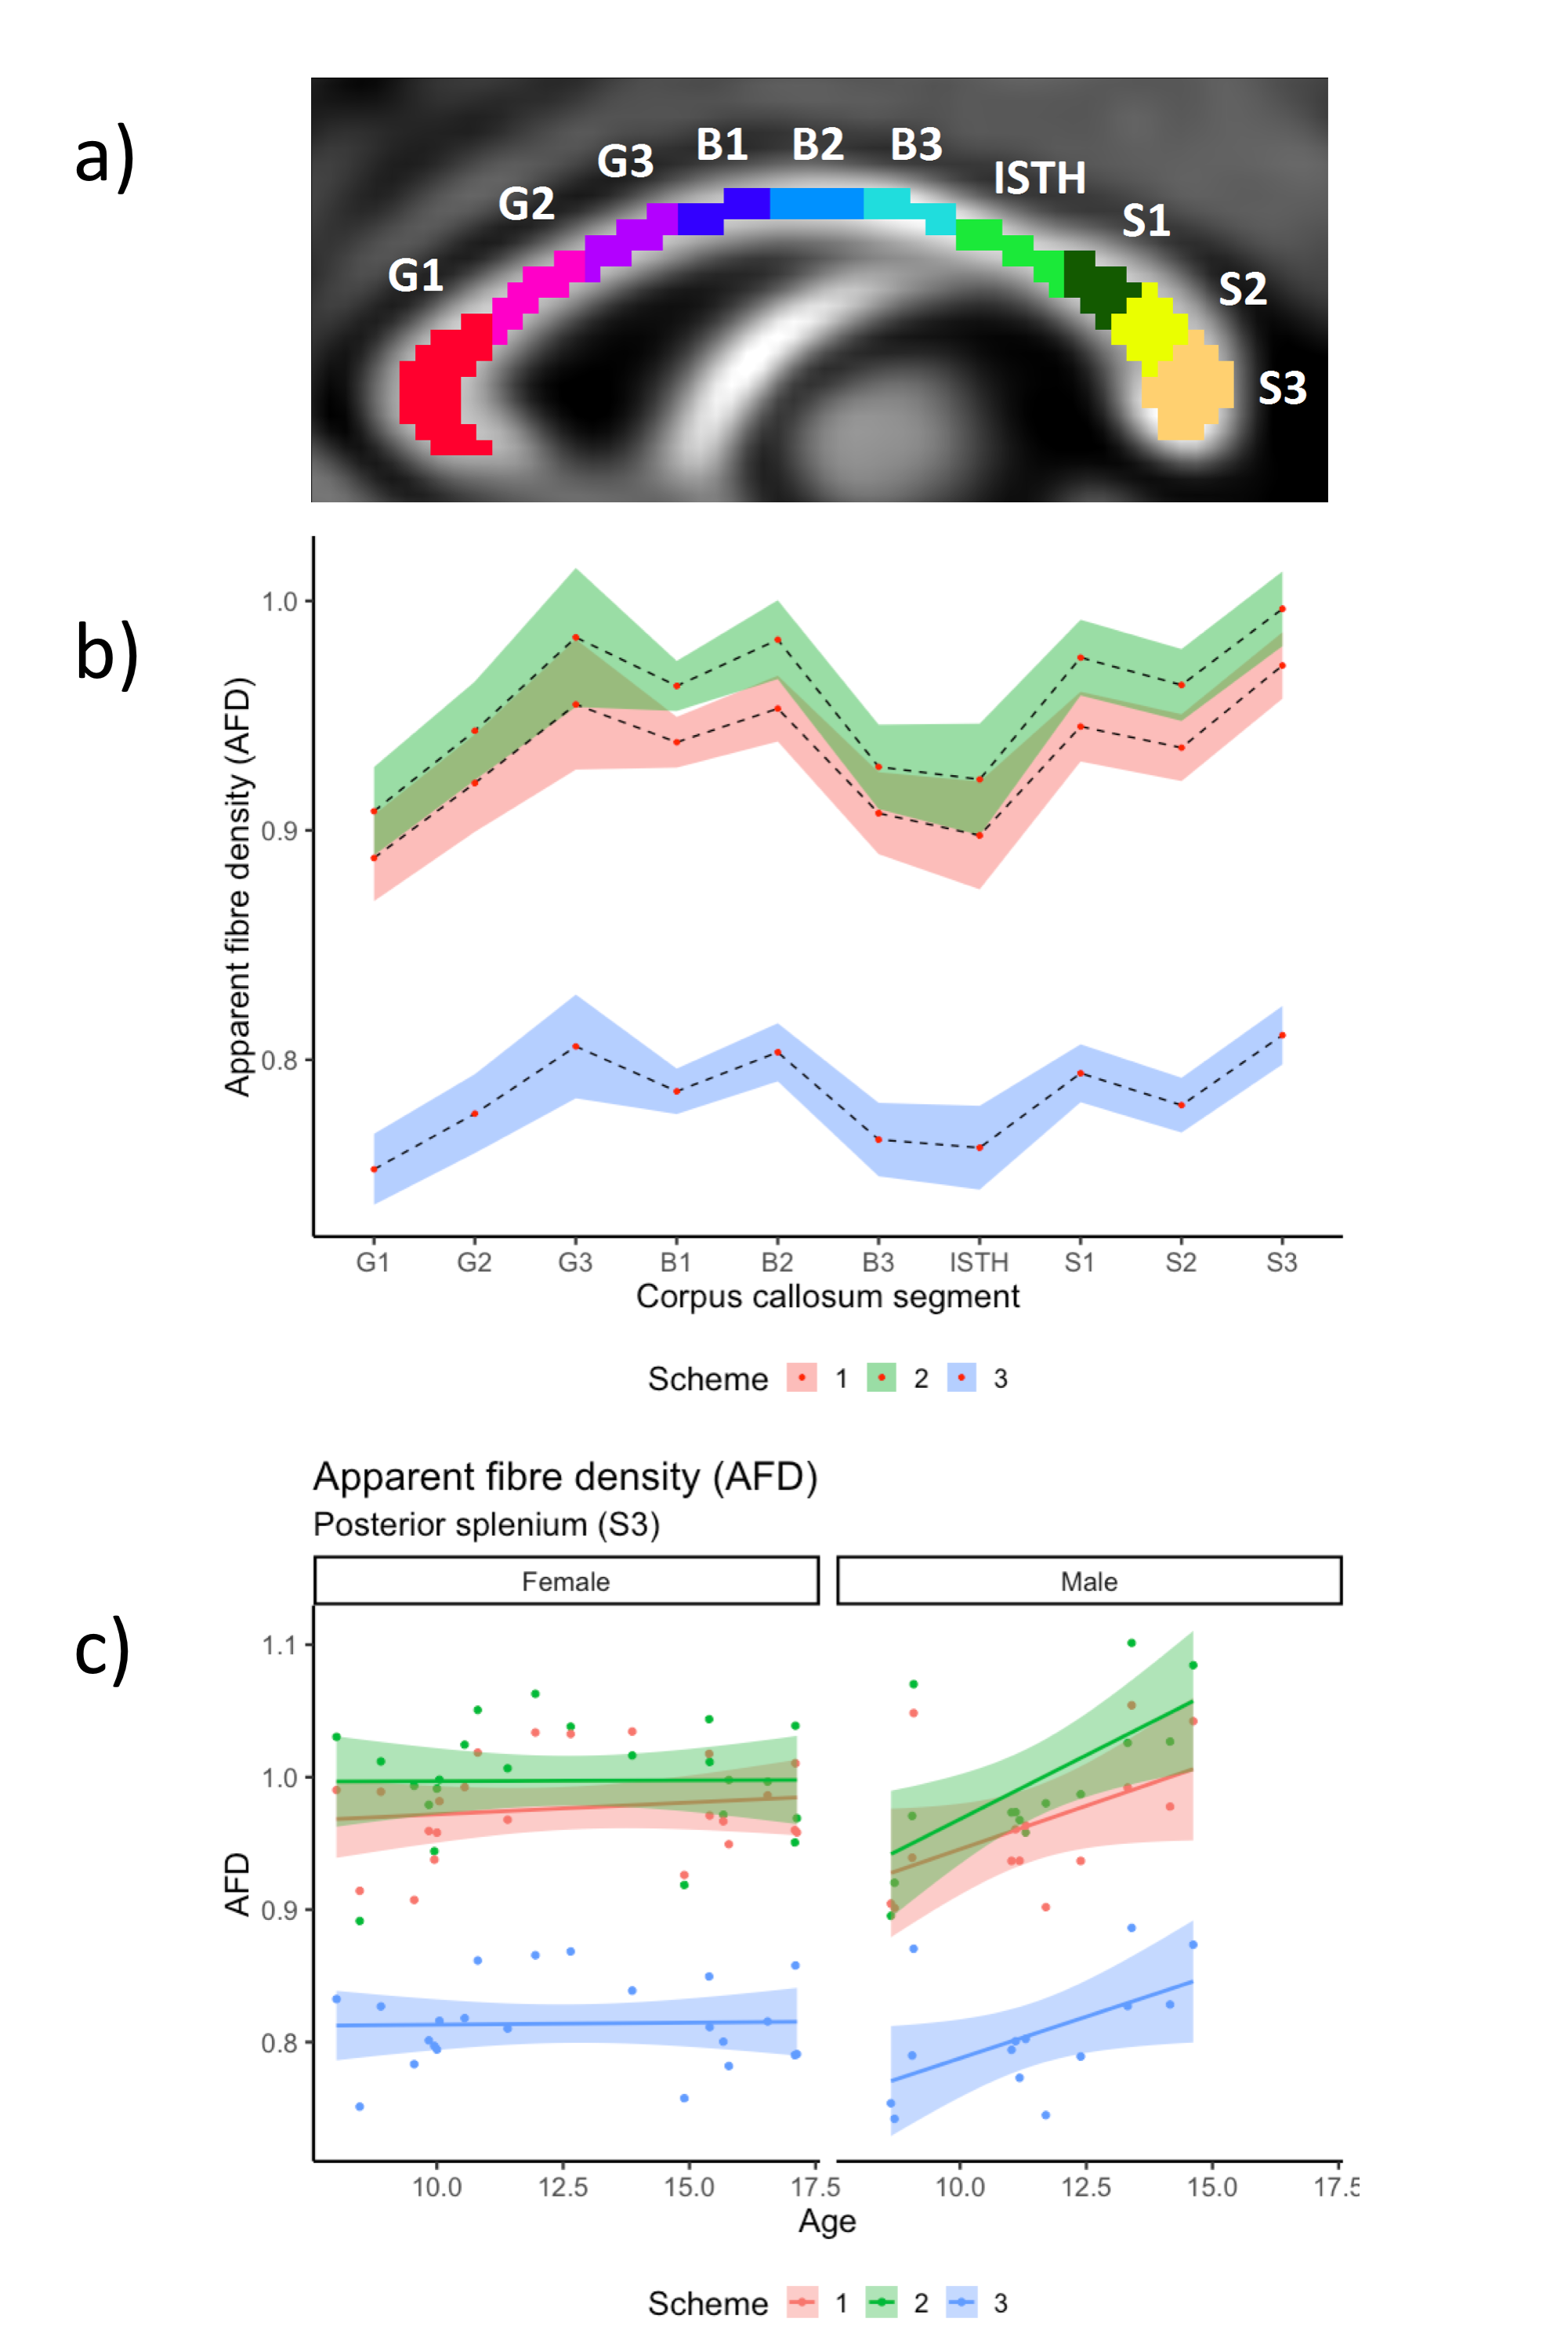
Whole-brain statistical analyses were performed using connectivity-based fixel enhancement[7], to assess age and sex relationships. For confirmatory analysis, we segmented the corpus callosum into 10 regions along the mid-sagittal slice(Fig 3a)[8], and calculated AFD values in each region(Fig 3b). We assessed the interaction between diffusion sampling scheme, age, and sex, with AFD values using linear mixed-effects modelling in R (v3.4.3); and assessed sensitivity to detect these main effects using a Bayesian framework in JASP (v0.8.6). Evidence for a statistically significant effect was indicated by pFDR<.05 and BFIncl>3.
Results
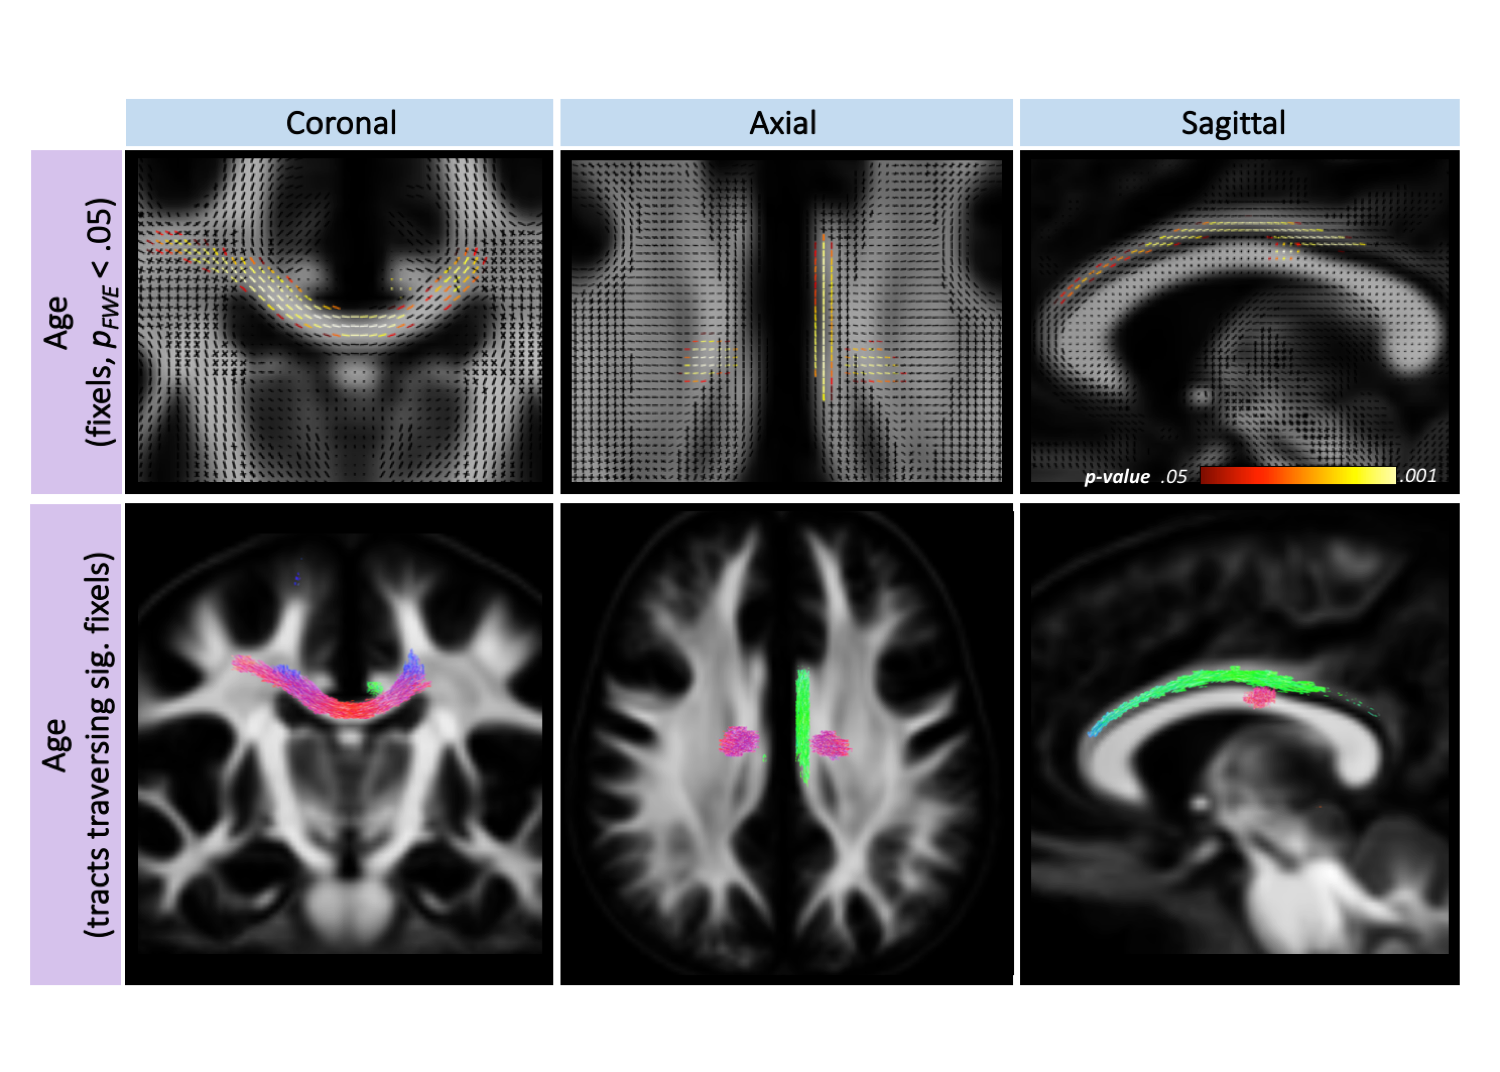
For all three sampling schemes, there was a statistically significant positive relationship between age and AFD, FC, and FDC, in the body of the corpus callosum and left cingulum(Fig 2). There was no significant impact of sex on any of the FBA metrics.
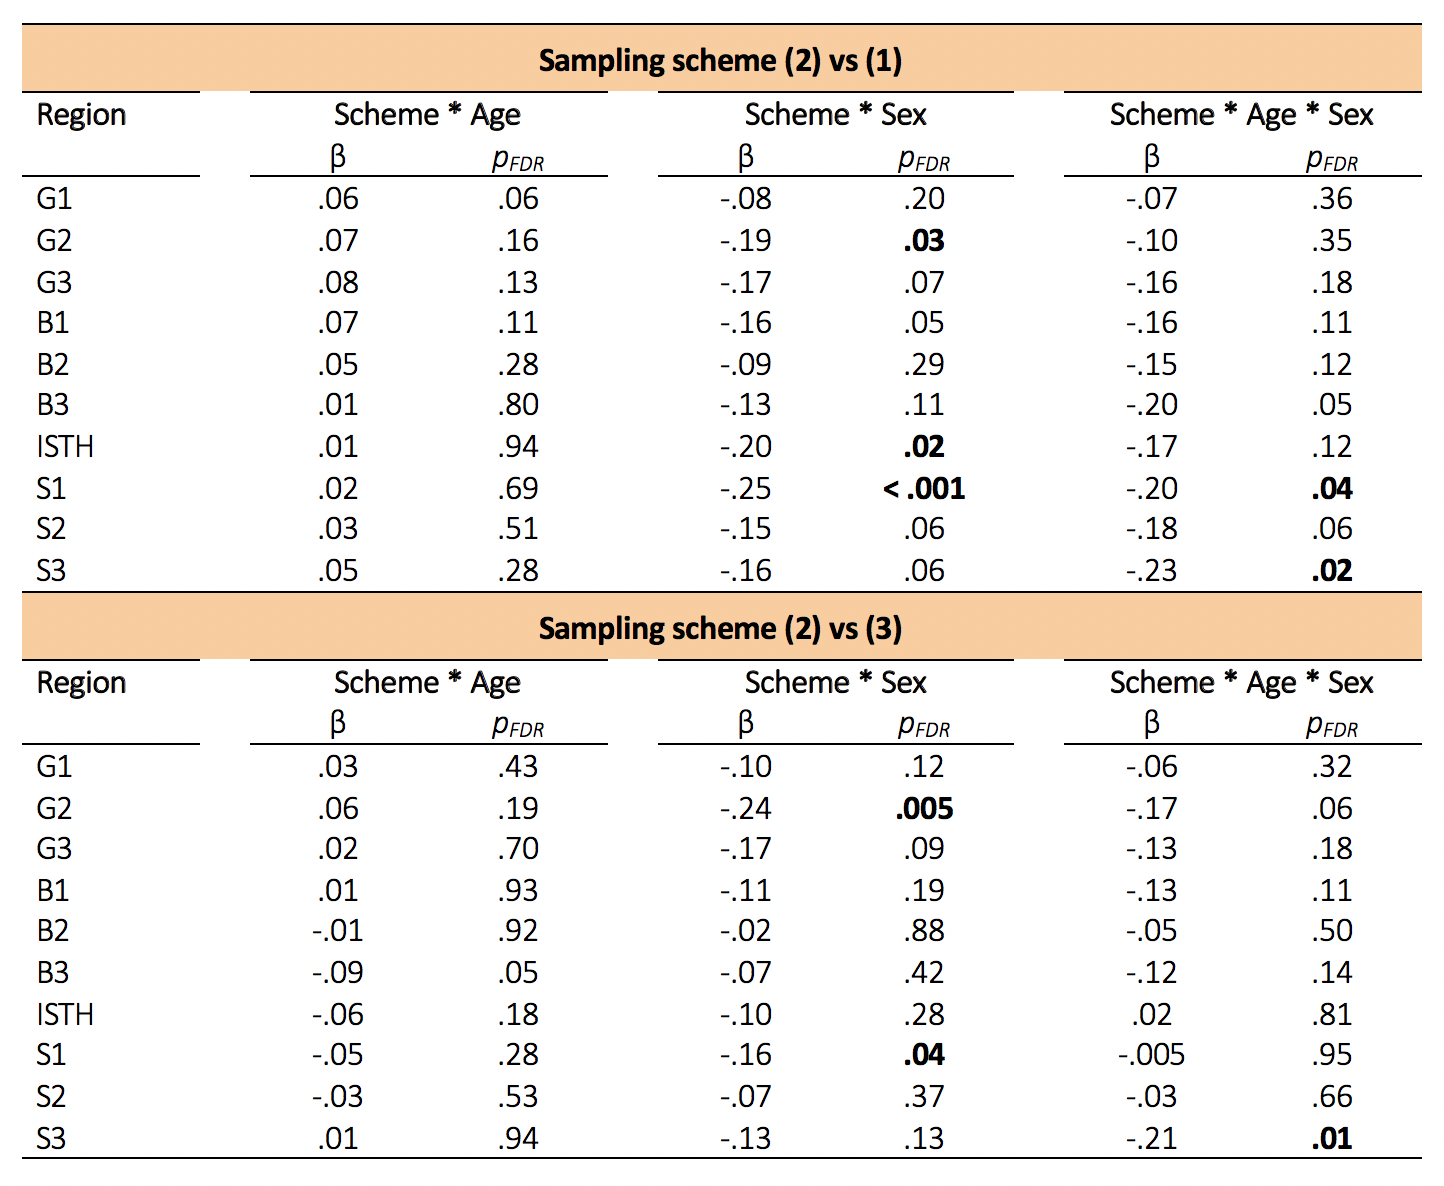
Confirmatory analysis in the corpus callosum revealed evidence for a region*sampling-scheme*age interaction. Upon further investigation of AFD in each callosal subregion, we observed statistically significant age and sex interactions when comparing the 2nd "clinical" sampling scheme, with the other two schemes which included higher b-values(Fig 3c,4). Overall, males had a greater positive relationship between AFD and age in the 2nd "clinical" sampling scheme(Fig 3c).
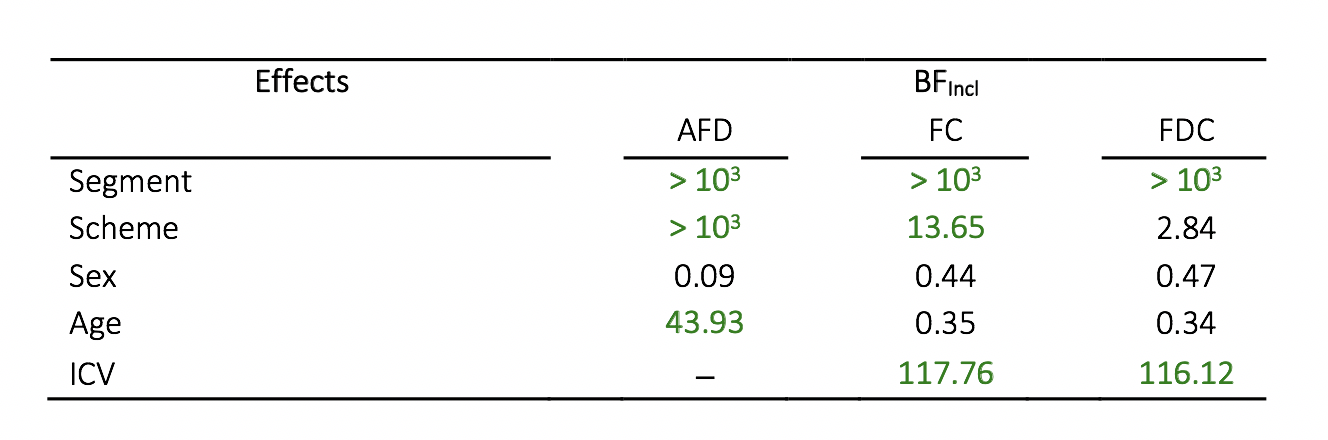
To assess sensitivity to detect effects in the current sample size, we performed follow-up Bayesian statistical analyses(Fig 5). These results revealed we were sensitive to age effects for AFD (BFIncl=43.93), segment for all FBA metrics (BFIncl>103) and sampling scheme for AFD (BFIncl>103) and FC (BFIncl=13.65). We observed evidence for the null in terms of sex and AFD (BFIncl=.09), which is in line with the finding of no significant sex differences in the whole-brain FBA.
Discussion
Our findings of age-related fibre development in the posterior body and left cingulum are in line with known neurodevelopmental patterns[9,10]. There were no sex differences in AFD, however the insensitivity to sex differences in FC/FDC warrants confirmation in a larger sample size. The main results of the whole-brain FBA were consistent across sampling schemes, suggesting robustness of this method in detecting white matter developmental patterns. We did, however, observe evidence that AFD may be over-estimated at lower “clinical” b-values. We expect that sampling schemes including higher b-values would improve AFD estimation, since increasing b-value strengthens signal attenuation of the extra-axonal space leading to more specific probing of the intra-axonal space. These patterns may vary across more complex fibre populations, which is the basis for future work.Conclusion
Age-related development of fibre properties is dominated by the posterior body of the corpus callosum and left cingulum. Whole-brain FBA was robust across different sampling schemes; however, we report evidence for interactions between sampling scheme and age and sex, for apparent fibre density in the genu and splenium. This may suggest that AFD is overestimated in clinical sampling schemes, potentially due to the emergence of complex fibre configurations developing with age.Acknowledgements
We would like to extend our gratitude to the children and families that participated in the CUBRIC Kids study. We would also like to thank Umesh Rudrapatna for his assistance with the set-up of image acquisition protocols.References
[1] Paus, T. (2010). "Growth of white matter in the adolescent brain: myelin or axon?" Brain Cogn 72(1): 26-35.
[2] Raffelt, D. A., J. D. Tournier, R. E. Smith, D. N. Vaughan, G. Jackson, G. R. Ridgway and A. Connelly (2017). "Investigating white matter fibre density and morphology using fixel-based analysis." Neuroimage 144(Pt A): 58-73.
[3] Jones, D. K., D. C. Alexander, R. Bowtell, M. Cercignani, F. Dell'Acqua, D. J. McHugh, K. L. Miller, M. Palombo, G. J. M. Parker, U. S. Rudrapatna and C. M. W. Tax (2018). "Microstructural imaging of the human brain with a 'super-scanner': 10 key advantages of ultra-strong gradients for diffusion MRI." Neuroimage 182: 8-38.
[4] Sairanen, V., A. Leemans and C. M. W. Tax (2018). "Fast and accurate Slicewise OutLIer Detection (SOLID) with informed model estimation for diffusion MRI data." Neuroimage 181: 331-346.
[5] Veraart, J., E. Fieremans and D. S. Novikov (2016). "Diffusion MRI noise mapping using random matrix theory." Magn Reson Med 76(5): 1582-1593. [6] Andersson, J. L. R. and S. N. Sotiropoulos (2016). "An integrated approach to correction for off-resonance effects and subject movement in diffusion MR imaging." Neuroimage 125: 1063-1078.
[7] Raffelt, D. A., R. E. Smith, G. R. Ridgway, J. D. Tournier, D. N. Vaughan, S. Rose, R. Henderson and A. Connelly (2015). "Connectivity-based fixel enhancement: Whole-brain statistical analysis of diffusion MRI measures in the presence of crossing fibres." Neuroimage 117: 40-55.
[8] Aboitiz, F., A. B. Scheibel, R. S. Fisher and E. Zaidel (1992). "Fiber composition of the human corpus callosum." Brain Res 598(1-2): 143-153.
[9] Genc, S., C. B. Malpas, G. Ball, T. J. Silk and M. L. Seal (2018). "Age, sex, and puberty related development of the corpus callosum: a multi-technique diffusion MRI study." Brain Struct Funct 223(6): 2753-2765.
[10] Genc, S., R. E. Smith, C. B. Malpas, V. Anderson, J. M. Nicholson, D. Efron, E. Sciberras, M. L. Seal and T. J. Silk (2018). "Development of white matter fibre density and morphology over childhood: A longitudinal fixel-based analysis." NeuroImage 183: 666-676.
Figures