0380
The Role of Diffusion Tensor Imaging in the Characterisation of Paediatric Brain Tumours - a Multi-Centre Study1Institute of Cancer and Genomic sciences, The University of Birmingham, Birmingham, United Kingdom, 2Birmingham Children's Hospital, Birmingham, United Kingdom, 3School of Life and Health sciences, Aston University, Birmingham, United Kingdom, 4Department of Radiology, Alder Hey Children's NHS Foundation Trust, Liverpool, United Kingdom, 5Institute of Digital Healthcare, WMG, University of Warwick, Coventry, United Kingdom, 6Institute of Child Health, Great Ormond Street Hospital, London, United Kingdom, 7Paediatric Oncology Department, Great North Children’s Hospital, Newcastle upon Tyne, United Kingdom, 8Neuroradiology Department, Newcastle upon Tyne Hospitals, Newcastle upon Tyne, United Kingdom, 9The Children‘s Brain Tumour Research Centre, University of Nottingham, Nottingham, United Kingdom
Synopsis
CNS tumours are the most common solid tumour in paediatrics and the most common cause of childhood cancer deaths. The diagnostic role of Diffusion Tensor Imaging (DTI) in patients with either medulloblastoma (MB), pilocytic astrocytoma (PA) or ependymoma (EP) was investigated. Fractional anisotropy (FA) and mean diffusivity (MD) means were found to be significantly different between tumour groups, as determined by one-way ANOVA (p=0.0002 and <0.0001). MD distributions enabled classification of tumour type, using linear discriminant analysis (LDA), with an average accuracy of 80%. DTI metrics were shown to provide an insight into the structure of paediatrics CNS tumours with LDA classification using MD demonstrating improved accuracy over FA.
Introduction
CNS tumours are the most common solid tumour in paediatrics. Due to their complex nature they are the most common cause of childhood cancer deaths1. Development of an accurate non-invasive diagnosis will aid surgical decision making. Diffusion weighted imaging is used routinely to aid the discrimination between different tumour types in children and monitors the random movement of molecules with diffusion tensor imaging (DTI). This provides additional directionality allowing the mean diffusivity (MD) and fractional anisotropy (FA), a measure of anisotropy, to be calculated. DTI of paediatric brain tumours2 has previously found a negative correlation between MD and cell density however no relationship was found between the FA and cell density. Importantly, a relationship between DTI metrics, including FA, and survival has been found in adults with Glioblastomas3, with the potential to support treatment decisions. We have investigated the role of DTI metrics in the diagnosis of three paediatric brain tumours: medulloblastoma (MB), pilocytic astrocytoma (PA) and ependymoma (EP).Methods
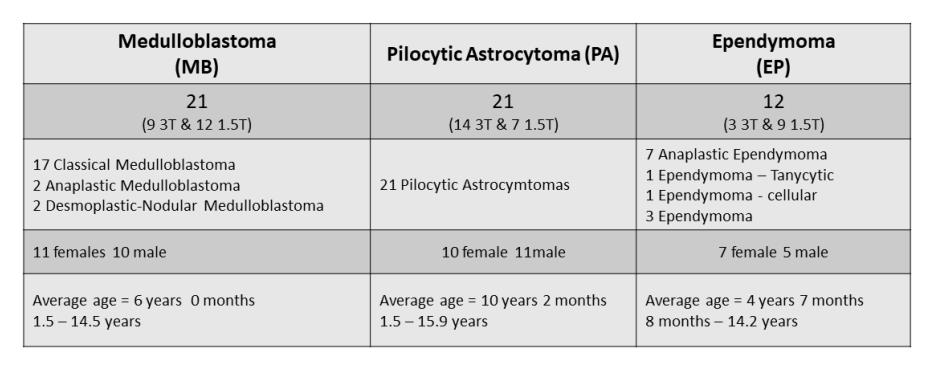
DTI was acquired using a nationally agreed protocol, which allowed local variations but with previously reported quality measures in volunteers4. Clinical and imaging data were analysed from 5 centres across the UK and shared via the Children’s Cancer and Leukaemia Group (CCLG) Functional Imaging database. Patients with a tumour in the brain diagnosed as MB (21), PA (21) or EP (12) and with DTI (Gradient directions=6 to 32, b values=0,800/1000 s/mm2, field strength=1.5T or 3T), available at diagnosis, were included in the study (Figure 1). FSL5 was used to calculate FA and MD maps, with values for the solid regions of tumour extracted using in-house software written in Python 2.7. FA and MD distributions were compared. Principle Components explaining 89% of variance were used for linear discriminant analysis (LDA) of FA, MD and FA and MD features combined. Classification accuracy was evaluated using leave-one-out cross-validation (LOOCV).Results
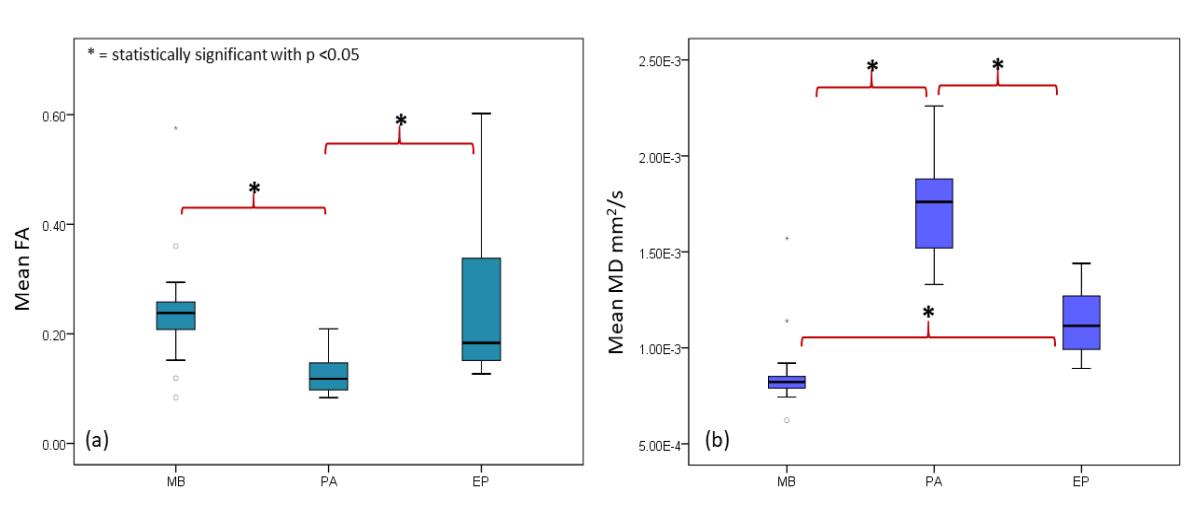
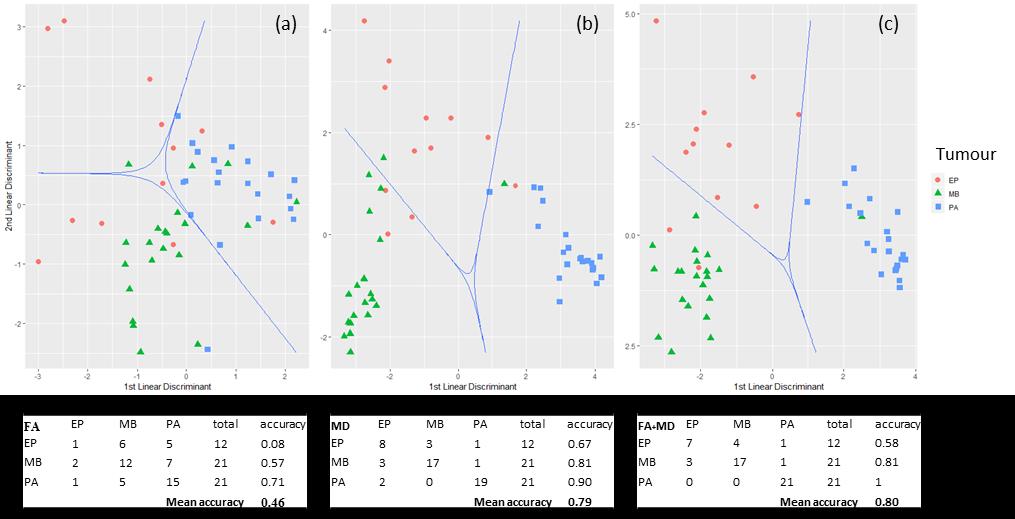
FA (MB=0.24±0.1, PA=0.13±0.04, EP=0.26±0.15)) and MD (MB=0.0009±0.0002, PA=0.0017±0.0003, EP=0.0011±0.0002 mm2/s) means were significantly different between tumour groups as determined by one-way ANOVA (p=0.0002 and <0.0001) (Figure 2). A Tukey post hoc test showed that both the FA mean and variance was significantly higher for EP than PA (p=0.001 and 0.005), conversely MD values were lower for EP than PA (p <0.0001). Mean and median MD values (p < 0.0001 in both cases) were significantly different between EP and MB. However, this was not seen for any FA metrics. There were no significant differences seen in metrics acquired using b = 800 or 1000 s/mm2 (p = 0.4 to 1) other than those distinguishing tumour type. ROC analysis, between each tumour, showed that mean and median MD performs best as a diagnostic marker with AUCs between 0.92 and 0.99. ROC analysis of FA mean and median between EP and PA demonstrated AUCs of 0.83 and 0.84 respectively. LOOCV showed an overall accuracy of the LDA classification of 46% for FA features, 79% for MD features and 80% for FA and MD features combined. (Figure 3)Discussion
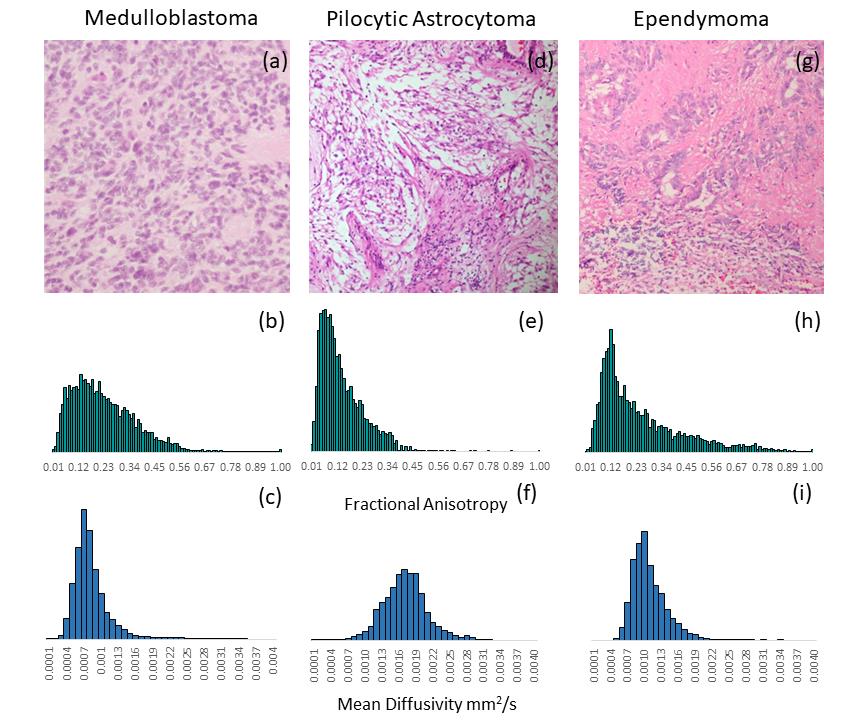
Mean and median MD results perform best as diagnostic markers between the tumour groups. Tumour LDA classification accuracy was comparable using MD or a combination of FA and MD features due to the poor classification power of FA. FA does however classify PA with 71% accuracy and contribute positively to the classification of PA tumours when combining MD and FA features. While differentiation of PA from MB and EP is not a distinct problem in a clinical setting these results infer a relationship between the cellular structure of the tumours and DTI metrics. Structurally, PAs differ from MB and EP being less cellular and more cystic. While macroscopic cystic areas were excluded from the analysis, micro-cystic components of the tumours remained. This was reflected in both the MD and the FA results with diffusion more isotropic and at higher rates, resulting in the lower mean FA and higher mean MD values, in PA tumours (Figure 4). Additionally, higher variance in FA was seen in EP and MB, with these tumours appearing more heterogeneous in structure compared to PA. While MD features have the potential to classify by tumour type, structural differences reflected in both FA and MD metrics may provide a means of distinguishing tumours tissue from surrounding normal brain, identifying tumour infiltration.Conclusion
DTI metrics can provide an insight into the structure of CNS tumours in paediatrics with LDA classification using MD demonstrating improved accuracy over FA. While classification using combined FA and MD features improves the accuracy of PA classification it reduces that of EP and shows no significant impact on the classification of MB tumours.Acknowledgements
The authors would like to thank the following hospitals for supporting this research: Birmingham Children's Hospital, Alder hey Children's hospital, Queen Medical Centre, Great Ormond Street Hospital and The Great North Children's Hospital and Dr Sarah Kohe for providing the representative H&E slides.This project was support with funding provided by the NIHR, EPSRC, CCLG and Children with Cancer UK.References
1. Stiller, C., Oxford University Press: Oxford Scholarship Online, 2007.
2. Gauvain, K. M., et al., American Journal of Roentgenology 2001, 177 (2), 449-454.
3. Saksena, S., et al., Journal of Magnetic Resonance Imaging 2010, 32 (4), 788-795.
4. Grech-Sollars, M., et al., NMR in Biomedicine 2015, 28 (4), 468-485.
5. Jenkinson, M., et al., NeuroImage 2012, 62 (2), 782-790.
Figures