0374
Musculoskeletal Lipid Compartments Separation and Quantification by High-Resolution Metabolite Cycling Magnetic Resonance Spectroscopic Imaging at 3 T1School of Health Sciences, Purdue University, West Lafayette, IN, United States, 2Department of Radiology, University of California Los Angeles, Los Angeles, CA, United States, 3Department of Radiology and Imaging Sciences, Indiana University School of Medicine, Indianapolis, IN, United States, 4Weldon School of Biomedical Engineering, Purdue University, West Lafayette, IN, United States
Synopsis
A fast and high-resolution density-weighted concentric ring trajectory metabolite cycling MRSI sequence was implemented to generate simultaneous lipid- and water-only spectra within a short scan time (~3 min) at 3T, and compared to Dixon MRI. LCModel was used to fit the peaks of intramyocellular and extramyocellular lipids that were used to generate separate high-resolution maps for each of these lipid compartments. In addition, the proposed MRSI sequence showed higher sensitivity by sampling lipids at areas that Dixon failed to detect any lipid signal.
Introduction
The increase of musculoskeletal fat content has been linked to several diseases such as type 2 diabetes mellitus1, cerebral palsy2, and Duchenne muscular dystrophy3. The Dixon MRI technique4 is usually used to quantify fat fraction (FF). However, the Dixon method cannot differentiate between intramyocellular lipid (IMCL) and extramyocellular lipid (EMCL). In certain situations, IMCL (especially the methylene group IMCL of ~1.25 ppm resonance) becomes the lipid of particular interest since its increase has been found to be a marker for insulin resistivity5. Although single voxel MRS can differentiate these lipid peaks, it cannot map their distribution. Conventional magnetic resonance spectroscopy imaging (MRSI) overcomes this by providing spatially resolved spectra over any ROI size, but it requires a long acquisition time. In this work, we demonstrate a high-resolution density–weighted concentric ring trajectory (DW-CRT) metabolite cycling MRSI acquisition, which provides high SNR results of simultaneous fat and water-only spectra in less than 4 minutes at 3T.Methods
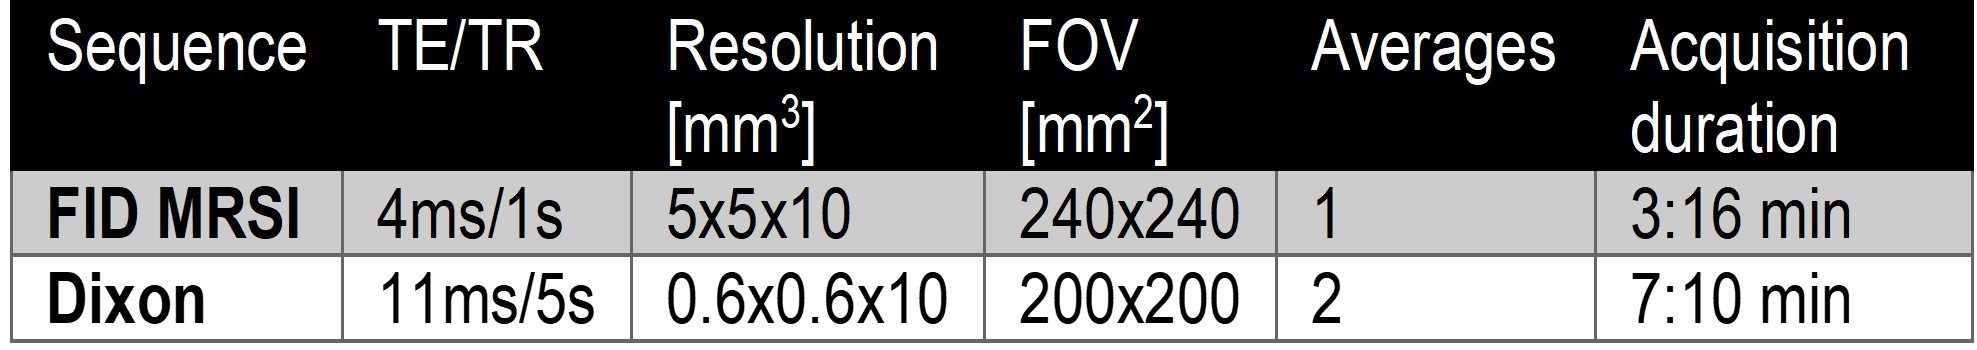
In-vivo lower leg scans were acquired from healthy volunteers using the integrated body coil of the Siemens Prisma 3-Tesla MR system (Siemens, Germany). The scanning parameters are summarized in Table.1.
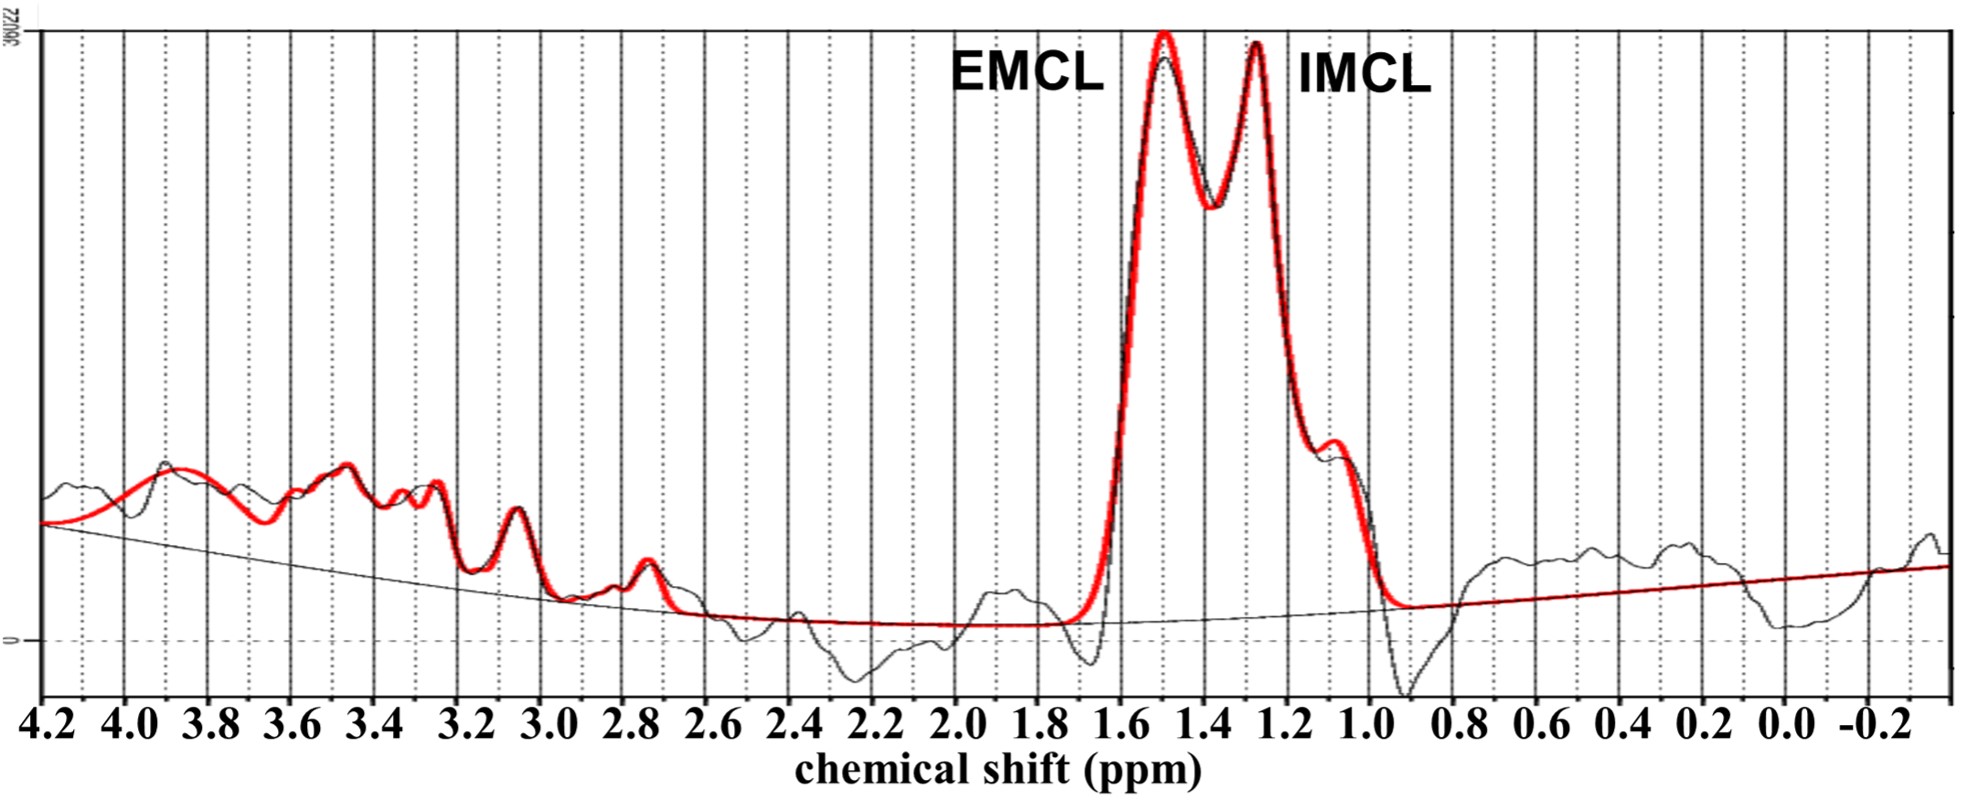
DW-CRT6 with a metabolite-cycling acquisition technique was implemented. To fit and quantify the IMCL of ~1.25 ppm and EMCL of 1.5 ppm chemical shift, the MRSI spectra were fed to LCModel7. To generate the MRSI maps, only peaks with Cram´er-Rao lower bounds of 8 or less (measured by LCModel) were used. To compare our MRSI results to those from the Dixon technique, the Structural Similarity (SSIM) Index method8 was used.
Results
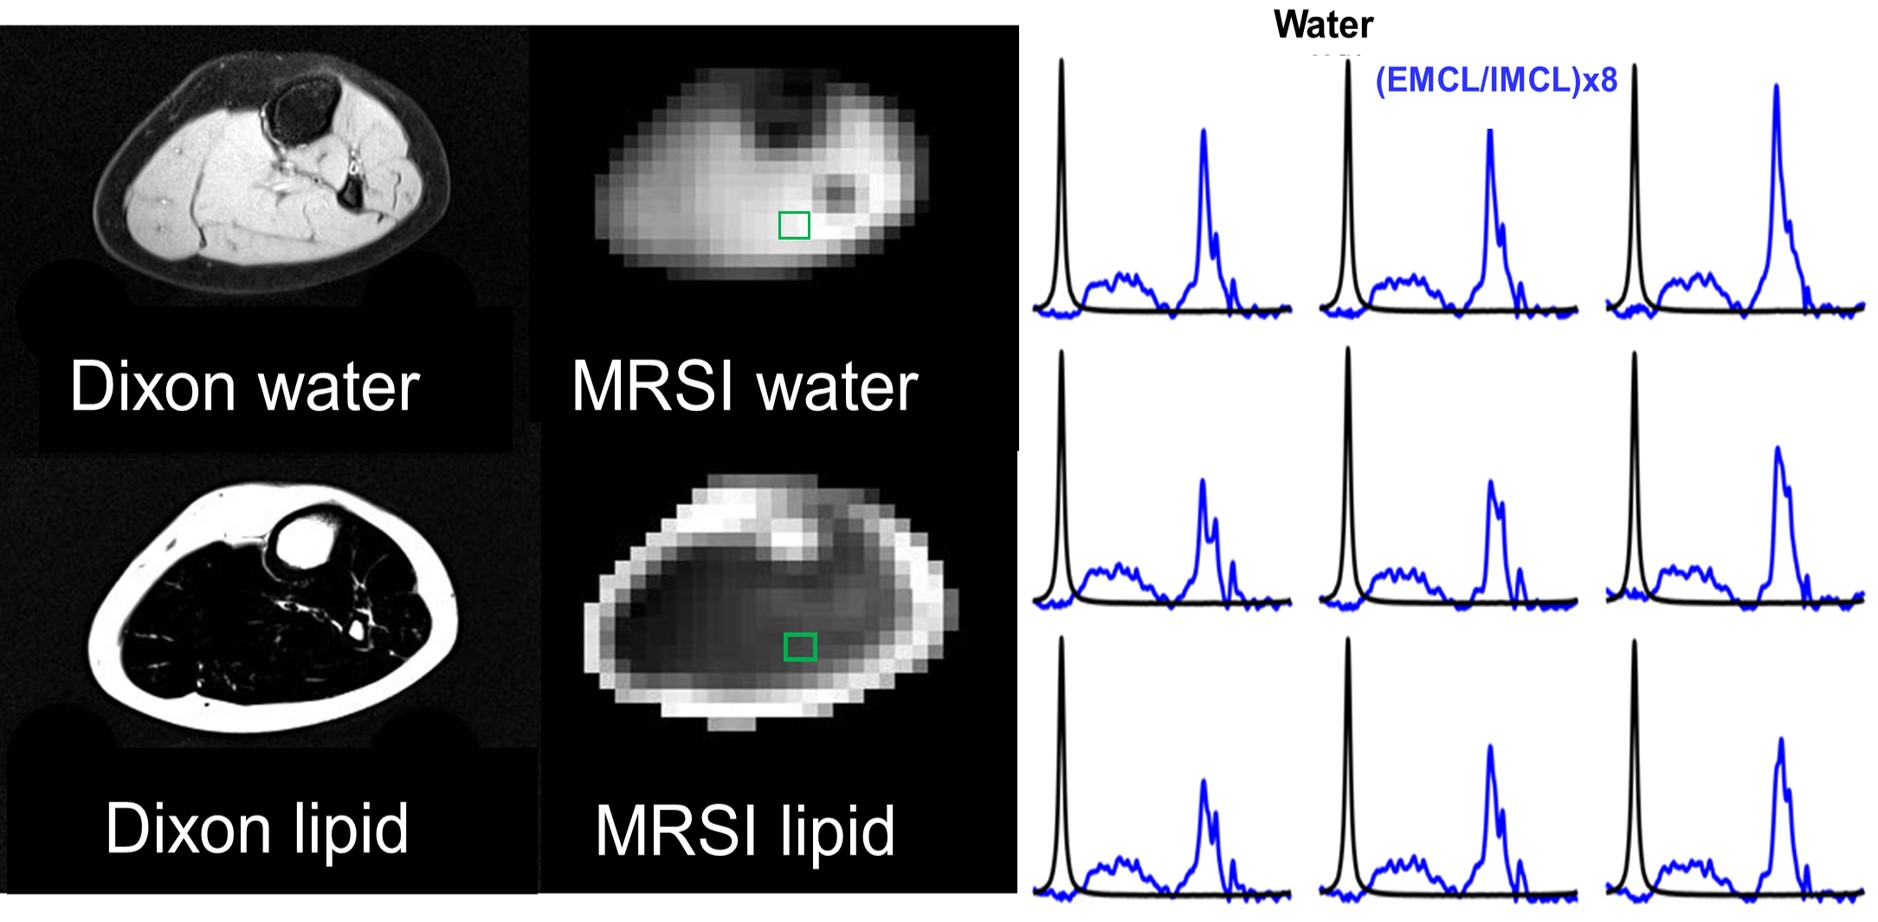
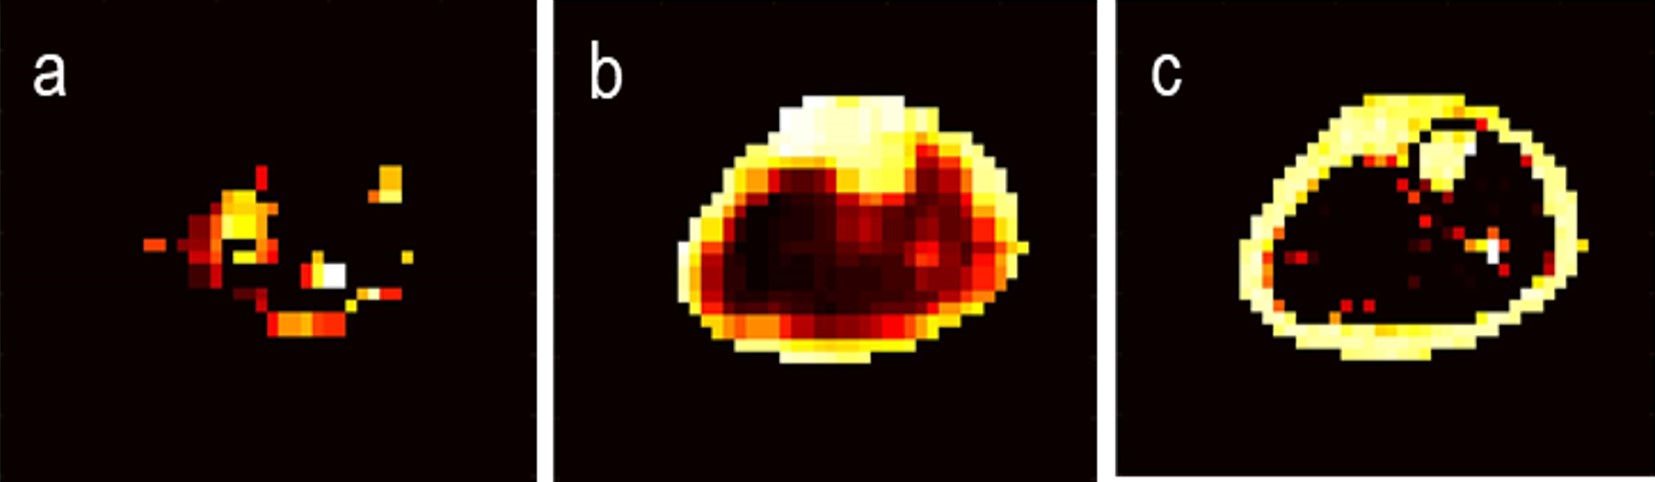
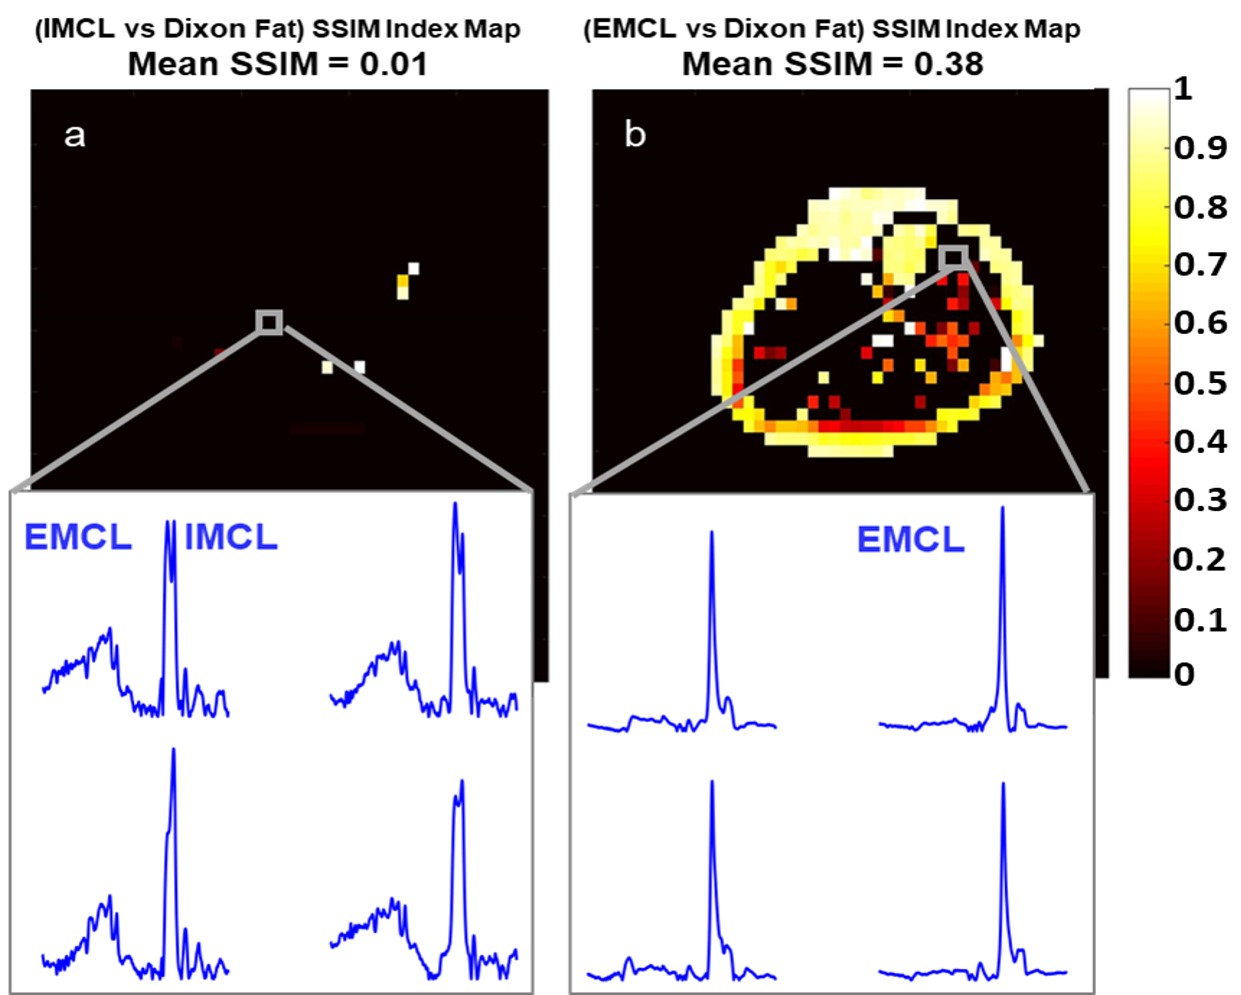
Representative water and lipid-only images and spectra from the FID DW-CRT MRSI are illustrated in Figure 1. An example of a fitted spectrum by LCModel is shown in Figure 2. The separate EMCL and IMCL distribution maps derived from the MRSI sequence were listed in Figure 3 next to the Dixon fat only image. The SSIM analysis is represented in maps to show a voxel-wise structural matching between MRSI and Dixon results (Figure 4). The darker the area within the SSIM map, the highest the mismatching between the compared images. The mean value of the SSIM index between MRSI EMCL and Dixon was 0.38, whereas the mean value of the SSIM index between IMCL and Dixon was only 0.01. Spectra from the totally mismatching voxels (black in the SSIM maps) were generated to show that the MRSI was able to sample fat that was undetectable by the used Dixon technique.Discussion and Conclusion
The results show that our proposed MRSI sequence can generate separate high-resolution EMCL and IMCL distribution maps in a short scan time (~3 min). Nevertheless, it can detect lipid in areas not detected by Dixon. Thus, it is more sensitive. Unlike the MRSI, the used Dixon technique is mainly showing the EMCL type of fat and cannot efficiently detect the IMCL as can be concluded from the SSIM analysis which compares the same voxels from the two techniques. The advantage of our MRSI sequence makes it suitable as a basic clinical tool to quantify the different types of lipid as well as FF since it also provides water-only images.Acknowledgements
Supported by the Indiana CTSI, funded in part by grant #UL1TR001108 from the NIH, NCATS, CTS Award.References
1. Goodpaster BH, Thaete FL, Kelley DE. Thigh adipose tissue distribution is associated with insulin resistance in obesity and in type 2 diabetes mellitus–. The American journal of clinical nutrition. 2000 Apr 1;71(4):885-92.
2. Johnson DL, Miller F, Subramanian P, Modlesky CM. Adipose tissue infiltration of skeletal muscle in children with cerebral palsy. The Journal of pediatrics. 2009 May 1;154(5):715-20.
3. Wren TA, Bluml S, Tseng-Ong L, Gilsanz V. Three-point technique of fat quantification of muscle tissue as a marker of disease progression in Duchenne muscular dystrophy: preliminary study. American Journal of Roentgenology. 2008 Jan;190(1):W8-12.
4. Dixon WT. Simple proton spectroscopic imaging. Radiology. 1984 Oct;153(1):189-94.
5. Krssak MF, Petersen KF, Dresner A, DiPietro L, Vogel SM, Rothman DL, Shulman GI, Roden M. Intramyocellular lipid concentrations are correlated with insulin sensitivity in humans: a 1H NMR spectroscopy study. Diabetologia. 1999 Jan 1;42(1):113-6.
6. Steel A, Chiew M, Jezzard P, Voets NL, Plaha P, Thomas MA, Stagg CJ, Emir UE. Metabolite-cycled density-weighted concentric rings k-space trajectory (DW-CRT) enables high-resolution 1 H magnetic resonance spectroscopic imaging at 3-Tesla. Scientific reports. 2018 May 17;8(1):7792.
7. Provencher SW. Estimation of metabolite concentrations from localized in vivo proton NMR spectra. Magnetic resonance in medicine. 1993 Dec;30(6):672-9.
8. Wang Z, Bovik AC, Sheikh HR, Simoncelli EP. Image quality assessment: from error visibility to structural similarity. IEEE transactions on image processing. 2004 Apr;13(4):600-12.
Figures