0373
Measuring large lipid droplet sizes by probing restricted lipid diffusion effects with Diffusion-Weighted Magnetic Resonance Spectroscopy at 3 T1Department of Diagnostic and Interventional Radiology, Technical University Munich, Munich, Germany, 2Else Kröner Fresenius Center for Nutritional Medicine, Technical University Munich, Munich, Germany, 3Chair for Food and Bioprocess Engineering, Technical University Munich, Freising, Germany, 4Clinic of Orthopaedic Surgery, Technical University Munich, Munich, Germany, 55 Department of Computer Science, Technical University Munich, Munich, Germany
Synopsis
Despite its strong relevance in metabolism, non-invasive measurement of adipocyte size remains an unmet need. High b-value DW-MRS has been previously applied to probe diffusion restriction effects of intramyocellular lipids or brown adipocytes using preclinical systems with strong gradient systems. However, probing diffusion restriction in large lipid droplets on a clinical system remains a major challenge. The present work proposes a methodology to probe lipid droplet sizes with high b-value long diffusion time DW-MRS. The method was examined with simulations, validated in phantoms and tested to estimate bone marrow adipocyte size in the tibia of healthy subjects.
Purpose
The non-invasive measurement of adipocyte size has a wide range of applications in studies of obesity and metabolism1. Adipocyte size has been linked in differentiating brown from white fat2 and in differentiating constitutive from regulated bone marrow adipose tissue (BMAT)3. However, assessment of lipid size currently requires highly invasive biopsies. Diffusion-weighted (DW) magnetic resonance (MR) is a powerful tool for the non-invasive assessment of tissue microstructure. Measuring lipid diffusion properties is however challenging, since fat has a diffusion coefficient approximately two orders of magnitude lower than water4,5. The low lipid diffusion coefficient increases the required diffusion weighting. This creates technical challenges related to eddy currents6 and an increased sensitivity to motion7. DW-MR spectroscopy (DW-MRS) is a versatile tool to measure diffusion properties of metabolites8,9. Recently, high b-value DW-MRS has been applied to study intramyocellular lipid diffusion10. Diffusion restriction effects have been also reported in murine brown adipocytes ex vivo using a preclinical system2. However, probing diffusion restriction in large lipid droplets remains a major challenge due to the need for high b-value and long diffusion time DW-MRS. The present work proposes a methodology to probe diffusion restriction in large lipid droplets using DW-MRS. The method was examined with simulations, validated in phantoms and applied in vivo to estimate the tibia BMAT adipocyte size.Methods
Background:
The signal decay assuming restricted diffusion and spherical boundaries can be described by11:
$$$ln\left(\frac{S\left(\Delta,\delta,G\right)}{S_{0}\left(\Delta\right)}\right)=-2\gamma^{2}G^{2}\sum_{m=1}^{\infty}\left[\alpha_{m}^{2}\left(\alpha_{m}^{2}\left(\frac{d}{2}\right)^{2}-2\right)\right]^{-1}\\*\left(\frac{2\delta}{\alpha_{m}^{2}D}-\frac{2+exp\left(-\alpha_{m}^{2}D\left(\Delta-\delta\right)\right)-2exp\left(-\alpha_{m}^{2}D\delta\right)-2exp\left(-\alpha_{m}^{2}D\Delta\right)+exp\left(-\alpha_{m}^{2}D\left(\Delta+\delta\right)\right)}{\left(\alpha_{m}^{2}D\right)^{2}}\right)\quad\left(1\right)$$$
where S: DW signal, S0: Non-DW signal, ∆: diffusion time, δ: diffusion gradient length, G: gradient strength, d: restriction barrier diameter, D: free diffusion constant and αm: roots obtained by a separate differential equation. Equation 1 can be employed to extract d:
$$$\underset{D,d,T_{1},\rho}{arg\min}\left\lvert\left\lvert S\left(\Delta,\delta,G,T_{1}\right)*\rho*exp\left(-\frac{TM}{T_{1}}\right)-S_{exp}\right\rvert\right\rvert\quad\left(2\right)$$$
Sequence and post-processing:
A bipolar DW STEAM sequence (Figure 1) was employed12. The spectra processing included zero order phasing and frequency alignment of individual averages. Averages with a deviation of the methylene peak amplitude of more than two standard deviations from the mean were excluded. Peak area quantification was performed considering eight fat peaks12. Only the methylene peak (at 1.3ppm) was used to fit equation 2 because fat peaks differ in ADC and T1 relaxation time.
Simulation:
A Monte Carlo simulation with the following parameters was performed: TM: 300/400/500/600/700 ms, δ: 28 ms, b-value: 10,000/20,000/40,000/60,000 s/mm2, D: 0.7x10⁻⁵(phantom) / 1.5x10⁻⁵ mm2/s(in vivo) and d: 60 µm. SNR was defined as (signal amplitude)/(standard deviation) at the lowest diffusion weighting.
Phantom:
Water-fat phantoms closely resembling in vivo adipose tissue were produced (content: 800ml oil, 200ml water, 4ml Tween80, 1g of sodium benzoate). Emulsification was carried out with a colloid mill at 5000/6000/9000/12000 revolutions per minute. The phantoms were scanned on a 3T system (Ingenia Elition, Philips, Best) using an 8-channel wrist coil with the following parameters: VOI: (15 mm)3, TE/TR: 60/1800 ms, 16 averages, b-values: 10,000/20,000/40,000/60,000 s/mm2, TM: 300/400/500/600/700 ms, scan time: 14:02 min. To minimize vibration, a wooden table was used. For validation, the particle size was measured by dynamic light scattering (Mastersizer 2000, Malvern Instruments, Worcestershire).
In vivo:
To identify location dependent microstructural differences, seven volunteers (age: 27.0±1.8) were scanned at two tibia locations (proximal: 1cm below the growth plate; distal: 4cm below the growth plate). The robustness was measured by scanning the proximal location of three volunteers three times with repositioning. The phantom protocol and an 8-channel extremity coil was employed.
Results
Simulation:
Figure 2 shows that the simulated error stays below 7.6% (phantom) and below 9.3% (in vivo) for experimentally determined SNR.
Phantom:
Figure 3 shows representative spectra and signal curves with a good agreement regarding the theoretical model. Figure 4 compares the mean diameter obtained by DW-MRS and laser deflection. The linear regression showed a high coefficient of determination (R2/p/slope/offset: 0.98/0.01/0.89/0.41µm).
In vivo:
The repeatability analysis (Figure 5a) reveals a mean coefficient of variation13 for the BMAT adipocyte size of 11.5%. In the volunteer study (Figure 5b) the mean diameter was 50.1±7.3µm (proximal) and 61.1±6.8µm (distal) with a significant difference (p<0.01).
Discussion and Conclusion
The simulations showed that the method is capable of measuring lipid droplet sizes which was also validated by the phantom study. In vivo, the measurements showed good reproducibility. BMAT adipocytes were found to have a diameter between 40-70 µm, showing a tendency for larger cells more distally in the tibia. BMAT adipocytes were previously shown to have a diameter of around 60µm14 and recent findings indicate that they increase in size from proximal to distal locations3. Therefore, the reported sizes and microstructural differences are consistent with previous literature. In summary, the proposed method was able to measure large lipid droplet sizes at a clinical scanner.Acknowledgements
The present work was supported by the European Research Council (grant agreement No 677661, ProFatMRI) and Philips Healthcare. This work reflects only the authors view and the EU is not responsible for any use that may be made of the information it contains.References
1.Skurk T, Alberti-Huber C, Herder C, Hauner H. Relationship between adipocyte size and adipokine expression and secretion. Journal of Clinical Endocrinology & Metabolism 2007;92(3):1023-1033.
2. Verma SK, Nagashima K, Yaligar J, Michael N, Lee SS, Xianfeng T, Gopalan V, Sadananthan SA, Anantharaj R, Velan SS. Differentiating brown and white adipose tissues by high-resolution diffusion NMR spectroscopy. J Lipid Res 2017;58(1):289-298.
3. Scheller EL, Doucette CR, Learman BS, Cawthorn WP, Khandaker S, Schell B, Wu B, Ding SY, Bredella MA, Fazeli PK, Khoury B, Jepsen KJ, Pilch PF, Klibanski A, Rosen CJ, MacDougald OA. Region-specific variation in the properties of skeletal adipocytes reveals regulated and constitutive marrow adipose tissues. Nat Commun 2015;6:7808.
4. Lehnert A, Machann J, Helms G, Claussen CD, Schick F. Diffusion characteristics of large molecules assessed by proton MRS on a whole-body MR system. Magn Reson Imaging 2004;22(1):39-46.
5. Steidle G, Eibofner F, Schick F. Quantitative Diffusion Imaging of Adipose Tissue in the Human Lower Leg at 1.5 T. Magnetic Resonance in Medicine 2011;65(4):1119-1125.
6. Jezzard P, Barnett AS, Pierpaoli C. Characterization of and correction for eddy current artifacts in echo planar diffusion imaging. Magn Reson Med 1998;39(5):801-812.
7. Anderson. Analysis and correction of motion artifacts in diffusion weighted imaging. Magn Reson Med 1994;32(3):379-387.
8. Nicolay K, Braun KP, Graaf RA, Dijkhuizen RM, Kruiskamp MJ. Diffusion NMR spectroscopy. NMR Biomed 2001;14(2):94-111.
9. Ronen I, Valette J. Diffusion-weighted magnetic resonance spectroscopy. eMagRes. Volume 4; 2015. p 733-750.
10. Brandejsky V, Kreis R, Boesch C. Restricted or severely hindered diffusion of intramyocellular lipids in human skeletal muscle shown by in vivo proton MR spectroscopy. Magn Reson Med 2012;67(2):310-316.
11. Murday JS, Cotts RM. Self-Diffusion Coeffcient of Liquid Lithium. Journal of Chemical Physics 1968;48(11):4938-&.
12. Ruschke S, Kienberger H, Baum T, Kooijman H, Settles M, Haase A, Rychlik M, Rummeny EJ, Karampinos DC. Diffusion-weighted stimulated echo acquisition mode (DW-STEAM) MR spectroscopy to measure fat unsaturation in regions with low proton-density fat fraction. Magn Reson Med 2016;75(1):32-41.
13. Gluer CC, Blake G, Lu Y, Blunt BA, Jergas M, Genant HK. Accurate Assessment of Precision Errors - How to Measure the Reproducibility of Bone Densitometry Techniques. Osteoporosis International 1995;5(4):262-270.
14. Rozman C, Reverter JC, Feliu E, Berga L, Rozman M, Climent C. Variations of Fat Tissue Fraction in Abnormal Human Bone-Marrow Depend Both on Size and Number of Adipocytes - a Stereologic Study. Blood 1990;76(5):892-895.
Figures
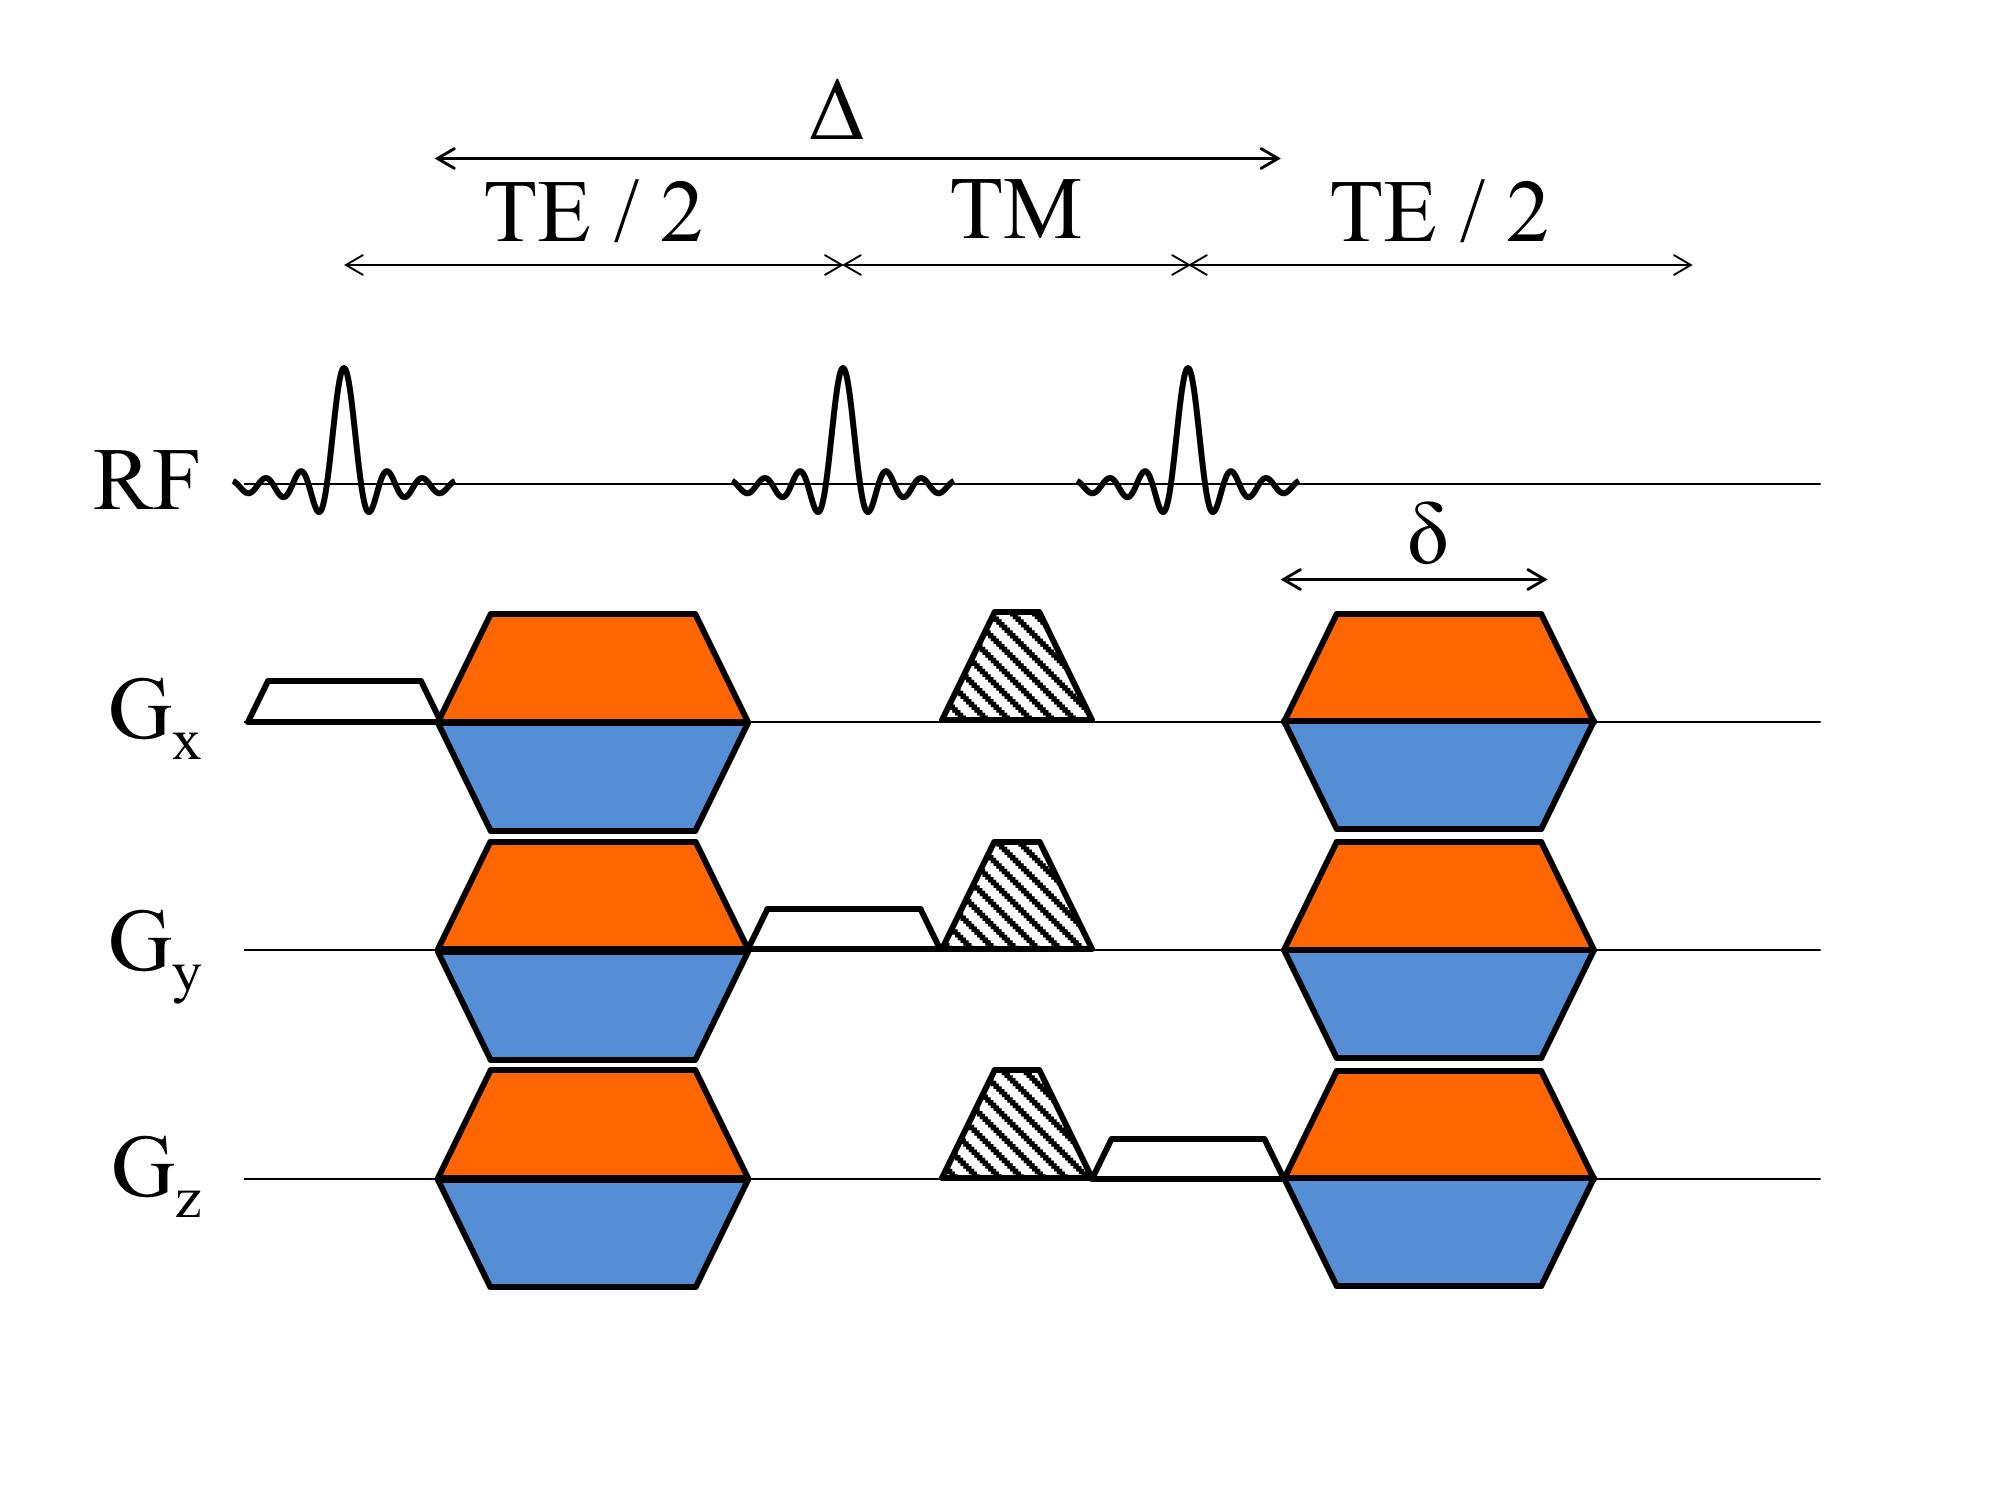
Figure1:
DW STEAM MRS sequence: The three 90° slice selective RF-pulses generate a stimulated echo in a single voxel. The diffusion gradients (in color) are introduced in a standard STEAM MRS sequence to achieve diffusion weighting. To compensate for eddy current effects the diffusion-weighting gradients alternate over the acquired averages between positive (orange) and negative (blue) polarity.
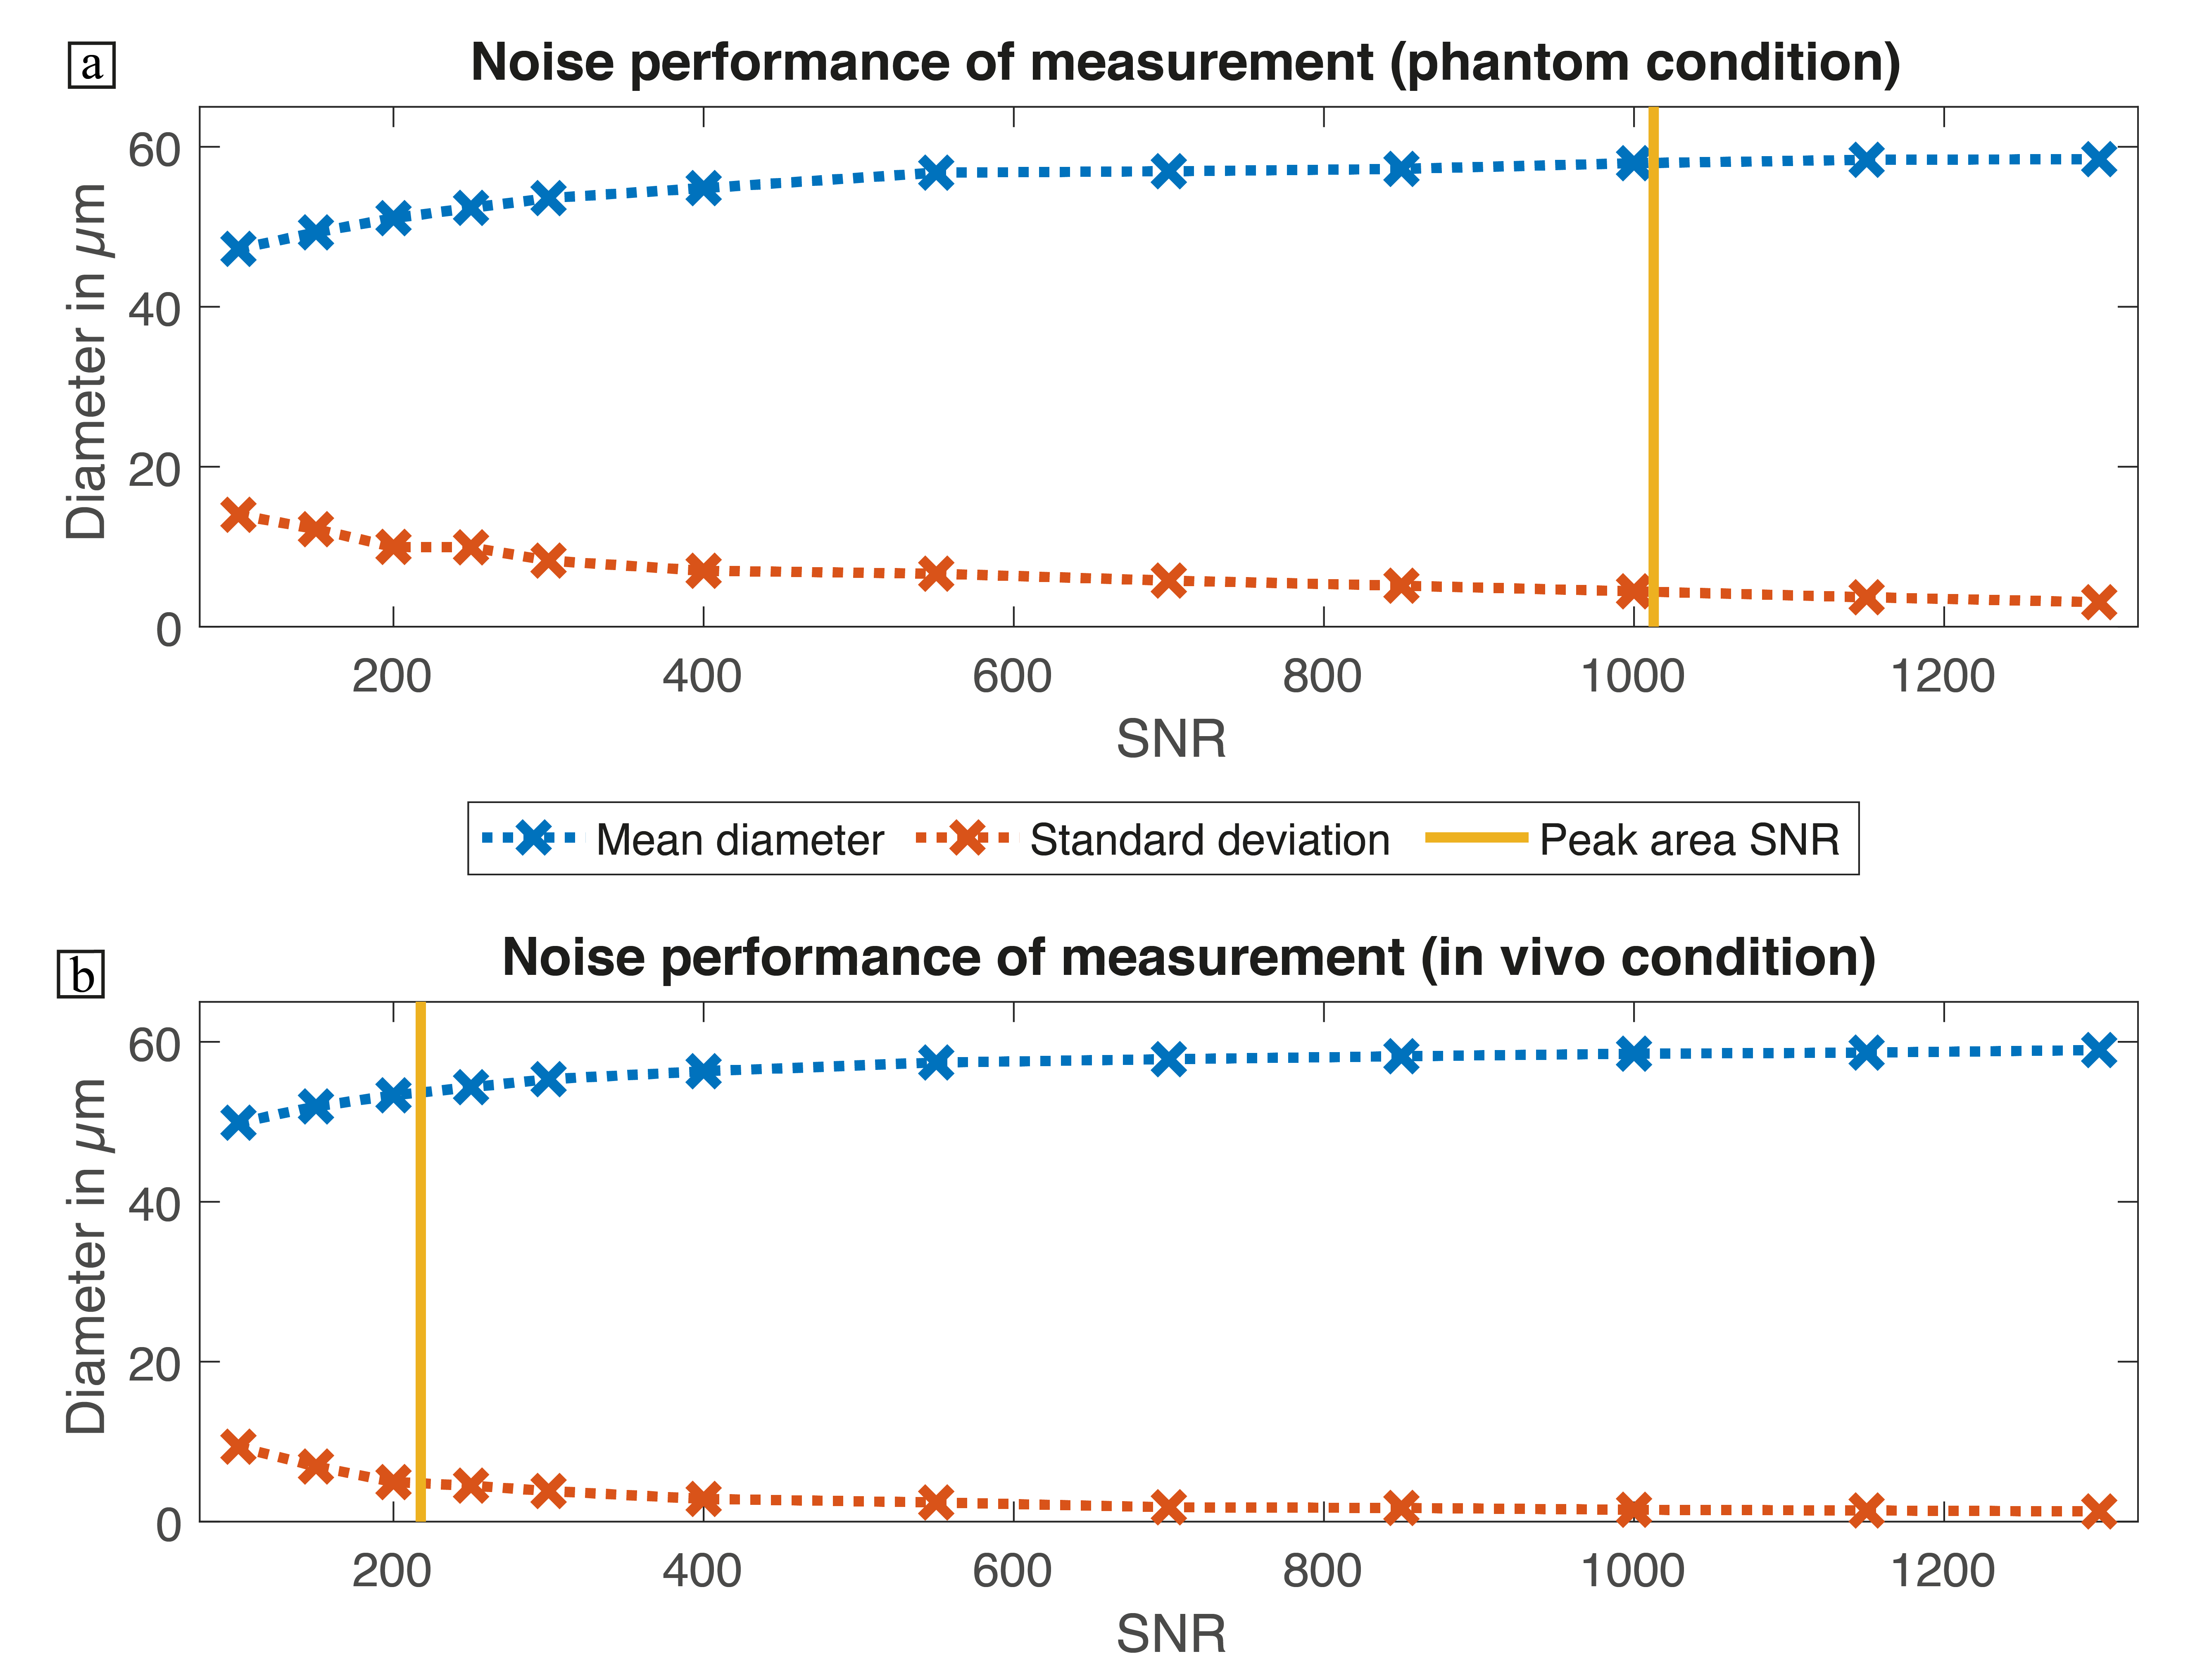
Figure 2:
Noise performance measurements of the droplet size estimation for different peak area SNR levels in (a) phantom and (b) in vivo conditions. The experimentally determined peak area SNR is also shown by the vertical yellow line. A decreased peak SNR leads to an underestimation of the theoretical diameter of 60 µm and a higher standard deviation. The experimentally measured peak SNR has a relative error of 7.6 % (phantom) and 9.3 % (in vivo), respectively.
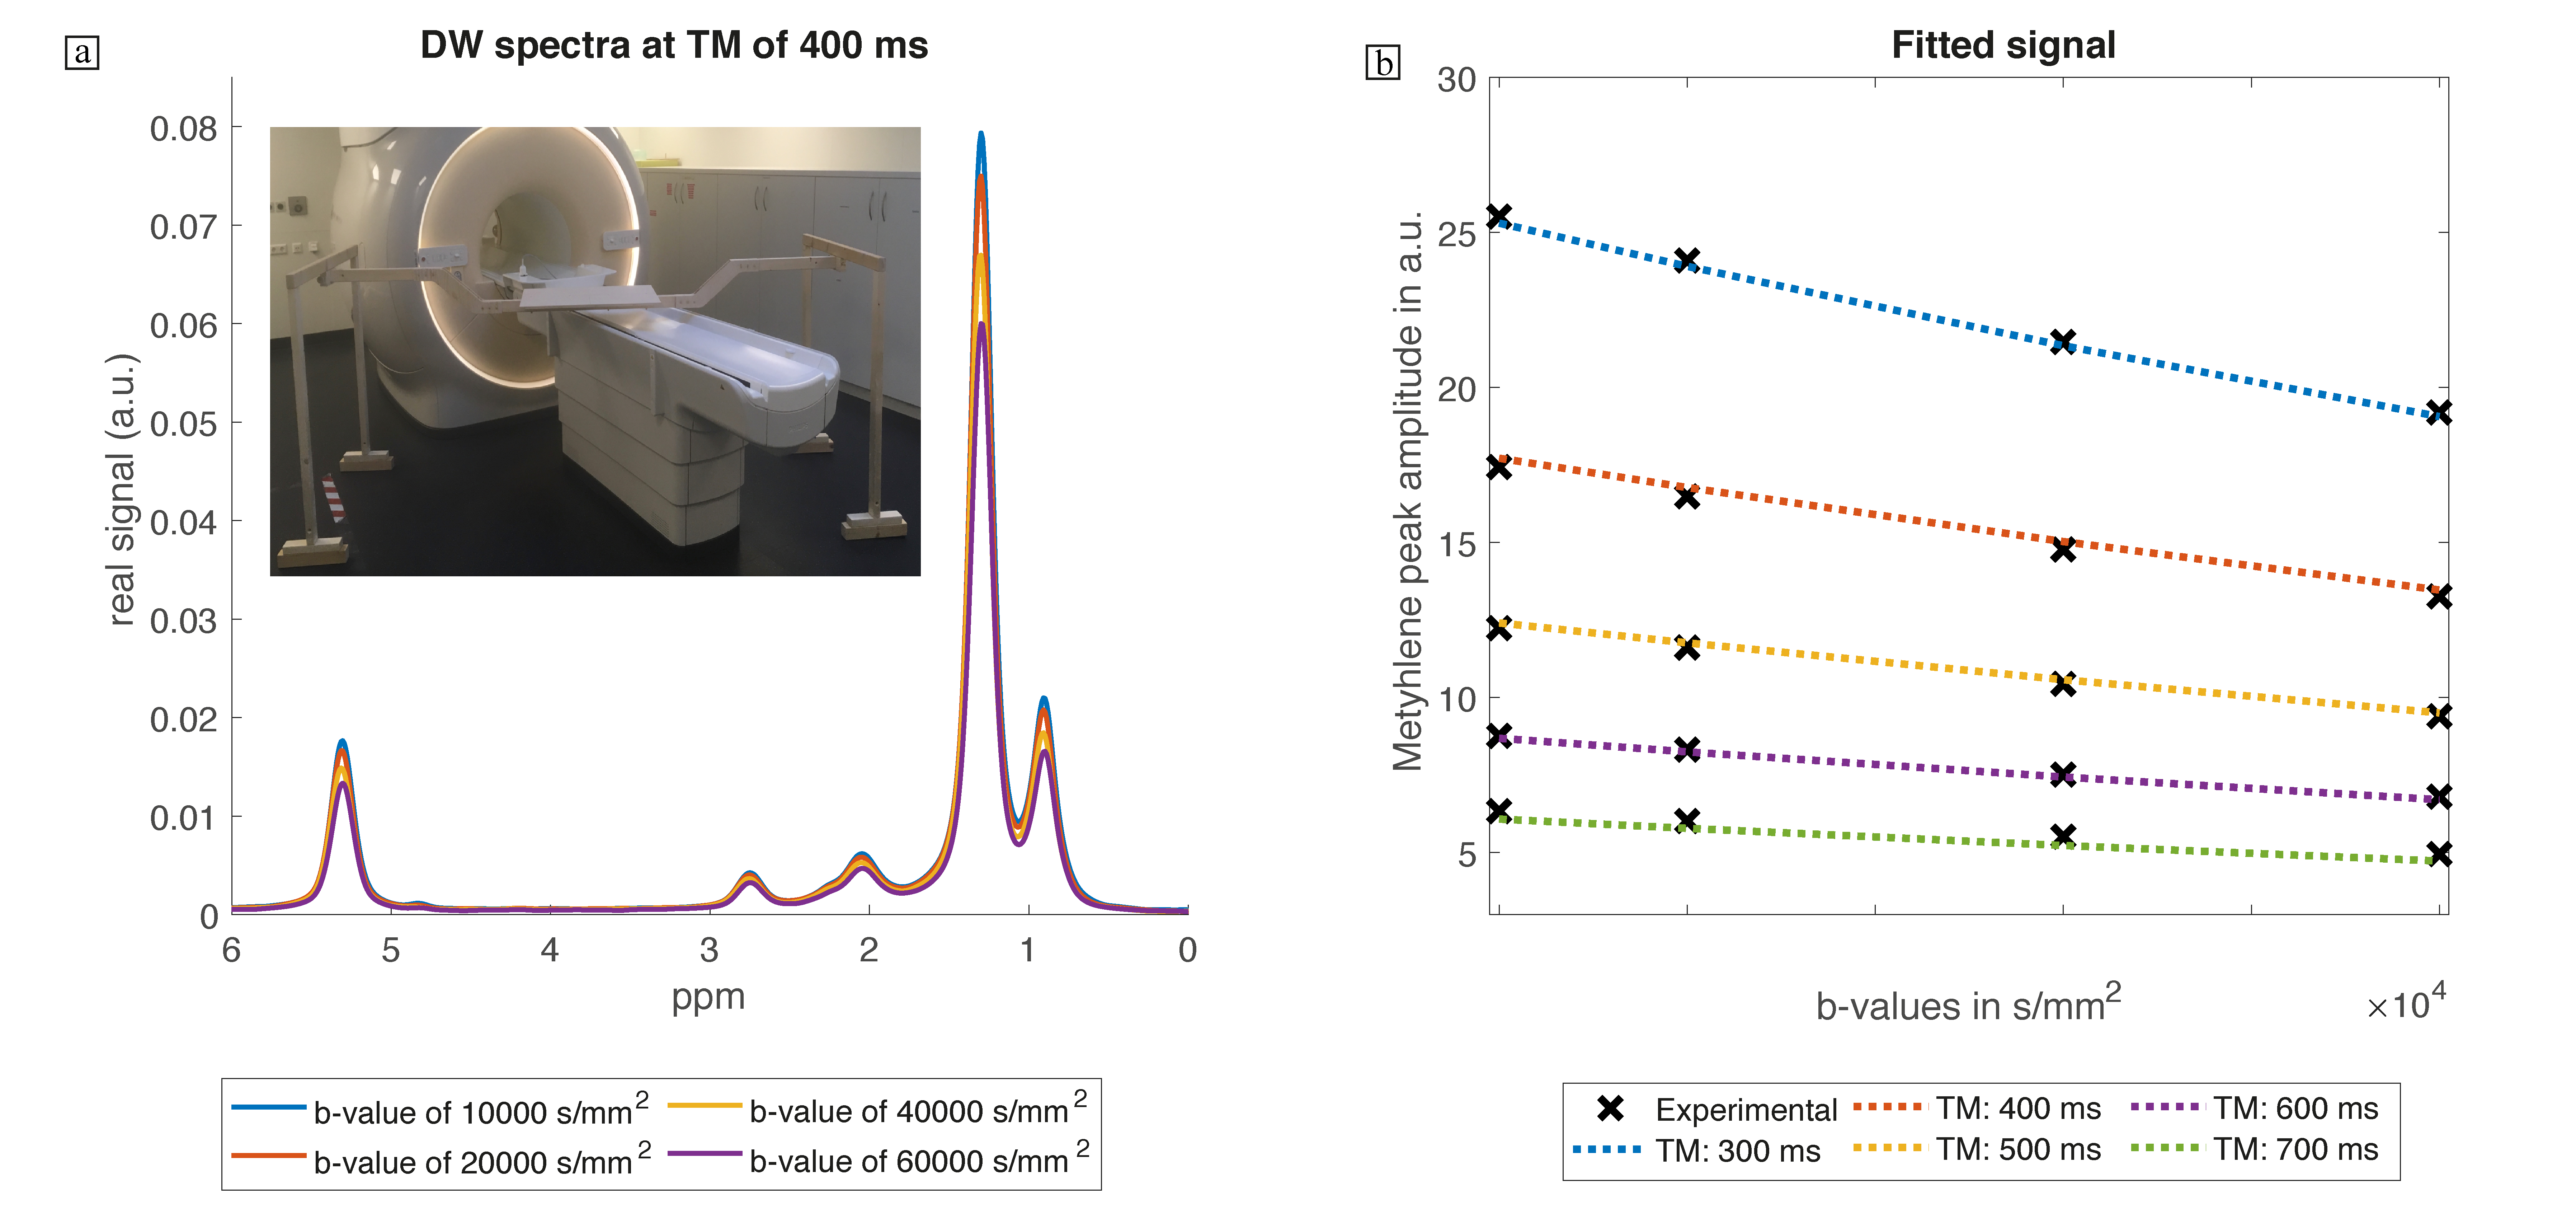
Figure 3:
(a) DW MR spectra that were measured on the wooden support table (insert in subfigure a). (b) fitted methylene peak area signal decay curves measured in the water-fat phantom that was produced with 6000 revolutions per minute. The fitted model is in good agreement with the experimentally obtained values.
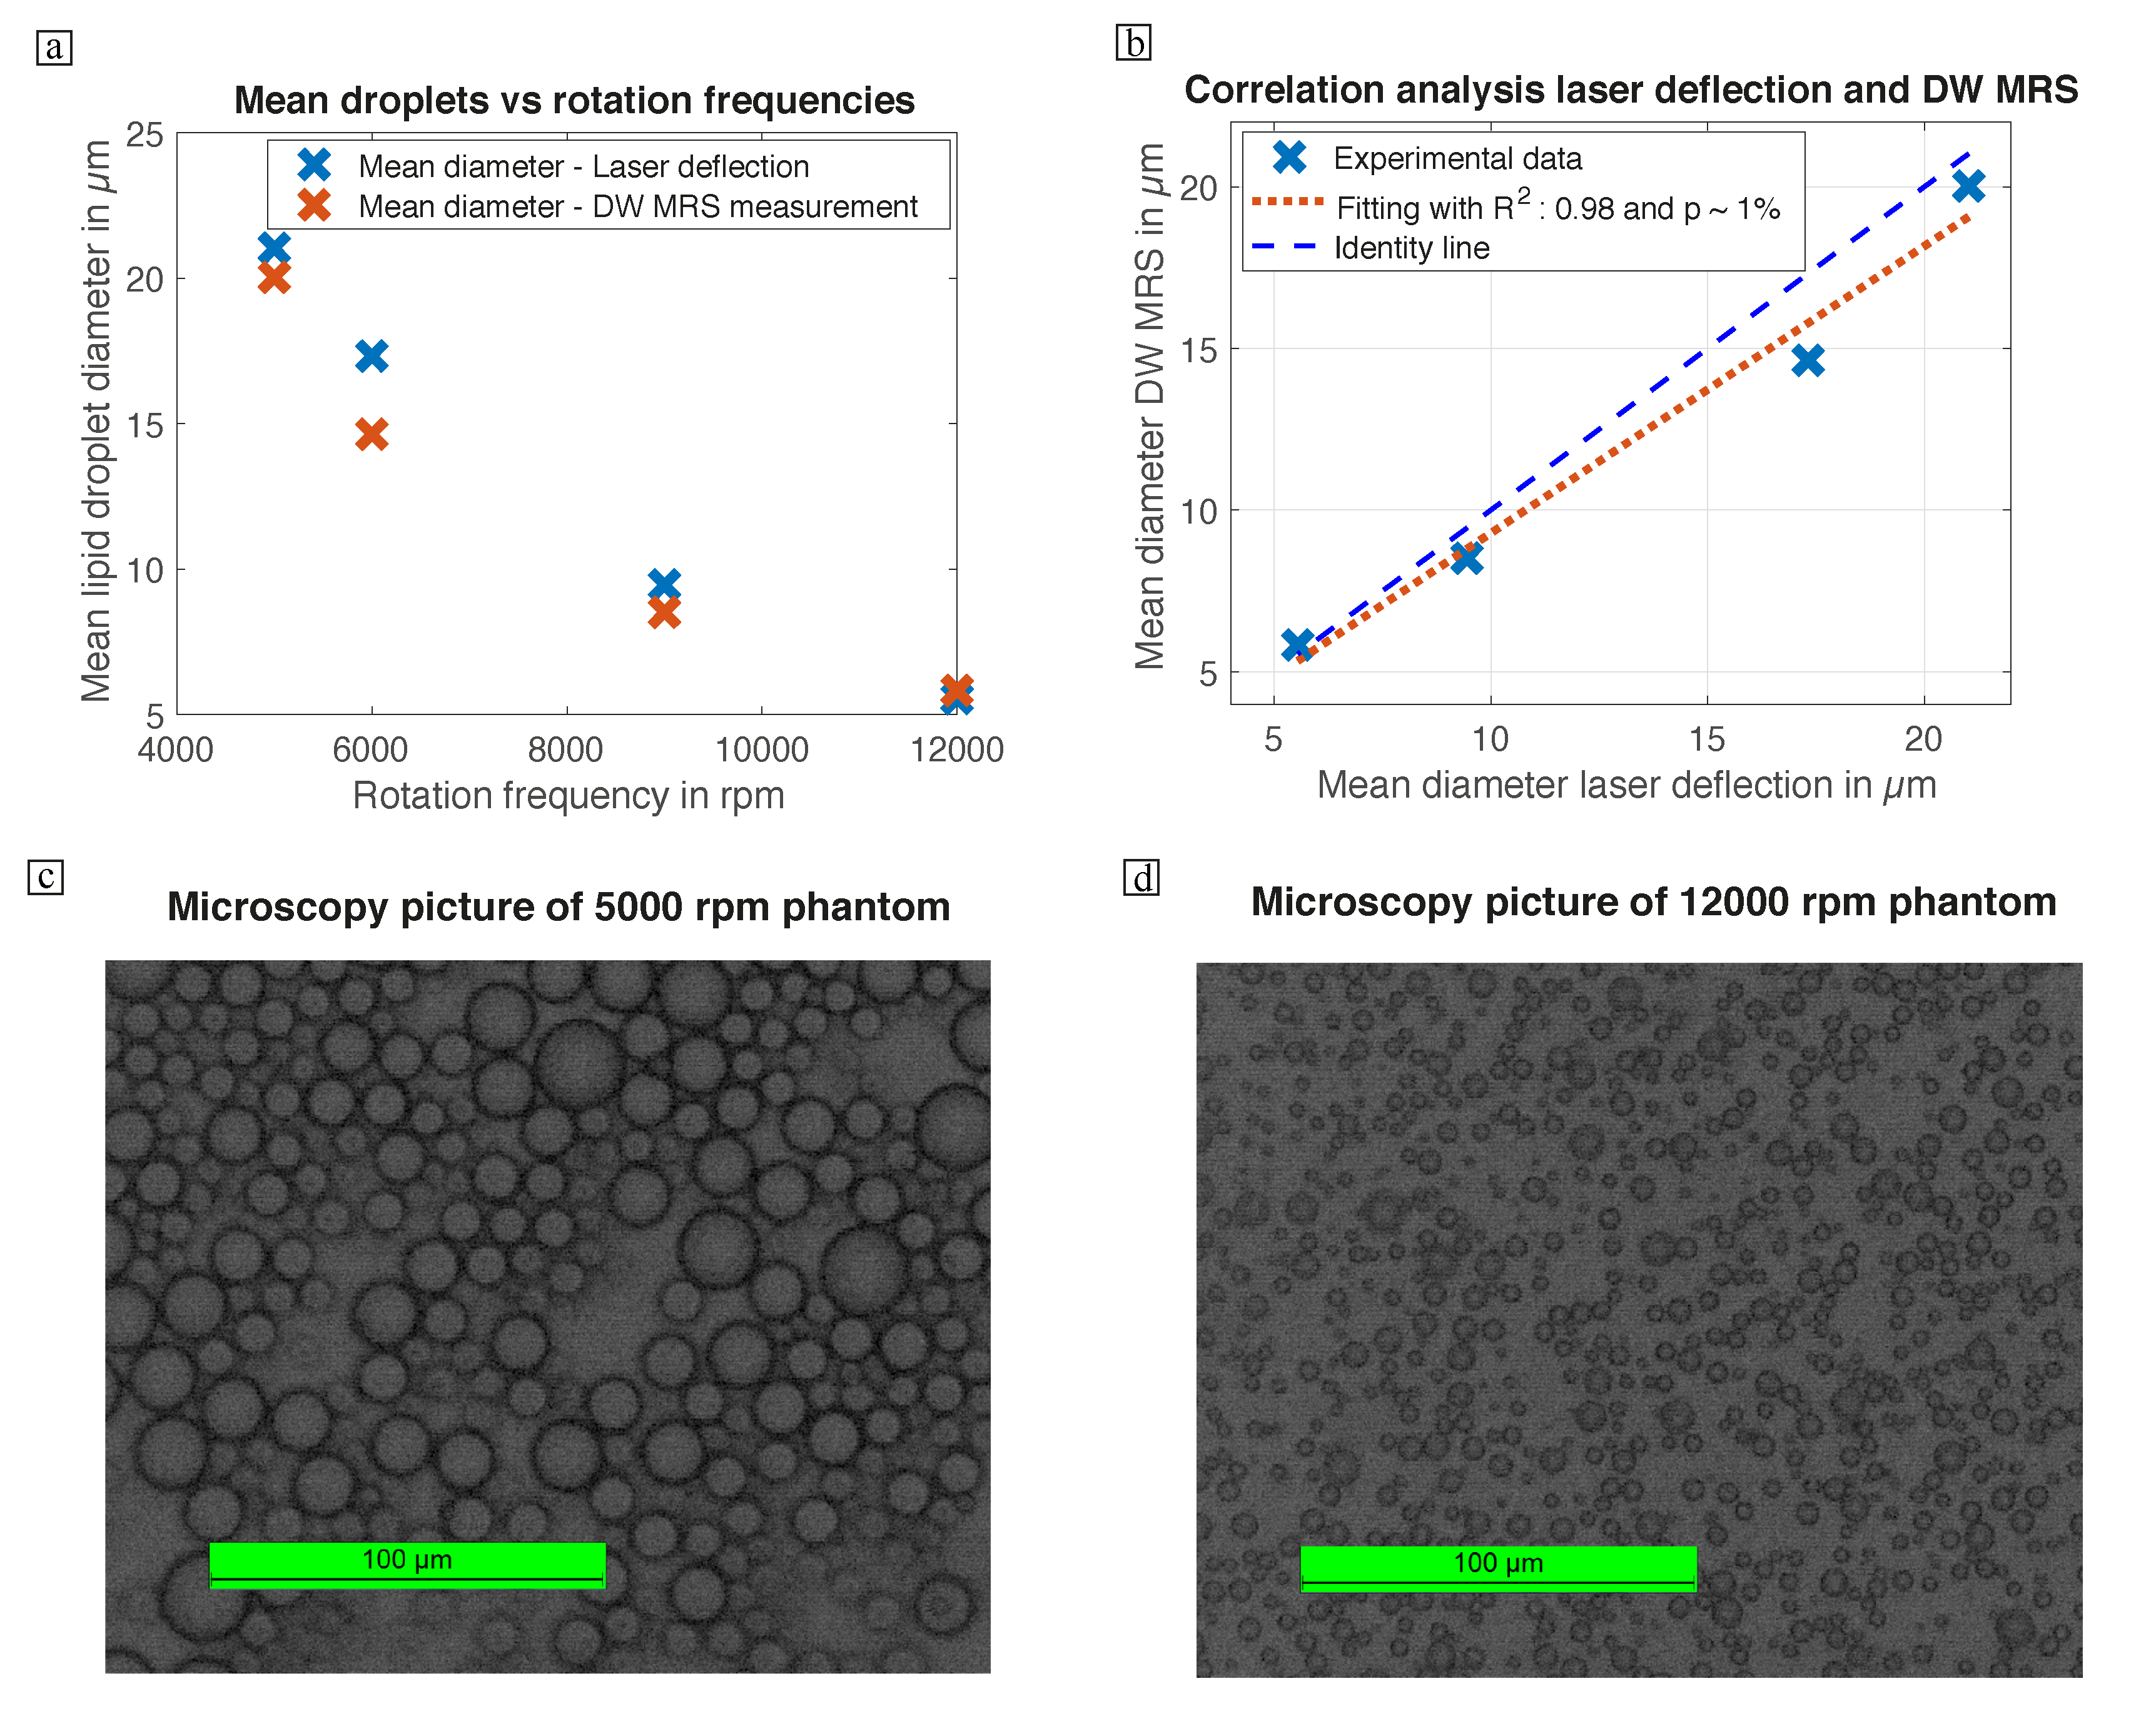
Figure 4:
The mean diameter obtained by DW-MRS and the laser deflection validation measurement (a). (b) shows the correlation analysis of the two measurements. The R2 coefficients are in good agreement between DW-MRS and laser deflection (R2 = 0.98, p=0.01). The bottom row shows an image section of the pictures obtained by microscopy analysis for (c) the 5000 rpm phantom and (d) the 12000 rpm phantom.
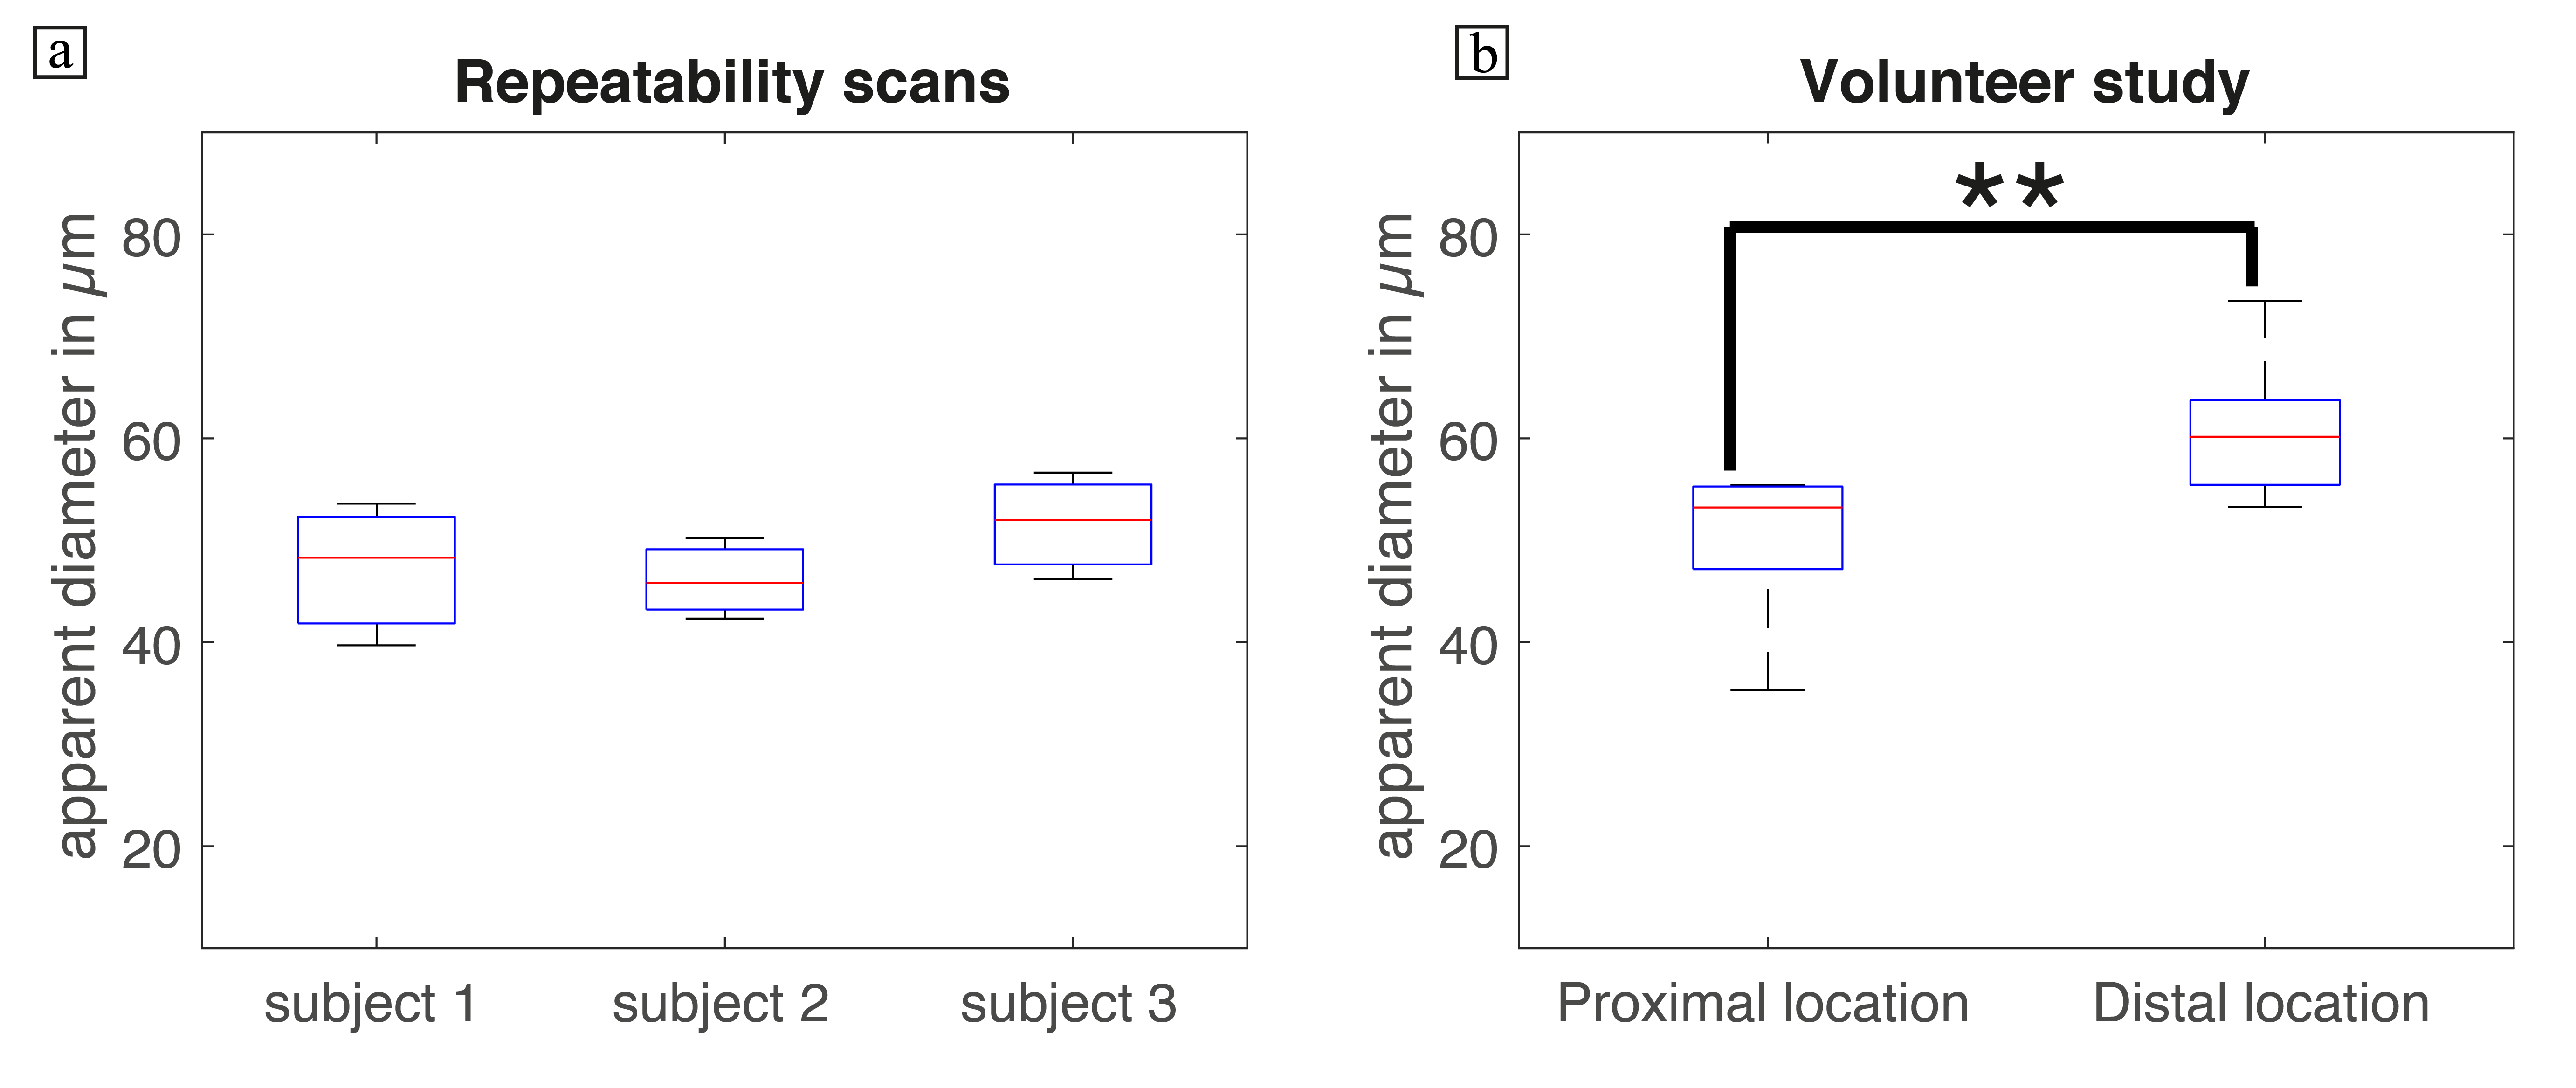
Figure 5:
(a) A summary of the repeatability measurements in the three subjects. The mean adipocyte cell diameter stayed within a relative error of 15% in all cases. The mean diameters measured for the repeatability study were 47.2 ± 7.0 µm, 46.1± 4.0 µm and 51.6 ± 5.2 µm. (b) A boxplot from the volunteer study. For every volunteer, the cell diameter was significantly larger in the distal location (61.1 ± 6.8 µm) compared to the proximal location (50.1 ± 7.3 µm) (p = 0.003).