0370
Evaluation of Sparse Sampling Approaches for 3D Functional MRI1University of Michigan, Ann Arbor, MI, United States
Synopsis
This work evaluates the performance of a novel sampling pattern compared to common undersampling techniques with the ultimate goal of obtaining high spatiotemporal resolution 3D fMRI via sparse sampling and model-based reconstruction. We examine a novel 3D Cartesian sampling pattern with random phase encodings in ky-kz rotated by the golden angle, resulting in a variable density sampling of k-space, with dense sampling of the high-signal energy k-space center. The functional activation and noise amplification (g-factor) results of this sampling technique are compared to those of standard sampling regimes.
Introduction
Some common approaches to fMRI acceleration include parallel imaging techniques such as simultaneous multislice imaging (SMS) that achieves acceleration in the slice dimension1 and sensitivity encoding (SENSE) using multiple receiver coils2. Another approach to improving temporal resolution in fMRI is to undersample 3D k-space during acquisition and then exploit an appropriate model-based image reconstruction3,4. This work proposes a novel approach for efficient, sparse sampling of 3D k-space for fMRI data that maintains high image quality by applying a low-rank plus sparse (L+S) matrix decomposition for image reconstruction, where the L component is a low-rank matrix that models the temporally correlated brain background, and the S component is a sparse representation of noise and functional activity that overlies the brain background5. Validating these undersampling methods and reconstruction techniques for fMRI will enable prospective undersampling, leading to improved temporal resolution and reduced physiological noise aliasing.Methods
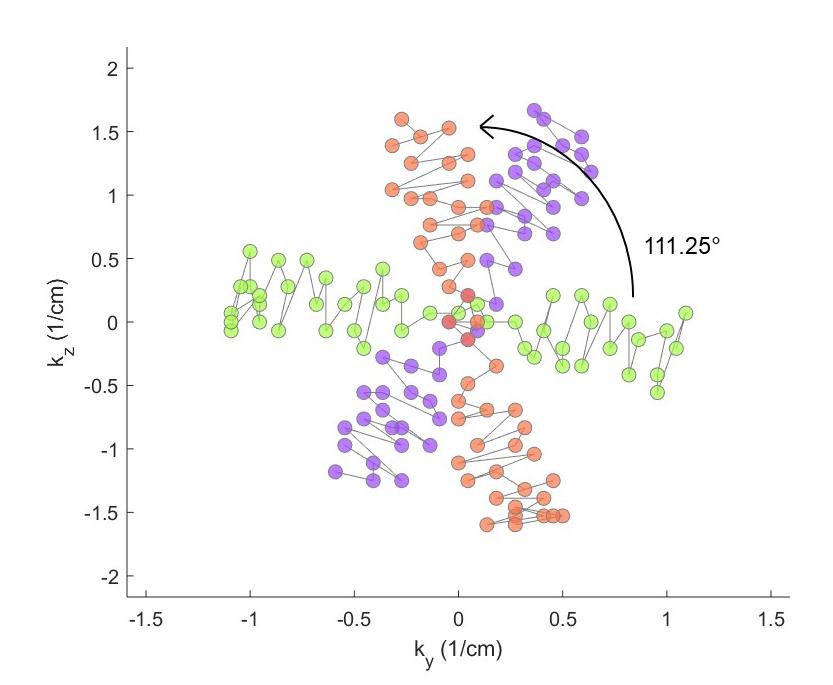
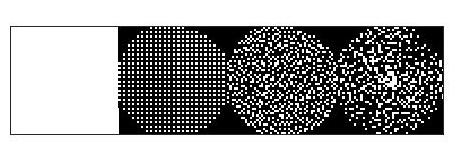
The novel sampling pattern (“Poisson-PROPELLER”), inspired by the PROPELLER pulse sequence6, as well as 3D hybrid radial-Cartesian EPI7, incorporates both Poisson-disk sampling and golden-angle rotation. It consists of multiple “blades” in ky-kz, each containing Poisson-disk samples. For each shot, a new blade is formed with a golden-angle (180/1.618 ∼ 111.25°) update and new Poisson-disk samples, as shown in Figure 1. We included a slew rate constraint to ensure feasibility in prospective implementation. For comparison, we investigated Poisson-disk sampling as well as a uniform R = 2 x 2 undersampling, both with a circular support. The Poisson-disk based sampling methods have different samples for each frame. Figure 2 shows representative examples of these retrospective sampling patterns, all of which are compared to fully sampled results.
3D EPI fMRI data were acquired for a healthy volunteer with a 32-channel receiver (Nova Medical) on a GE 3T MRI scanner, α/TE/TR = 25°/15/37.5 ms, and 3 mm isotropic resolution. The subject performed a visual-motor task. We applied both CG-SENSE reconstruction and L+S model-based reconstruction algorithm to the fully sampled and retrospectively undersampled fMRI data, reconstructing the low-rank (L) and sparse (S) space-time matrices using the following optimization problem:
$$\min_{L,S} \frac{1}{2}||E\left( L+S\right)-d||_{2}^2 + \lambda_{L}||L||_{*} + \lambda_{S}||TS||_{1} ,$$
where E is an encoding operator that includes a phase correction term for N/2 ghosting, d is fully sampled or undersampled k-t data, T is the temporal Fourier transform, and regularization parameters λL and λS determine the relative contributions of data consistency with low-rankness and sparsity5. We solved this problem using the Proximal Optimized Gradient Method8,9. Regularization parameters were chosen to obtain approximately 30% sparsity and rank of 5-6.
We analyzed the reconstructed images for functional activation via correlation with a canonical hemodynamic response function (HRF) convolved with task timing. Correlation maps were overlaid on corresponding structural images. We used Monte Carlo simulation with 100 noise replicas to compute g-factor maps10.
Results
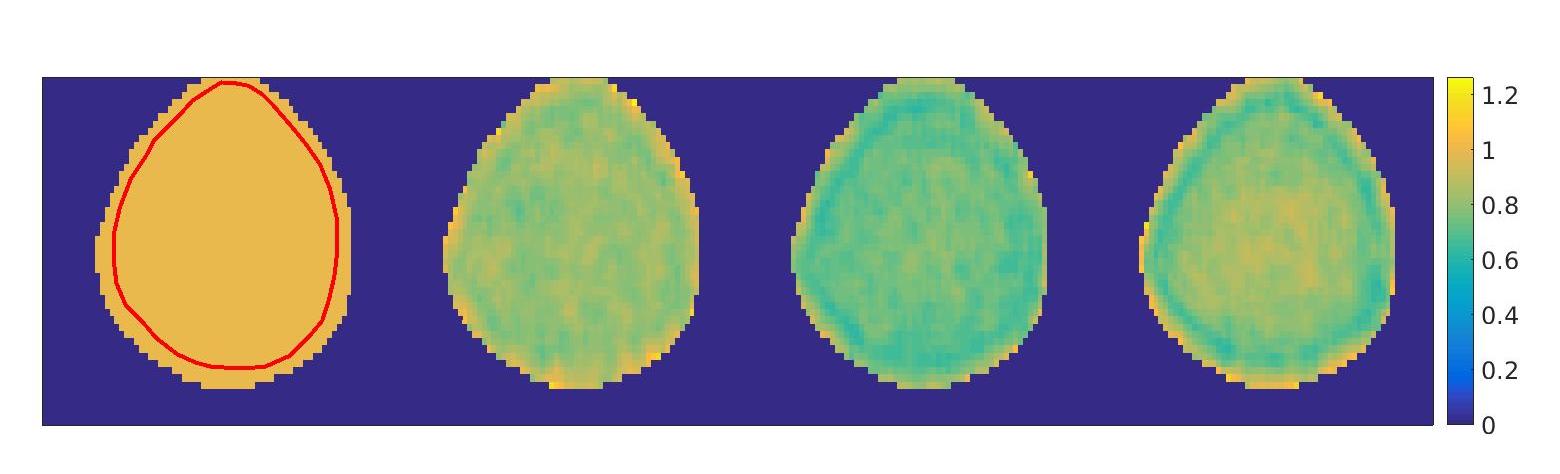
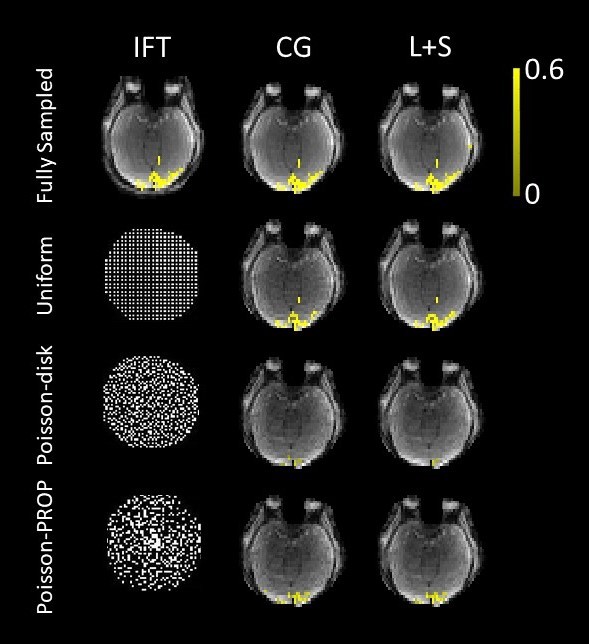
Figure 3 shows g-factor maps for the sampling patterns shown in Figure 2. The g-factor map for the fully sampled case is included as a reference, since, by definition, it has a g-factor of 1. Mean values for an ROI in each g-factor map were calculated as 1.0 (fully sampled), 0.81 (uniform), 0.72 (Poisson-disk), and 0.78 (novel sampling method). Figure 4 shows a slice revealing the activation in the primary visual (V1) cortex.Discussion
The g-factor maps indicate that the novel sampling pattern has reduced noise amplification compared to other sampling regimes of comparable acceleration factor. G-factor <1 is observed, as can be the case with regularized SENSE reconstruction11. Functional activation is observed in all retrospectively sampled cases. While activation is more strongly present in the fully sampled case (i.e., higher correlation and larger region of activation), we are able to resolve a similar ROI in the V1 cortex that is activated during the task. This indicates that the novel sampling approach is feasible for prospective implementation in fMRI. For example, implemented prospectively, this sampling pattern can achieve a temporal resolution of 300 ms with 8 shots, 37.8 ms TR, isotropic spatial resolution of 3 mm, and a net acceleration of R = 5.Conclusion
This work demonstrates a novel 3D k-space sampling pattern that is feasible for prospective acceleration in fMRI. Future work aims to achieve high temporal resolution trajectories by using these sampling techniques prospectively. Other future work will include modeling and compensation for physiological noise, as well as motion correction.Acknowledgements
We wish to acknowledge the support of NIH Grants R01EB023618 and U01EB026977.References
1. Barth M, Breuer F, Koopmans PJ, Norris DG, Poser BA. Simultaneous multislice (SMS) imaging techniques. Magn Reson Med. 2016;75: 63-81.
2. Pruessmann KP, Weiger M, Scheidegger MB, Boesiger P. SENSE: Sensitivity encoding for fast MRI. Magn Reson Med. 1999;42: 952-962.
3. Lustig M, Donoho D, Pauly JM. Sparse MRI: The application of compressed sensing for rapid MR imaging. Magn Reson Med. 2007;58: 1182–1195.
4. Chiew M, Smith SM, Koopmans PJ, Graedel NN, Blumensath T, Miller KL. k-t FASTER: Acceleration of functional MRI data acquisition using low rank constraints. Magn Reson Med. 2015;74: 353–364.
5. Otazo R, Candès E, Sodickson DK. Low-rank plus sparse matrix decomposition for accelerated dynamic MRI with separation of background and dynamic components. Magn Reson Med. 2015;73:1125–1136.
6. Pipe JG. Motion correction with PROPELLER MRI: Application to head motion and free‐breathing cardiac imaging. Magn Reson Med. 1999;42: 963-969.
7. Graedel NN, McNab JA, Chiew M, Miller KL. Motion correction for functional MRI with three‐dimensional hybrid radial‐Cartesian EPI. Magn Reson Med. 2017;78: 527-540.
8. Taylor AB, Hendrickx JM, Glineur F. Exact worst-case performance of first-order methods for composite convex optimization. SIAM Journal on Optimization. 2017;27:1283–1313.
9. Lin CY, Fessler JA. Accelerated Methods for Low-Rank Plus Sparse Image Reconstruction. IEEE International Symposium on Biomedical Imaging. 2017.
10. Robson PM, Grant AK, Madhuranthakam AJ, Lattanzi R, Sodickson DK, McKenzie CA. Comprehensive quantification of signal-to-noise ratio and g-factor for image-based and k-space-based parallel imaging reconstructions. Magn Reson Med. 2008;60(4):895–907.
11. Lin F, Kwong KK, Belliveau JW, Wald LL. Parallel imaging reconstruction using automatic regularization. Magn Reson Med. 2004;51:559-567.
Figures