0368
Comparison of SMS-EPI versus 3D-EPI in an fMRI localizer study at HCP-style resolution and TR, using parallel transmission Universal Pulses at 7T1Neurospin, CEA, Université Paris-Saclay, Gif-sur-Yvette, France, 2Siemens Healthineers, Saint-Denis, France, 3Neurospin, CEA, Université Paris-Saclay, INSERM, Gif-sur-Yvette, France, 4German Center for neurodegenerative diseases (DZNE), Bonn, Germany, 5Department of Cognitive Neuroscience, Faculty of Psychology and Neuroscience, Maastricht University, Maastricht, Netherlands, 6Collège de France, Paris, France
Synopsis
Simultaneous-Multi-Slice (SMS) and 3D-EPI sequences with parallel-transmit B1 homogenization by means of calibration-free Universal Pulses were evaluated at 7T and at HCP-style resolution and repetition time (1.6mm iso, TR=1120ms). Comparison was based on sensitivity and specificity of activation detection in a multi-modal functional localizer task paradigm. When including nuisance regressors in the analysis, the SMS-EPI shows superior sensitivity but lower specificity than the 3D-EPI, with overall comparable performance when weighting the two metrics equally, but with significantly smaller SAR demands and sound pressure levels for the 3D-EPI.
Introduction
Previous comparisons of SMS-EPI1 and 3D-EPI2 sequences for BOLD fMRI at 7T have shown a higher sensitivity of 3D-EPI to physiological noise3-5. This translates into reduced tSNR performance and BOLD sensitivity when physiological noise is not corrected for, but a superior performance of 3D-EPI is seen when appropriate physiological noise correction is performed. The aim of the current study was to compare the activation patterns and strength elicited by an fMRI localizer paradigm6 with different task components, for SMS-EPI and 3D-EPI sequences at 7T with matched TRs and resolutions, and both employing parallel transmission Universal Pulses7 to restablish homogeneous excitation. The localizer paradigm was previously applied at 3T in a large-scale study6 (N=94) and the results of that study could be used as a prediction of the brain areas activated by each stimulus contrast.Methods
Acquisitions were performed on 5 volunteers (26±8 years, 3 females) on a Magnetom 7T scanner (Siemens Healthineers, Erlangen, Germany) equipped with the Nova (Nova Medical, Wilmington, MA, USA) 8Tx-32Rx head coil. For each volunteer, an anatomical sequence alongside the SMS-EPI and 3D-EPI sequences were acquired. Cardiac pulsation and respiration were recorded during the functional scans.
Imaging parameters of the SMS-EPI were: TR/TE 1120/22ms, 1.6 mm isotropic resolution, 90 axial slices, FOV 208 mm, PF =7/8, GRAPPA=2, BW=2024 Hz/pixel, MB=5, flip angle (FA) 55°, fat saturation, 280 volumes, CAIPI shift=FOV/3. The same parameters were used for 3D-EPI except for GRAPPA=2x4 (without CAIPI shift), sagittal slice orientation and FA = 12° (FA were chosen to be the Ernst angle for gray matter in each case). Universal Pulses were designed for both sequences under local SAR constraints with VOPs8. For the SMS-EPI, pulses were designed with two spokes9,10. For the 3D-EPI, the pulse was designed as a water-selective pulse11 with three kt-points12, thus sparing a SAR and time-consuming fat suppression pulse while enabling a lower partition/slice acceleration factor 4 (versus MB=5 in the SMS-EPI). The cost function to minimize was the FA normalized root-mean-square error (NRMSE) averaged over a database of 20 field maps acquired in a prior study13 to promote robustness against intersubject variability. No pTx calibration was performed during the exams. The acoustic noise level was measured prior to in-vivo exams with a sound pressure meter placed at a location equivalent to the right ear of the volunteers.
The sequences were compared using a functional fast-event-related paradigm of 5min 20s including several auditory and visual stimulations: motor instructions (right or left hand button press), flashing checkerboards, mental calculation and language comprehension. Preprocessing with SPM12 and FSL included slice timing (SMS-EPI), realignment, distortion correction and normalization on the 2 mm MNI template. Univariate activation maps were computed for each contrast with the General Linear Model (GLM). The analysis was performed twice, without and with nuisance regressors (motion and physiology)14,15 included in the GLM. A p-value of 0.001, uncorrected for multiple comparisons, was chosen as the significance threshold for the detection of activated voxels6.
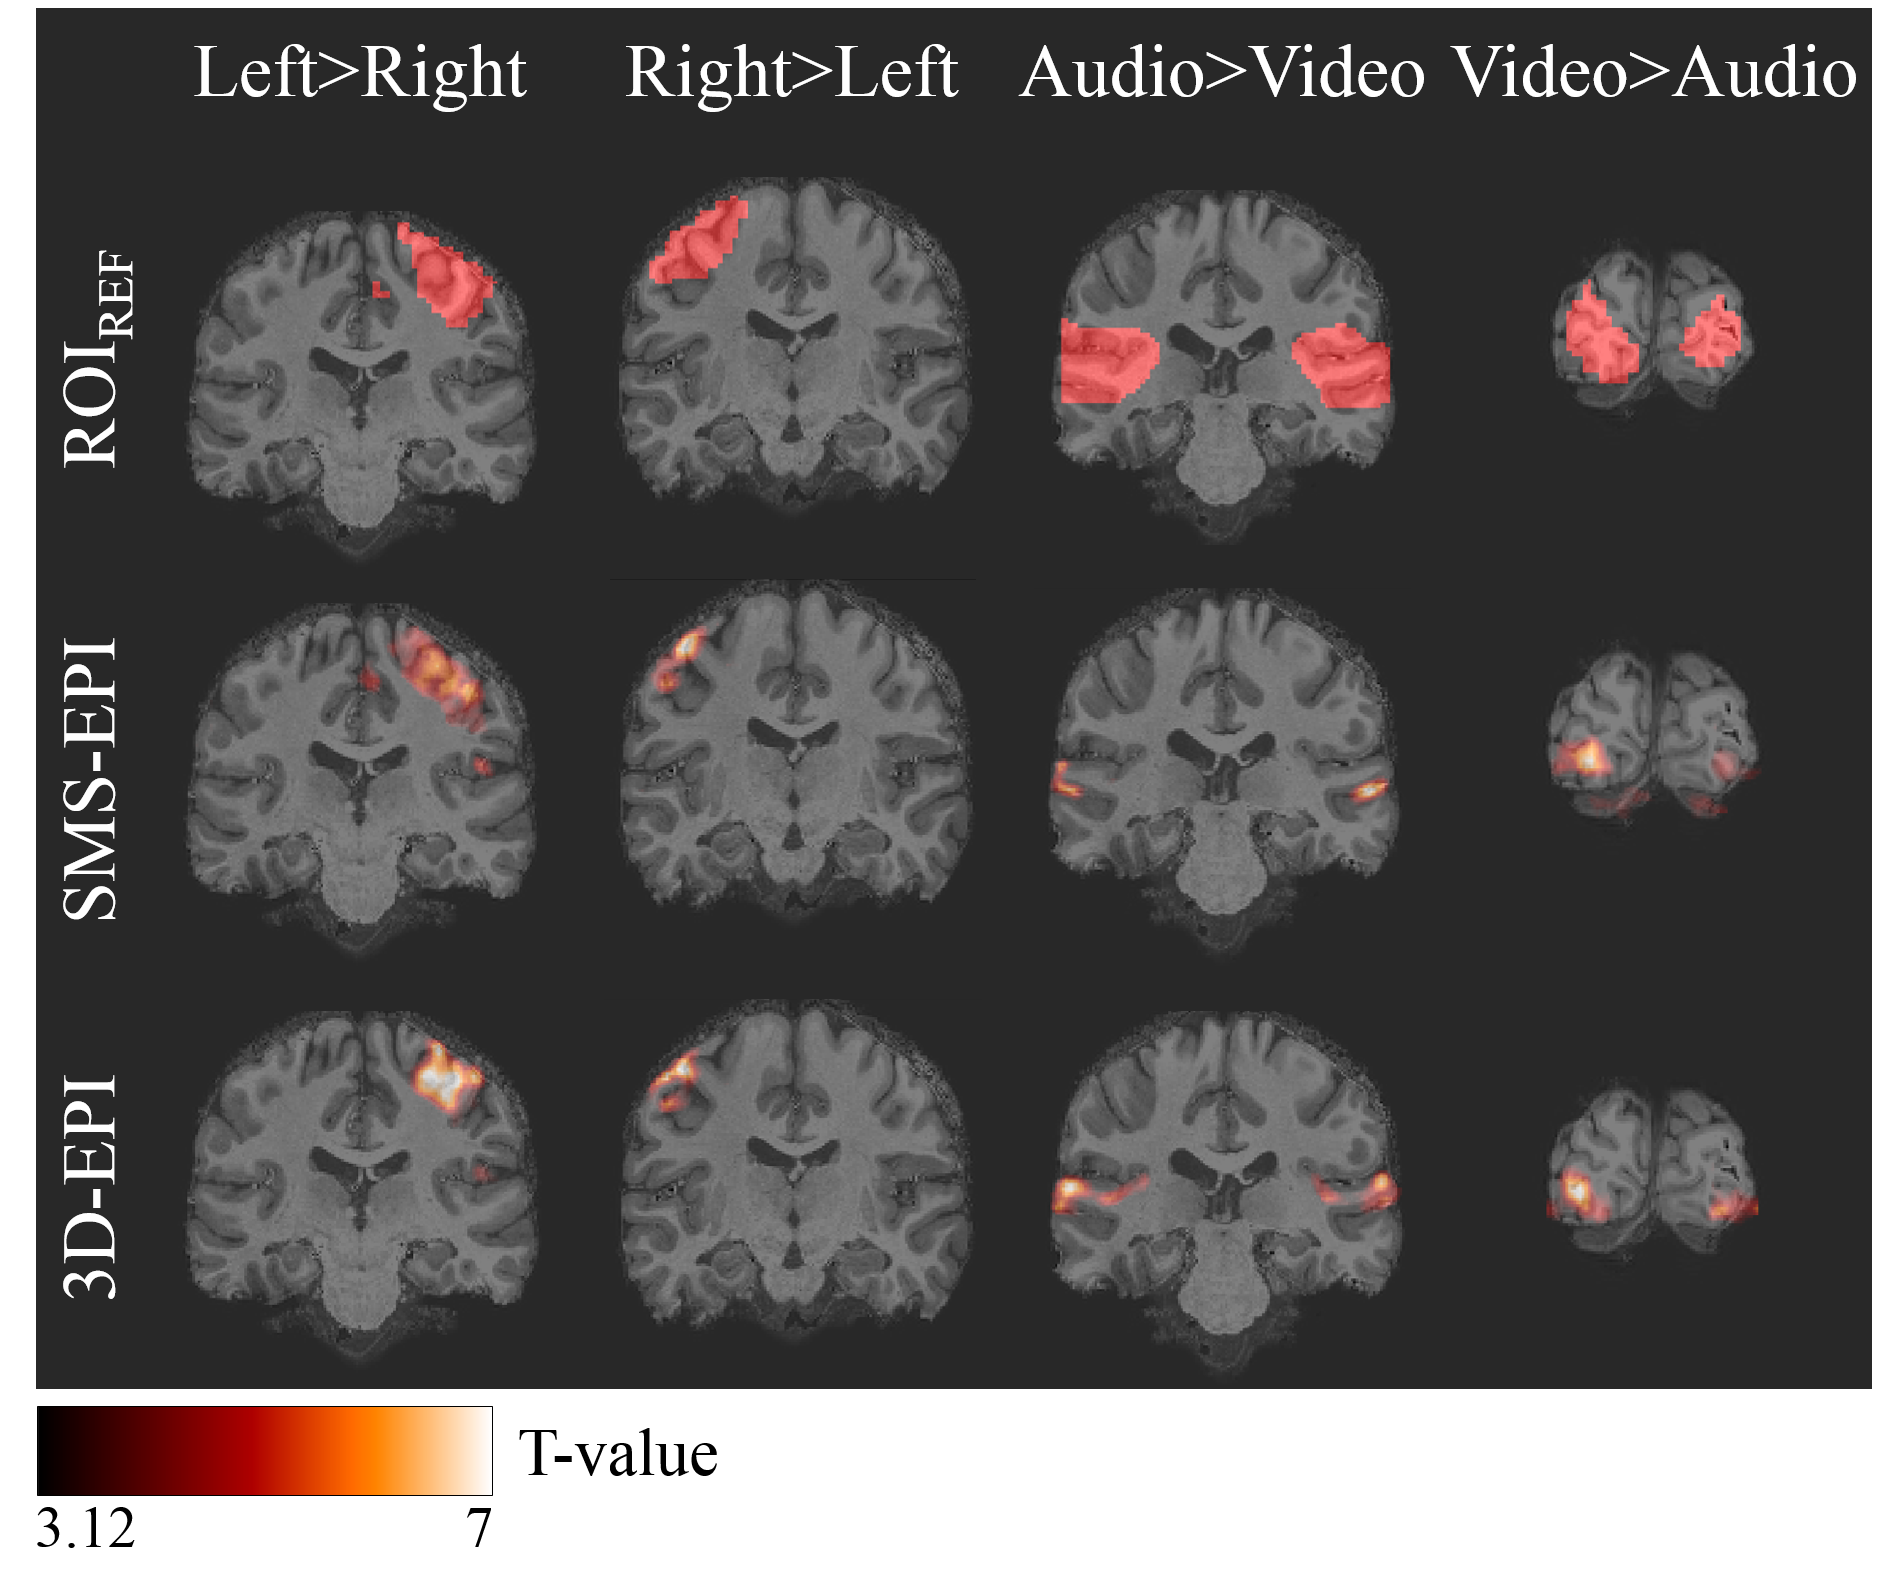
The accuracy of activation detection was assessed by comparison with the activation ROIs obtained in a reference study at 3T6 (ROIref) for the four main contrasts, resulting from the auditory, visual and motor stimuli. The two sequences were evaluated according to their sensitivity ($$$= \frac{Nb~activated~voxels~in~ROI_{ref}}{Nb~voxels~in~ROI_{ref}} $$$) and specificity ($$$= 1 - \frac{Nb~activated~voxels~outside~ROI_{ref}}{Nb~voxels~outside~ROI_{ref}}$$$). Following signal detection theory16, we computed the d’ scores ($$$= \textbf{Z}(sensitivity)-\textbf{Z}(1-specificity)$$$) of these sequences to combine sensitivity and specificity, Z being the inverse of the cumulative normal distribution function.
Results
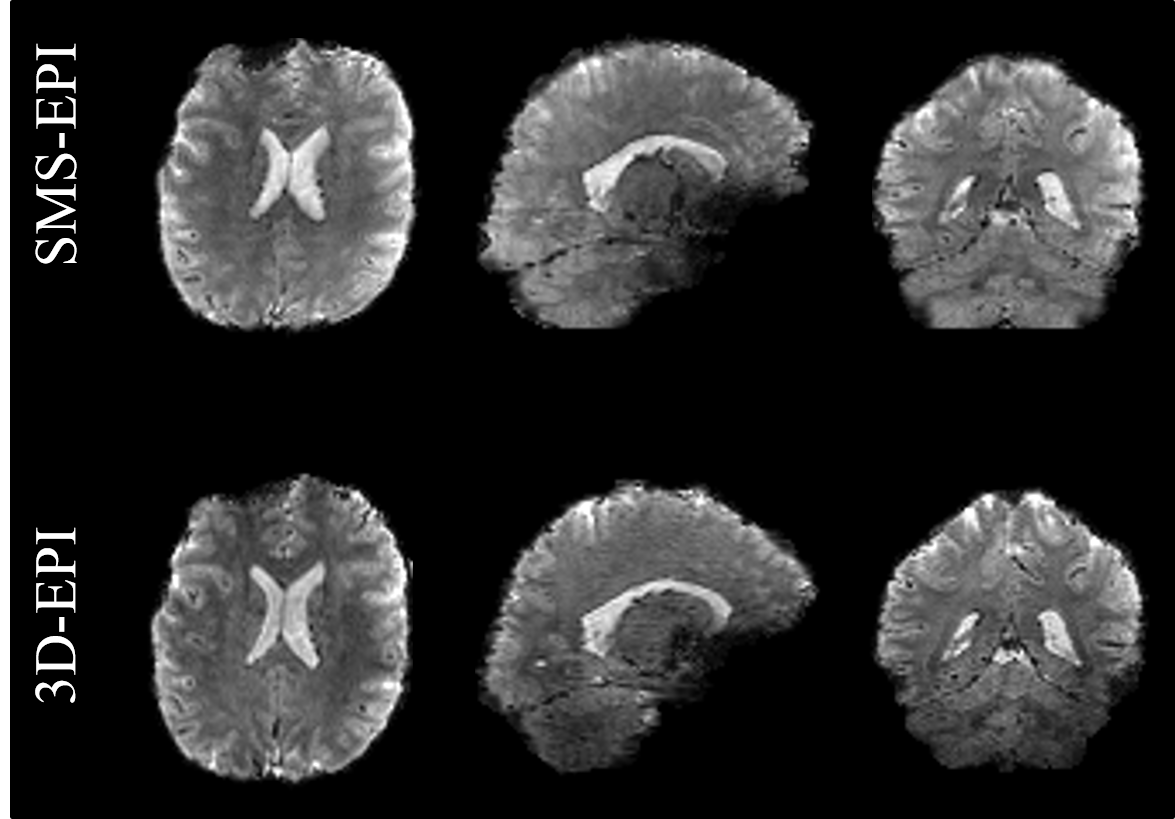
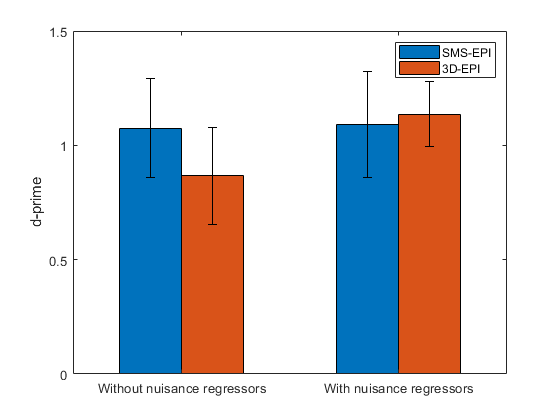
Very good homogeneity was obtained with the universal pulses for both sequences (6.6% versus 7.4% in FA for the SMS-EPI and the 3D-EPI according to Bloch simulations). In-vivo images are provided in Figure 1. Returned peak 10-g SAR was 9.98 W/kg and 0.28 W/kg for the SMS-EPI and the 3D-EPI respectively, saturating in the former case the normal mode IEC guidelines. Average sound pressure level was 10 dB higher for the SMS-EPI. The SMS-EPI showed a trend of higher sensitivity but a lower specificity compared to the 3D-EPI (Figure 2). d’ was higher for the SMS-EPI compared to the 3D-EPI when the nuisance regressors were not included in the GLM model. However, once the nuisance regressors were included, 3D-EPI slightly outperformed SMS-EPI (Figure 3).Discussion-Conclusion
The SMS-EPI and 3D-EPI sequences showed similar performance at 7T for detecting auditory, visual and motor stimuli for a resolution and TR highly similar to the resting-state HCP protocol17. The 3D-EPI also benefits from a lower energy deposition, lower acoustic noise and improved immunity to B1+ inhomogeneity in single channel CP-mode. Future work includes incorporating CAIPIRINHA capability18 in the 3D-EPI sequence.
Acknowledgements
The research leading to these results has received funding from the European Research Council under the European Union’s Seventh Framework Program (FP7/2013-2018), ERC Grant Agreement n. 309674, and from the ERPT equipment program of the Leducq Foundation.References
1. Setsompop K, Gagoski BA, Polimeni JR et al. Blipped-controlled aliasing in parallel imaging for simultaneous multislice echo planar imaging with reduced g-factor penalty. Magn Reson Med. 2012;67:1210-1224.
2. Poser BA, Koopmans PJ, Witzel T, et al. Three-dimensional echo-planar imaging at 7 Tesla. Neuroimage. 2010;51:261-266.
3. Jorge J, Figueiredo P, van der Zwaag W and Marques JP. Signal fluctuations in fMRI data acquired with 2D-EPI and 3D-EPI at 7 Tesla. Magn Reson Imag. 2013;31:212-220.
4. Van der Zwaag W, Marques JP, Kober T, et al. Temporal SNR characteristics in segmented 3D-EPI at 7T. Magn Reson Med. 2011;67:344-352.
5. Reynaud O, Jorge J, Gruetter R, et al. Influence of physiological noise on accelerated 2D and 3D resting state functional MRI data at 7T. Magn Reson Med. 2017;78:888-896.
6. Pinel P, Thirion B, Meriaux S, et al. Fast reproducible identification and large-scale databasing of individual function cognitive networks. BMC Neuroscience. 2007;8(1):91.
7. Gras V, Vignaud A, Amadon A, et al. Universal Pulses: a new concept for calibration-free parallel transmission. Magn Reson Med. 2016;77:635-643.
8. Eichfelder G and Gebhardt M. Local specific absorption rate control for parallel transmission by virtual observation points. Magn Reson Med. 2011;66:1468-1476.
9. Saekho S, Yip C, Noll DC, et al. Fast-kz three-dimensional tailored radiofrequency pulse for reduced B1 inhomogeneity. Magn Reson Med. 2006;55:719-724.
10. Gras V, Vignaud A, Amadon A, et al. In vivo demonstration of whole-brain multislice multispoke parallel transmit radiofrequency pulse design in the small and large flip angle regimes at 7 Tesla. Magn Reson Med. 2016;78:1009-1019.
11. Stirnberg R, Brenner D, Stöcker T and Shah NJ. Rapid fat suppression for three‐dimensional echo planar imaging with minimized specific absorption rate. Magn Reson Med. 2016;76:1517-1523.
12. Cloos MA, Boulant N, Luong M, et al. kT-points: short three-dimensional tailored RF pulses for flip-angle homogenization over an extended volume. Magn Reson Med. 2012;67:72-80.
13. Gras V, Boland M, Vignaud A, et al. Homogeneous non-selective and slice-selective parallel-transmit excitations at 7 Tesla with universal pulses: A validation study on two commercial RF coils. PloS one. 2017;12:e0183562.
14. Glover GH, Li TQ, Ress D. Image-based method for retrospective correction of physiological motion effects in fMRI. Magn Reson Med. 2000;44:162-167.
15. Jones TB, Bandettini PA, Birn RM. Integration of motion correction and physiological noise regression in fMRI. NeuroImage. 2008;42:582-590.
16. Macmillan NA and Creelman CD. Detection theory: A user's guide. Psychology press. 2004.
17. Ugurbil K, Xu J, Auerbach EJ, et al. Pushing spatial and temporal resolution for functional and diffusion MRI in the Human Connectome Project. Neuroimage. 2013;80:80-104.
18. Narsude M, Gallichan D, van der Zwaag W, et al. Three‐dimensional echo planar imaging with controlled aliasing: A sequence for high temporal resolution functional MRI. Magn Reson Med. 2016;75:2350-2361.
Figures