0366
Measuring layer-dependent CBV fMRI in the visual system1NIH, Bethesda, MD, United States, 2IBS Center, Sungkyunkwan, Korea, Republic of, 3MBIC, Maastricht University, Maastricht, Netherlands, 4MGH, Boston, MA, United States
Synopsis
With recent developments of ultra-high field MRI and high-resolution CBV-sensitive VASO sequences, it became possible to measure activity changes across cortical depths in brain areas of large cortical thicknesses (4mm in M1). Applications of layer-dependent CBV-fMRI in the visual cortex, however, have been complicated by long arterial-arrival-times, coverage requirements, and lower cortical thickness (1.9mm). Here, we developed new sequence setups for layer-dependent acquisition of CBV changes during tasks and resting-state. We find that the proposed large-coverage VASO protocols with 0.8mm (iso) resolutions can pinpoint feedforward and feedback input into V1 from LGN and V5 during tasks and resting-state.
Purpose
Layer-specific fMRI can address questions on directional feedforward and feedback information flow between brain areas. Since the venous vessels are not as laminar aligned like the neurons are, the conventional GE-BOLD contrast is biased toward superficial layers [Polimeni 2010a; Kay 2018]. Other contrast, such as the CBV specific VASO contrast [Lu 2003] are thought to be more specific, while being less sensitive. Previously, layer-dependent VASO could be applied in 4 mm thick primary motor cortex [Huber 2017]. However, layer-dependent VASO in human V1 is hampered by the thin cortical thickness, longer arterial arrival times [Mildner 2013], unpredictable cortical folding, and less efficient coverage. The purpose of this study is to develop a new sequence setup to allow robust layer-dependent functional imaging in the human visual system with isotropic resolutions and large coverage to infer layer-dependent information flow. The novel methodology is tested on a previously proposed paradigm [Polimeni 2010b] of known feedforward and feedback connections between Thalamus (LGN), V1 and V5/MT.Methods
15-min acquisitions were conducted during tasks and resting-state fMRI with N=6 participants (approved by the IRB of NIH (Bethesda)). Functional tasks consisted of 30s rest vs. 30s of visually presented moving and static stars. Functional data of GE-BOLD and cerebral blood volume (CBV) were simultaneously acquired with SS-SI-VASO [Huber 2014]. fMRI sequence parameters were: in-plane resolution 0.79 mm, slice-thickness: 0.79 mm (N=4) – 1 mm (N=2). TE=25ms, 22-26 slices with additional 2 slices oversampling, pair-TR=5s, PF=6/8 with POCS #8, FLASH-GAPPA=3, 3D-EPI readout [Poser 2010], 7T (Siemens Healthineers), 32-ch NOVA coil, SC72 body gradient. Cardiac and respiratory traces were recorded for RETROICOR. To achieve the unprecedented VASO coverage of 22% of the whole brain with isotropic submillimeter resolution, two strategies were employed:
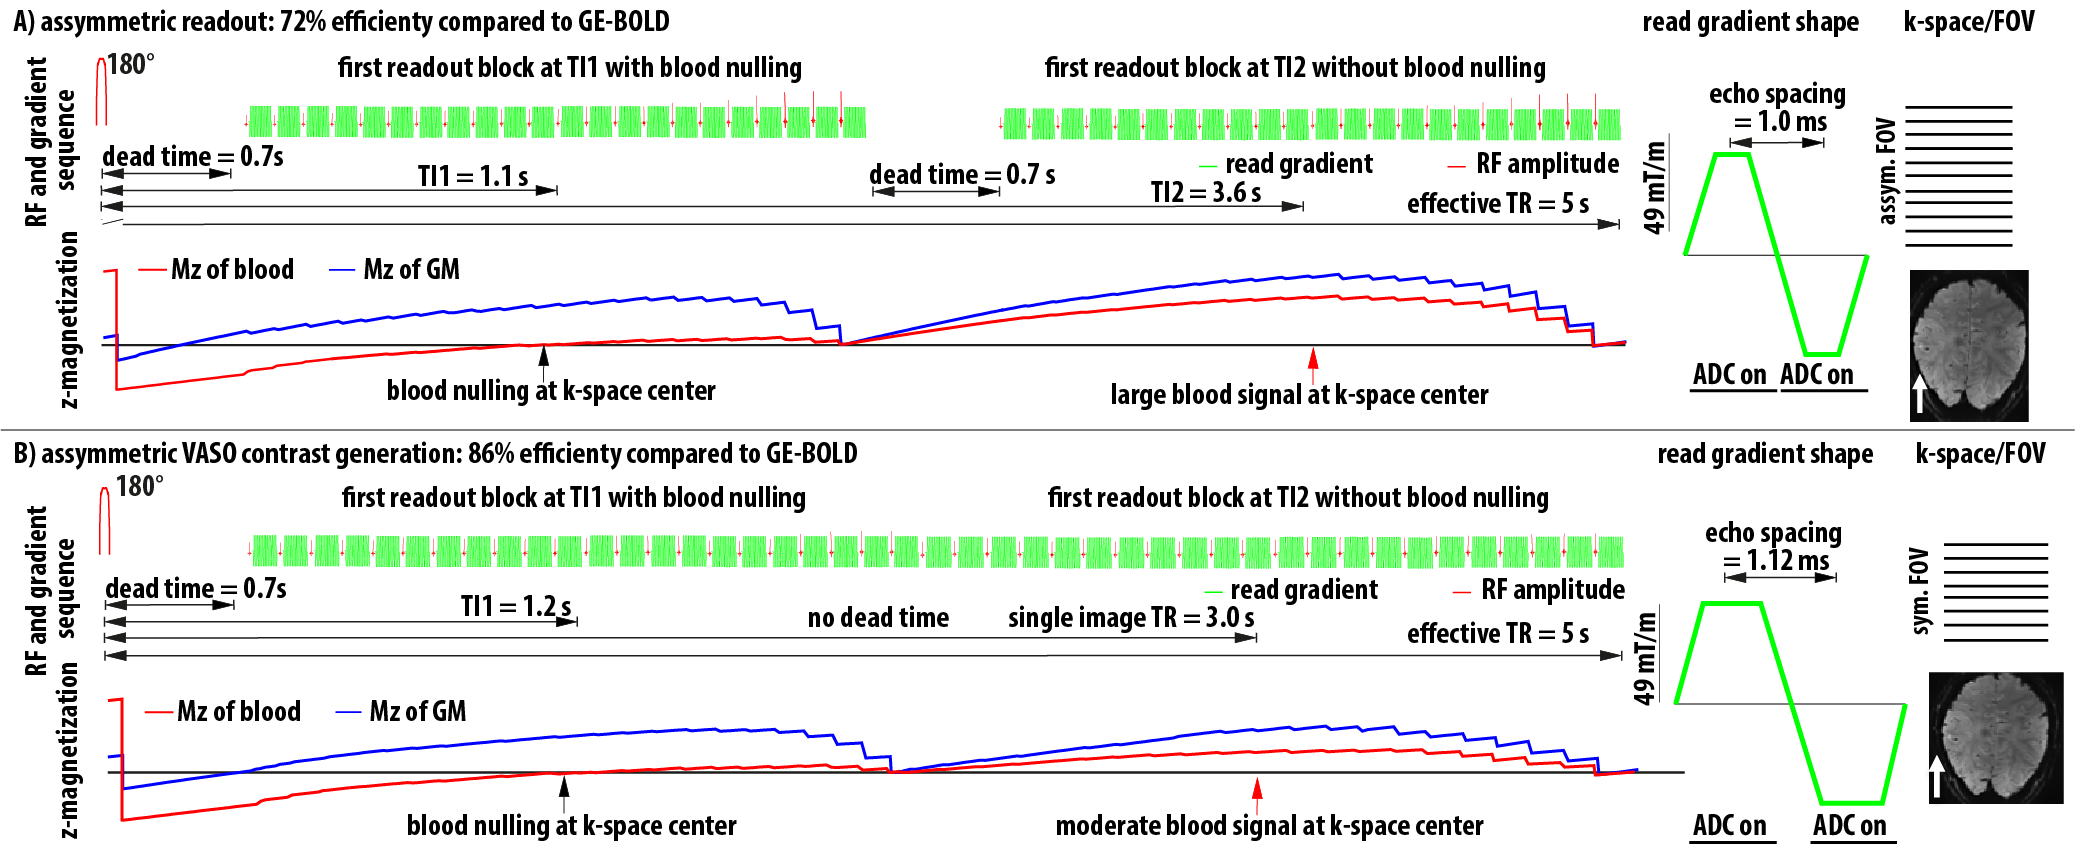
- VASO acquisition efficiency was increased by enforcing larger ramp sampling factors with asymmetric FOVs (Fig. 1A). This allows more efficient imaging per unit time at the cost of increased sensitivity to EPI and GRAPPA artifacts. Since the areas of interest are not in the center of the FOV, where the largest G-factor penalty is expected, a large GRAPPA kernel of 6x3 was used. We also used a very strong GRAPPA regularization (2000 larger than the vendors default). This results in larger GRAPPA artifacts in the center of the FOV but also higher tSNR in peripheral ROIs.
- VASO acquisition efficiency is increased by introducing a variable TR for control and label images. This allows more efficient imaging per unit time at the cost of reduced CBV weighting. (Fig. 1B).
The complete scan parameters are available on Github: https://github.com/layerfMRI/Sequence_Github/tree/master/Visual. Columnar and laminar analyses were conducted in EPI space based on T1-weighting in VASO, in a 3D grid of ‘layers’ and ‘columns’ with the open software package LAYNII: https://github.com/layerfMRI/LAYNII. Example data (raw and processed) are openly available on OpenNeuro 10.18112/openneuro.ds001547.v1.1.0. The sequence binaries are available for VB17 via SIEMENS C2P.
Results
Across all participants, we find that it is more efficient to optimize the EPI readout rather than to optimize the VASO T1-encoding times. Even though the tSNR is larger for sequence B), its functional sensitivity is lower (Fig. 2). The method proposed here has sufficient coverage to capture V1, V5, and LGN, simultaneously (Fig. 3):
- V1-ROI was selected based on the occurrence of the stria of Genari in previously acquired 0.5 mm T1-scans.
- V5/MT-ROI was selected based on a functional localizer task (motion vs. static).
- LGN-ROI was outlined based on functional activation.
As expected, CBV changes are locally more specific and less biased towards large veins in superficial layers than GE-BOLD [Huber 2017, Kim 2013] (Fig. 4A-B), at the cost of less significant voxels. Resting-state correlations reveal that V1 receives feedforward input from the LGN in middle layers and it receives feedback input from V5 in superficial and deeper layers (Fig. 5), as expected [Polimeni 2010a].
Discussion
The data presented here suggest that layer-dependent CBV fMRI achieves practicable coverage, high sensitivity and layer-dependent localization specificity to capture directional information flow between visual brain areas during activation and rest. The application of CBV fMRI allows us to minimize contaminations of physiological noise and nonspecific large veins that hamper the interpretability of layer-fMRI results with conventional GE-BOLD.Conclusion
The acquisition methods developed here will be useful for neuroscientific applications well beyond the previous demonstrations primarily in motor cortex, and applications investigating orientation decodability and biological point spread function by our collaborators are already ongoing.
In conclusion: For the first time, we presented a high-resolution large-coverage CBV sequence that can capture laminar connectivity in the visual system in humans.
Acknowledgements
This research is supported by the NIMH Intramural Research Program. We thank Dimo Ivanov for his help with implementing the 3D-EPI ASL/VASO sequence. We thank our collaborators who are also investigating the visual system at high resolutions for helpful discussions: Robert Trampel, Saskia Bollmann, Markus Barth, Cheryl Olman, Marcello Venzi, Kevin Murphy and Amir Shmuel.References
[Felleman and Van Essen 1991] Felleman and Van Essen, Cerebral Cortex, 1: 1-113, Distributed hierarchical processing in the primate cerebral cortex.
[Huber 2014] Huber et al., 2014, MRM 72:137-148, Slab-selective, BOLD-corrected VASO at 7 tesla provides measures of cerebral blood volume reactivity with high signal-to-noise ratio.
[Huber 2017] Huber et al., 2017, Neuron, 96: 1253-1263, High-resolution CBV-fMRI allows mapping of laminar activity and connectivity of cortical input and output in human M1.
[Kim 2013] Kim et al., 2013, NMR Biomed, 26: 949-962. Cerebral blood volume MRI with intravascular superparamagnetic iron oxide nanoparticles.
[Lu 2003] Lu et al., 2017, MRM, 50:63-74, Functional magnetic resonance imaging based on changes in vascular space occupancy.
[Mildner 2014] Mildner et al., 2013, NMR Biomed,27: 594-609. Mapping of arterial transit time by intravascular signal selection.
[Shi 2017] Shi et al., 2017, PNAS, 20: 5253–5258. High spatial correspondence at a columnar level between activation and resting state fMRI signals and local field potentials.
[Polimeni 2010a] Polimeni et al., 2010, ISMRM, 18:353, Identifying common-source driven correlations in resting-state fMRI via laminar-specific analysis in the human visual cortex.
[Polimeni 2010b] Polimeni et al., 2010, NeuroImage, 53: 1334-1346, Laminar analysis of 7T BOLD using an imposed spatial activation pattern in human V1.
[Poser 2010] Poser et al., 2010, NeuroImage, 51: 261-266, Three dimensional echo-planar imaging at 7 tesla.
Figures