0363
Looping Star silent fMRI: a platform for improving studies of auditory processing1Department of Neuroimaging, Institute of Psychiatry, Psychology and Neuroscience, King's College London, London, United Kingdom, 2ASL Europe, General Electric Healthcare, Munich, Germany
Synopsis
Conventional functional magnetic resonance imaging (fMRI) produces acoustic noise levels comparable to a running chainsaw. This presents numerous challenges for functional data interpretation, providing a substantial confound for auditory processing. Recently, a novel imaging technique known as “Looping Star” has been developed, which reduces this acoustic noise to the amplitude of normal conversation. We applied this acquisition technique with an auditory paradigm for the first time, comparing it with conventional fMRI. We established that it displays good functional sensitivity in spite of reduced signal-to-fluctuation-noise, alongside functional localisation free from inflow effects. This technique could revolutionise future investigations of acoustic processing.
Introduction
Conventional functional magnetic resonance imaging (fMRI), using gradient-recalled echo echo-planar imaging (GRE-EPI), produces acoustic noise of up to 120dBA1. This loud acoustic noise is known to cause anxiety2, particularly in neonates and participants with autism spectrum disorders. It also interferes with data interpretation of studies of attention, multi-modal processing and resting-state connectivity3-7, and hinders studies of auditory processing; requiring complex pulse sequences and/or paradigm designs8-10. Additionally, GRE-EPI suffers from artefacts including geometric distortion, inflow effects, and signal drop out, which greatly reduce the reliability of spatial localisation of the neural activity11,12.
A novel three-dimensional pulse sequence has been developed that can address these limitations. This is known as “Looping Star”13,14 and has previously demonstrated significantly lower acoustic noise, reduced geometric distortion though lower signal-to-fluctuation-noise ratio, and viability for functional studies15. However, it has yet to be validated with an auditory paradigm in comparison with conventional methods. Additionally, it has mainly been used as a single-echo modality despite its multi-echo capability14,16, which can remove non-neuronal frequency components17.
This study aims to demonstrate the multi-echo usage of Looping Star and evaluate whether it can benefit auditory processing studies in humans.
Methods
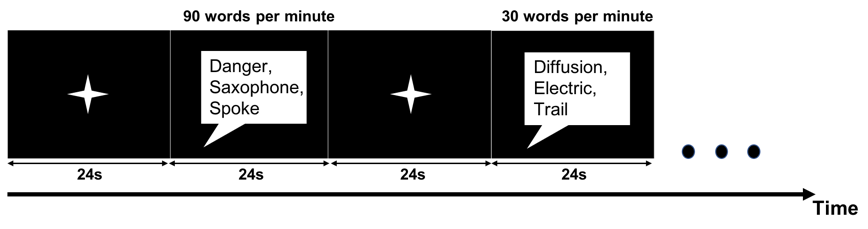
Eight healthy participants (two female; mean age=35 years +/- 12 years; two left-handed; three native English speakers) were scanned whilst participating in an auditory paradigm (Figure 1). English words were played through MR-compatible headphones at different speeds (30, 60, 90 and 120 words per minute) in a randomised order within blocks of 24s, whilst a fixation cross was displayed. Rest blocks involved a fixation cross with no auditory stimulation. Seven and eight blocks were used for Looping Star and GRE-EPI acquisitions respectively, due to scan duration differences.
The following acquisition parameters were used on a 3T General Electric MR750 scanner, as closely matched as possible between modality within scan limitations, using a 12 channel receive-only head coil: three-echo GRE-EPI (TE=17ms,34ms,51ms, TR=2.1s, 184 volumes, matrix size=64x64, slice thickness=3mm, 32 slices, slice gap=1mm, field-of-view=24cm, flip angle=80°) and three-echo Looping Star (TE=0ms,17.4ms,34.8ms, TR=1.87s, number of volumes=180, matrix size=64x64x64, resolution=3mm, field-of-view=19.2cm, 32 spokes per echo, 96 spokes per segment, 960 spokes per volume, flip angle=3°). A structural IR-SPGR image was also acquired (TE=3.016ms, TR=7.312s, TI=400ms, matrix size=256x256, resolution=1.2mm, 196 slices).
Steady-state signal stabilisation was accounted for by removing ten volumes from the Looping Star acquisition and four volumes from GRE-EPI. Scan order was randomised between participants. Sound level recordings were measured with a Casella 62X sound level meter placed in the scanner bore centre. Image reconstruction of the Looping Star data was conducted offline using a nearest-neighbour gridding method14.
A standard SPM-1218 pipeline was used for single-echo pre-processing (motion-correction, co-registration, spatial normalisation and smoothing with an 8mm FWHM kernel). Optimal echo combination and its respective pre-processing was conducted with the ME-ICA toolbox17, excluding PCA de-noising and filtering. We conducted two optimal combinations: one of all three echoes and the other of the two echoes at more appropriate echo times (17/17.4ms and 34/34.8ms), given grey matter properties.
Fixed-effects and group-level fMRI analysis were conducted with SPM-12. An auditory region-of-interest for small-volume correction (p<0.05 family-wise error corrected) was selected using a Neurosynth19 meta-analysis of 1252 studies under the term “auditory”, at z-threshold = 7.8. Percentage signal change was calculated with MarsBaR20 signal extraction using the peak voxel at fixed-effect level (p<0.001 uncorrected).
Results
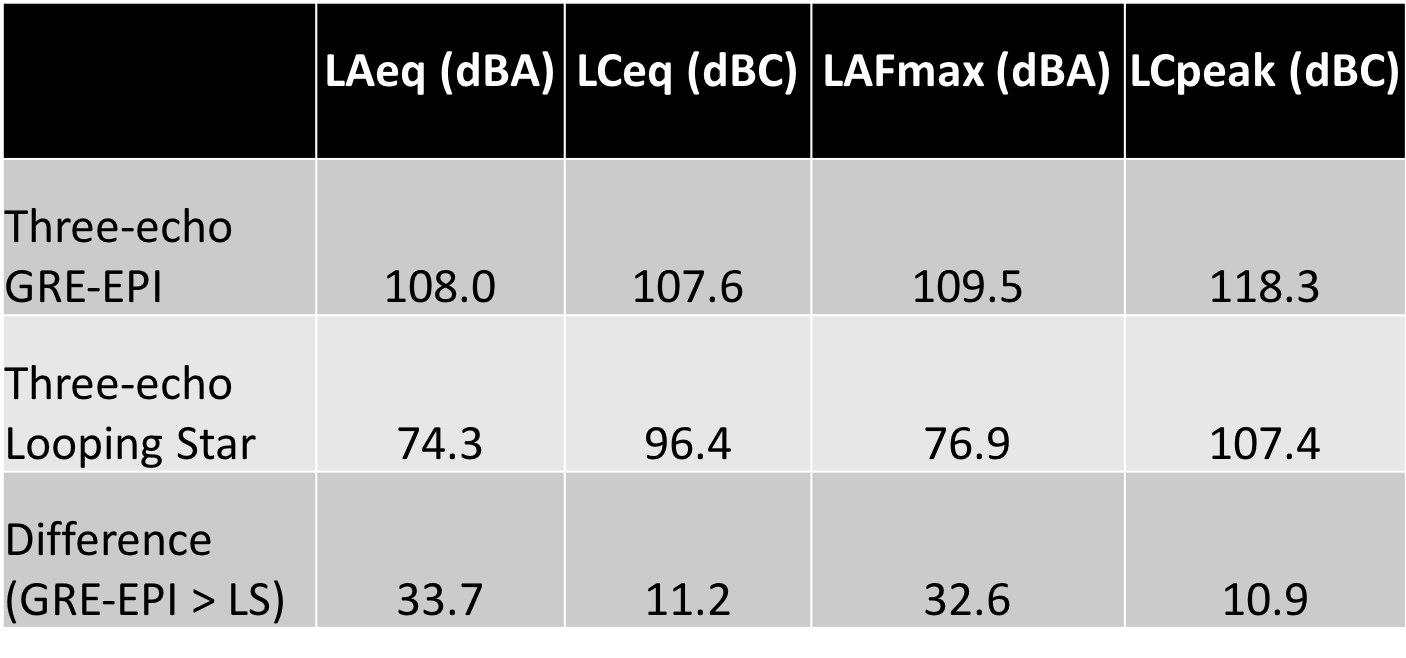
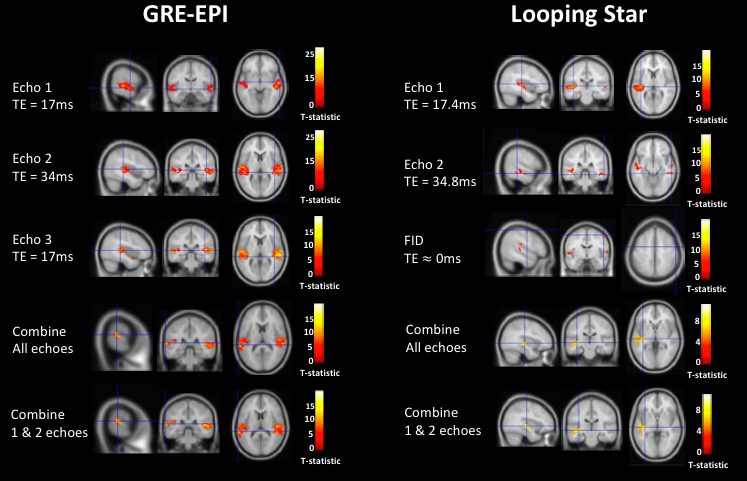
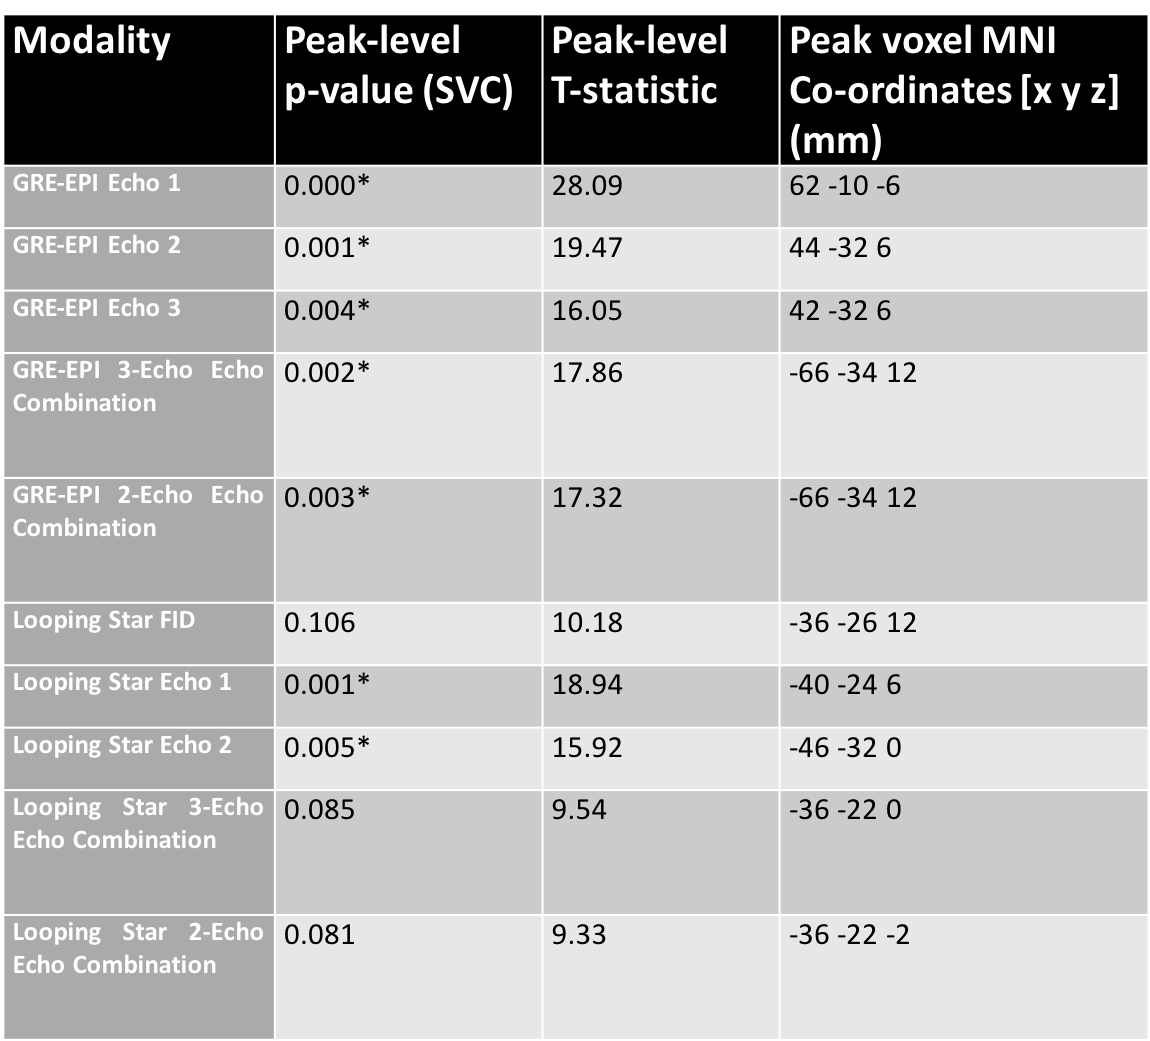
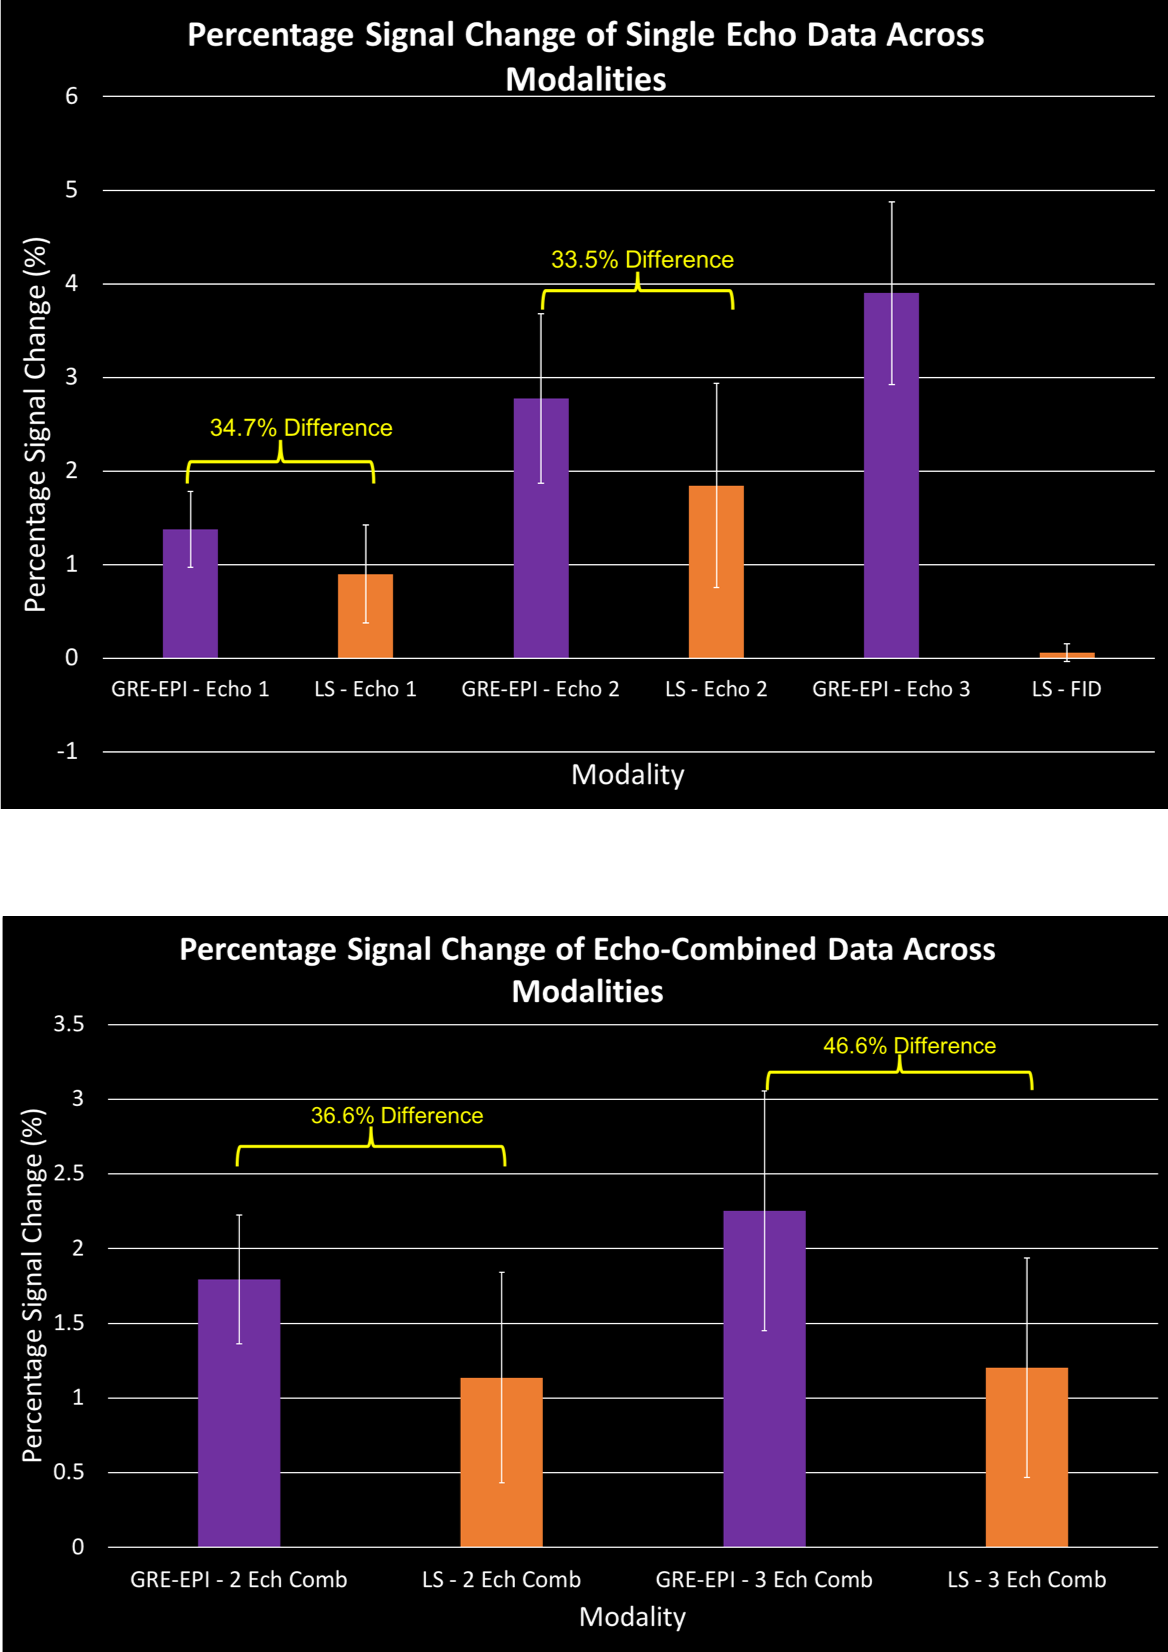
Looping Star acquisition demonstrated significantly lower acoustic noise than GRE-EPI (Table 1). The group-level activity maps (Figure 2) show that Looping Star produces left-lateralised maps in both the single-echo and echo-combined cases during auditory stimulation, though the latter did not survive small-volume correction (Table 2). The percentage signal change at peak level (Figure 3) demonstrates that Looping Star can reach ~66% of the change in GRE-EPI, despite the overall lower signal-to-fluctuation-noise ratio.Discussion
Our results indicate that Looping Star has sufficient sensitivity relative to conventional multi-echo fMRI. As the echo times increase, localisation of the blood-oxygen-level-dependent (BOLD) response changes. This is possibly indicative of sensitivity to underlying physiological mechanisms, particularly in the free-induction decay image, as this modality is likely to be less sensitive to inflow effects, unlike SWIFT imaging21. The left-lateralisation could be explained by improved ability to hear the words, and therefore enhanced functional specificity for word processing22,23, though further study is required.Conclusions
Our preliminary results indicate that silent fMRI could improve studies of auditory processing due to the reduced acoustic interference of this methodology. Continued optimisation of Looping Star could therefore reveal additional information on the auditory system and facilitate studies in populations that cannot tolerate the loud noise of conventional functional MR imaging.Acknowledgements
This study represents independent research supported by the NIHR-Wellcome Trust King's Clinical Research Facility and the National Institute for Health Research (NIHR) Biomedical Research Centre (BRC) at South London and Maudsley NHS Foundation Trust and King’s College London. The first author is in receipt of a PhD studentship funded by the NIHR Maudsley Biomedical Research Centre. The views expressed are those of the author(s) and not necessarily those of the NHS, the NIHR or the Department of Health and Social Care.
References
- Moelker A, Pattynama P. Acoustic noise concerns in functional magnetic resonance imaging. Hum Brain Mapp. 2003;20:123‐141.
- Quirk, M.E., Letendre, A.J., Ciottone, R.A. and Lingley, J.F., 1989. Anxiety in patients undergoing MR imaging. Radiology, 170(2), pp.463-466.
- Tomasi, D., Caparelli, E.C., Chang, L. and Ernst, T., 2005. fMRI-acoustic noise alters brain activation during working memory tasks. Neuroimage, 27(2), pp.377-386.
- Rondinoni C, Amaro E Jr, Cendes F, dos Santos AC, Salmon C. Effect of scanner acoustic background noise on strict resting‐state fMRI. Braz J Med Biol Res. 2013;46:359‐367. 50.
- Andoh J, Ferreira M, Leppert IR, Matsushita R, Pike B, Zatorre RJ. How restful is it with all that noise? Comparison of Interleaved silent steady state (ISSS) and conventional imaging in resting‐ state fMRI. NeuroImage. 2017;147:726‐735.
- Skouras S, Gray M, Critchley H, Koelsch S. fMRI scanner noise interaction with affective neural processes. PLoS One. 2013;8:e80564.
- Jacob SN, Shear PK, Norris M, et al. Impact of functional magnetic resonance imaging (fMRI) scanner noise on affective state and attentional performance. J Clin Exp Neuropsychol. 2015;37:563‐570.
- Gaab N, Gabrieli J, Glover GH. Assessing the influence of scanner background noise on auditory processing. I. An fMRI study comparing three experimental designs with varying degrees of scanner noise. Hum Brain Mapp. 2007;28:703‐720.
- Gaab N, Gabrieli J, Glover GH. Assessing the influence of scanner background noise on auditory processing. II. An fMRI study comparing auditory processing in the absence and presence of recorded scanner noise using a sparse design. Hum Brain Mapp. 2007;28:721‐732
- Schwarzbauer, C., Davis, M.H., Rodd, J.M. and Johnsrude, I., 2006. Interleaved silent steady state (ISSS) imaging: a new sparse imaging method applied to auditory fMRI. Neuroimage, 29(3), pp.774-782.
- Ojemann, J.G., Akbudak, E., Snyder, A.Z., McKinstry, R.C., Raichle, M.E. and Conturo, T.E., 1997. Anatomic localization and quantitative analysis of gradient refocused echo-planar fMRI susceptibility artifacts. Neuroimage, 6(3), pp.156-167.
- Stenger, V.A., Boada, F.E. and Noll, D.C., 2000. Three‐dimensional tailored RF pulses for the reduction of susceptibility artifacts in T* 2‐weighted functional MRI. Magnetic resonance in medicine, 44(4), pp.525-531.
- Solana AB., Menini A., Wiesinger, F. 2017. Silent, Multi‐Echo T2* Looping Star fMRI. In Proceedings of the 25th Annual Meeting of ISMRM. Honolulu, HI. Abstract 585.
- Wiesinger, F., Menini, A. and Solana, A.B., 2018. Looping Star. Magnetic resonance in medicine.
- Damestani, N.L., Zelaya, F.O., and Lythgoe, D.J. 2018. Looping Star: a novel silent approach to imaging brain function in health and disease. In Proceedings of British Chapter for ISMRM.
- Dionisio, B., Solana-Sanchez, A. 2018. Silent Simultaneous EEG-fMRI using Looping-Star. In Proceedings of the 26th Annual Meeting of ISMRM. Paris, France. Abstract 4523.
- Kundu, P., Inati, S.J., Evans, J.W., Luh, W.M. and Bandettini, P.A., 2012. Differentiating BOLD and non-BOLD signals in fMRI time series using multi-echo EPI. Neuroimage, 60(3), pp.1759-1770.
- The FIL Methods Group. SPM-12 Software Version 7219. https://www.fil.ion.ucl.ac.uk/spm/software/spm12/
- Yarkoni, T. Accessed October 2018. http://neurosynth.org.
- Brett, M., Anton, J., Valabregue, R., Poline, J. 2002. MarsBaR: Region of Interest Analysis with an SPM Toolbox. Presented at the 8th International Conference on Functional Mapping of the Human Brain, June 2-6, 2002, Sendai, Japan. Available on CD-ROM in NeuroImage, Vol 16, No 2.
- Mangia, S., Chamberlain, R., Martino, F., Moeller, S., Corum, C., Kim, T., Kalavagunta, C., Michaelli, S., Garwood, M., Kim, S. and Ugurbil, K., 2012. Functional MRI with SWIFT. In Proceedings International Society of Magnetic Resonance in Medicine (Vol. 20).
- Tervaniemi, M. and Hugdahl, K., 2003. Lateralization of auditory-cortex functions. Brain Research Reviews, 43(3), pp.231-246.
- Shtyrov, Y., Kujala, T., Ahveninen, J., Tervaniemi, M., Alku, P., Ilmoniemi, R.J. and Näätänen, R., 1998. Background acoustic noise and the hemispheric lateralization of speech processing in the human brain: magnetic mismatch negativity study. Neuroscience Letters, 251(2), pp.141-144.
Figures