0362
Characteristics of mouse BOLD fMRI responding to visual stimulation1Department of Biomedical Engineering, Sungkyunkwan University, Center for Neuroscience Imaging Research, Institute for Basic Science (IBS), Suwon, Korea, Republic of
Synopsis
While the most common BOLD fMRI studies in mice have focused on evoking BOLD response in the somatosensory system, the functional response characteristic of mouse visual system is not well explored. Here, we investigated BOLD fMRI in mice with visual stimuli varying flash frequency in the range of 1 to 10Hz and pulse width from 1 to 50ms under ketamine/xylazine anesthesia at 9.4T.
Introduction
The use of mice in fMRI is rapidly increasing to investigate the relationship between genes and brain functions in health and diseases. Multiple task-based mouse BOLD fMRI studies have been conducted via paw electrical stimulation to examine the efficacy of anesthetics. However, even though the visual stimulation is common in human fMRI, there are only 2 mouse fMRI studies using visual stimulus 1,2. One mouse fMRI study 1 reported atypical result compared to rat studies 3,4,5. The other under medetomidine anesthesia 2 characterized frequency-dependence of the mouse visual system and showed negative BOLD signals in the primary visual cortex at 10Hz, which differs from rat studies 3,4,5. In this study, we aimed to characterize visual stimulation parameter-dependence of mouse BOLD fMRI under ketamine/xylazine anesthesia.Methods
Animal Preparation
Eight male C57BL/6N mice (8-10 weeks old) were performed BOLD fMRI on 9.4T/30cm Bruker scanner. The mice were initially anesthetized with a mixture of ketamine/xylazine (100mg/kg/10mg/kg, respectively, IP); supplementary anesthesia (25mg/kg/1.25mg/kg, respectively, IP) was administrated to maintain the anesthesia condition 6. Frequency-dependence fMRI study was conducted on 5 mice and 3 others were used for the variation of pulse width study.
Data Acquisition
BOLD fMRI was conducted using single-shot GE-EPI sequence with TR/TE=1000/20ms, flip angle α=50 degree, spatial resolution=156×156×500μm3, and 9 coronal contiguous slices without gap. To do group analysis in common space, anatomical images were obtained using FLASH: TR/TE= 250/3ms, NEX=4, spatial resolution=59×59×500μm3, and 15 coronal slices. Visual stimulus was conducted by LEDs white cold light. LEDs source with 10 Lux of light intensity was delivered to both eyes; and the stimuli paradigm consisted of 40 seconds off – 15 seconds on – 40 seconds off. BOLD fMRI with 1ms of pulse width was conducted with a random order of 1, 3, 5, 8, and 10Hz stimulus. Based on the result of the frequency-dependence experiment, 5Hz of stimulation was chosen to do fMRI with varying pulse width from 1 to 50ms.
Data Processing
Data were processed with Matlab script and the AFNI package. The preprocessing includes slice timing correction, motion correction, temporal detrending, temporal normalization from baseline and trial averaging. After that the standard GLM analysis was applied to identify significant BOLD responses (p<0.05; FWE corrected). Regions of interest (ROI) were defined on EPI images based on Allen Mouse Brain Atlas. Within the ROI, the mean BOLD percent change was averaged from 5 seconds after stimulation onset. The frequency tuning curves and relative change of BOLD response corresponding to change of pulse width were calculated for each ROI. The anatomic common space was created by averaging anatomical image of all scanned animals.
Results
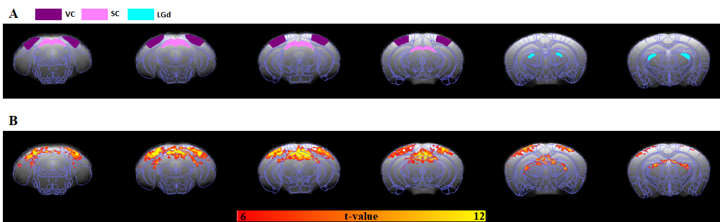
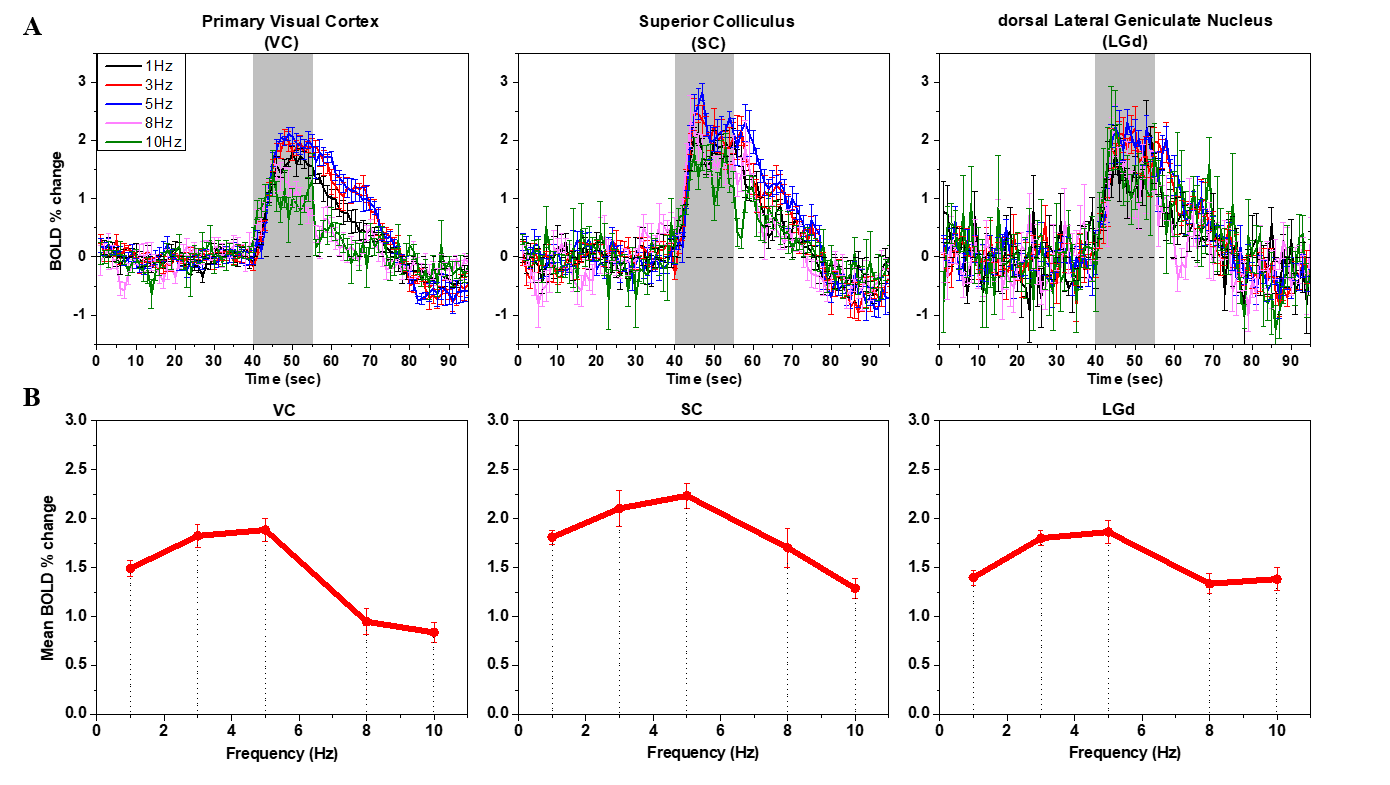
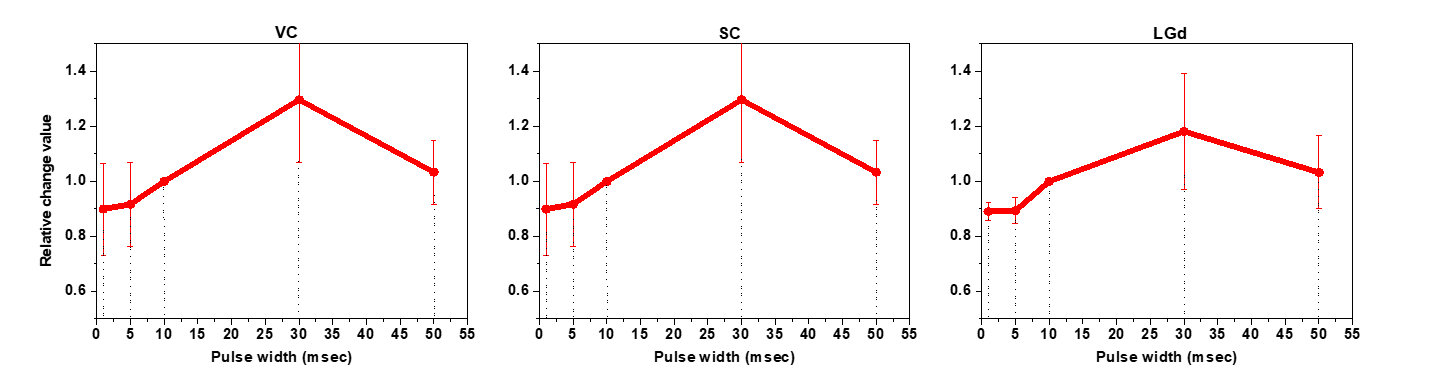
The group-level activation map of BOLD fMRI response at 5Hz stimulus (n=5) was overlaid on the anatomic common space (Fig. 1). The bilateral BOLD activation was mainly localized in the primary visual cortex (VC), superior colliculus (SC) and dorsal lateral geniculate nucleus (LGd). No negative BOLD responses were observed in all experiments. Figure 2 shows BOLD time courses and frequency tuning cures of VC, SC, and LGd ROIs. The frequency-dependence of BOLD response in 3 regions was increased gradually from 1 to 5Hz, but at higher frequencies stimulation (8 and 10Hz), the response was decreased rapidly in VC, while it was still maintained at subcortical SC and LGd. This result concurs with rat fMRI studies 3,4,5 as well as cat fMRI study 7. The pulse-width-dependence result (Fig. 3) showed a similar trend as the frequency dependency (Fig. 2B); the normalized BOLD response linearly increased up to the pulse width of 30ms and decreased for a longer pulse (50ms).Discussion & Conclusion
We have successfully observed the temporal frequency tuning curves of the visual system in mice under the mixture of ketamine/xylazine. Our frequency tuning differs from previous mouse fMRI findings which may be due to different anesthetics (ketamine/xylazine vs. medetomidine) or pulse lengths (1ms vs. 10ms). Thus, we examined the dependency of pulse length and found increased positive responses up to 30ms pulse duration, indicating different anesthetics is the source of discrepancy between ours and Niranjan et al.2
Our mouse fMRI data under ketamine/xylazine is in agreement with previous studies in rats 3,4,5 and cats 7, suggesting that ketamine/xylazine is a good anesthetic for mouse fMRI. Our results provide optimal parameters of light stimulation, which is helpful for obtaining maximal BOLD responses evoked by visual stimulation in future transgenic mouse fMRI studies.
Acknowledgements
This work was supported by IBS-R015-D1.References
- Huang W, Plyka I, Li H, et al. Magnetic resonance imaging (MRI) detection of the murine brain responses to light: temporal differentiation and negative function MRI changes. Proceedings of the National Academy of Sciences. 1996;93(12):6037-42.
- Niranjan A, Christie IN, Solomon SG, et al. fMRI mapping of the visual system in the mouse brain with interleaved snapshot GE-EPI. Neuroimage. 2016;139:337-45.
- Van Camp N, Verhoye M, De Zeeuw Cl, et al. Light stimulus frequency dependence of activity in the rat visual system as studied with high-resolution BOLD fMRI. Journal of neurophysiology. 2006;95(5):3164-70.
- Pawela CP, Hudetz AG, Ward BD, et al. Modeling of region-specific fMRI BOLD neurovascular response functions in rat brain reveals residual differences that correlate with the differences in regional evoked potentials. Neuroimage. 2008;41(2):525-34.
- Bailey CJ, Sanganahalli BG, Herman P, et al. Analysis of time and space invariance of BOLD responses in the rat visual system. Cerebral cortex. 2012;23(1):210-22.
- Shim HJ, Jung WB, et al. Mouse fMRI under ketamine and xylazine anesthesia: Robust contralateral somatosensory cortex activation in response to forepaw stimulation. NeuroImage. 2018;177:30-44.
- Yen CC, Fukuda M, Kim SG. BOLD responses to different temporal frequency stimuli in the lateral geniculate nucleus and visual cortex: insights into the neural basis of fMRI. Neuroimage. 2011;58(1):82-90.
Figures