0358
In-Vivo Current Mapping in Transcranial Direct Current Stimulation (tDCS) – A Concurrent tDCS-MRCDI Study1Stanford Law School, Palo Alto, CA, United States, 2Biophysics, Stanford, Palo Alto, CA, United States, 3Radiology, Stanford University, Stanford, CA, United States
Synopsis
Transcranial direct current stimulation (tDCS) is gaining momentum both in the research community and in the general public as an attractive tool for neuromodulation. However, the mechanism of tDCS in the brain is not fully understood. In this study, we conducted a concurrent tDCS–magnetic resonance current density imaging (MRCDI) experiment to measure the primary direction and magnitude of current in a human brain undergoing direct current stimulation. Our results show that current flow deviates significantly from its desired distribution based on human head models and that the current mostly flows through the white matter and cerebrospinal fluid.
Background
tDCS delivers weak direct current to the brain using two electrodes attached to the scalp, and it is believed to be able to alter neuronal activation in a target region under/near the electrodes.1 Recently tDCS has become widely used in clinical and academic research.2 However, studies have reported inconsistent and conflicting results. 3 4 5 We hypothesized that the lack of consistency and reproducibility is in part due to imprecise targeting. Previous studies have used brain models to simulate current flow, but we still lack reliable and accurate methods to empirically measure the current flow during tDCS.6 By combining MRCDI with tDCS, we explored the primary direction and magnitude of the current in different electrode montages.Methods
Participants: Eleven healthy subjects (4 male and 7 female; average age = 29.4) were recruited for the study. Written informed consent was obtained from participants.
Experimental Design: Each subject underwent 4 different tDCS scans with different electrode positions. The direction and distribution of current in each session were measured by simultaneous MRCDI.
tDCS: One common electrode (5x7cm²) was attached to the back of neck and four test electrodes (4x5 cm²) were attached (1) between T4 and F8, (2) between F8 and Fp2, (3) Fpz, and (4) between Fp1 and F7 in 10-20 EEG System (Fig. 1). The electrodes were positioned to maximize the current presumed to flow in a direction perpendicular to B0 since the MRCDI only measured the induced Bz component of field. Low frequency sinusoidally varying current (±1 mA; 30 second period) was delivered in the magnet using a homemade constant current source for 6 minutes between the common electrode and each of the four test electrodes. The total stimulation was 24 minutes for each subject.
MRCDI Data Acquisition: Phase contrast images were acquired during 6 minute scans to obtain the ΔBz component of magnetic field induced by the injected current. We employed a spiral sequence with TR/TE = 2000/30 ms, 30 4 mm slices, 3.43x3.43 mm in-plane resolution, and 150 time frames. ΔBz maps were calculated from the phase Φm using
Φm = (γ x ΔBz x TE)mod(2π)
MRCDI Data Analysis: A standard fMRI GLM processing pipeline was employed to obtain field maps, where the timeseries phase data were correlated with a 0.033 Hz sine & cosine wave to generate T-score maps of the signed field. Ampere’s Law was used to solve for Jx and Jy; we only have partial information, namely ∂Bz/∂y and ∂Bz/∂x.
Jx = ∂Bz/∂y - ∂By/∂z, Jy = ∂Bx/∂z - ∂Bz/∂x
In order to characterize the distribution of current with respect to brain tissue type, we segmented the anatomical images into three tissue types: gray matter, white matter, and CSF. We then calculated the flux of J for each coronal slice through each tissue type within that slice using the co-registered current maps. If the current had no preference for any tissue, the three curves in the flux/pixel plot (Fig. 4) would be equal at every slice. Therefore, these plots give a basic quantification of the current’s tissue preference as it flows between electrodes. We also calculated the average angle of current flow in the XY plane from atan(Jy, Jx) (Fig. 2C).
Results
Primary Direction of Current: Contrary to what would be expected from a direct current flow between electrodes, the average angle of current did not differ significantly between the four electrode positions. (Fig.3).
Distribution of Current in Different Tissue Types: In Figures 4A,B, the current essentially distributes itself according to the volume of each tissue within the head, where white matter dominates, followed by gray matter, followed by CSF. However, when normalized by tissue volume (Figs. 4C,D), the current has a strong preference for CSF, especially in regions close to the middle of the brain.
Discussion and Conclusion
In this study, the primary direction of current was not significantly different across different electrode montages. The current was mainly distributed in the white matter in all four montages. Near the middle of the brain, the current showed a particularly strong preference for the CSF. We hypothesize that the high volume of CSF in the lateral ventricles attracts a disproportionate amount of current to this region due to the high conductivity of CSF (1.79 S/m) as compared to neural tissue (0.33 S/m). These results may help explain some of the conflicting and inconsistent findings in the literature. A limitation is that a minor amount of the current was not detected from only our ΔBz measurements (Fig. 2A).Acknowledgements
This study was funded by NIH P41-EB015891, Stanford Gambhir Grant, and Stanford Medical Scientist Training Program.References
1. Stagg, C.J., A. Antal, and M.A. Nitsche, Physiology of Transcranial Direct Current Stimulation. Journal of Electroconvulsive Therapy, 2018. 34(3): p.144-152.
2. Yavari, F., et al., Basic and Functional Effects of Transcranial Electrical Stimulation (tES) - An Introduction. Neuroscience & Biobehavioral Reviews, 2018. 85: p.81-92.
3. Berryhill, M.E., et al., Hits and Misses: Leveraging tDCS to Advance Cognitive Research. Frontiers in Psychology, 2014. 5. doi:10.3389/fpsyg.2014.00800.
4. Tremblay, S., et al., The Uncertain Outcome of Prefrontal tDCS. Brain Stimulation, 2014. 7(6): p.773-783.
5. Loo, C.K., et al., International Randomized-Controlled Trial of Transcranial Direct Current Stimulation in Depression. Brain Stimulation, 2018 11(1): p.125-133.
6. Sadleir, R.J., et al., Transcranial Direct Current Stimulation (tDCS) in a Realistic Head Model. NeuroImage, 2010. 51(4): p.1310-1318.
Figures
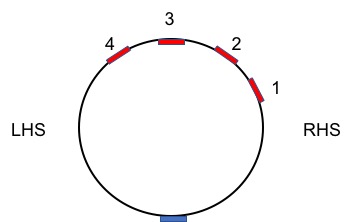
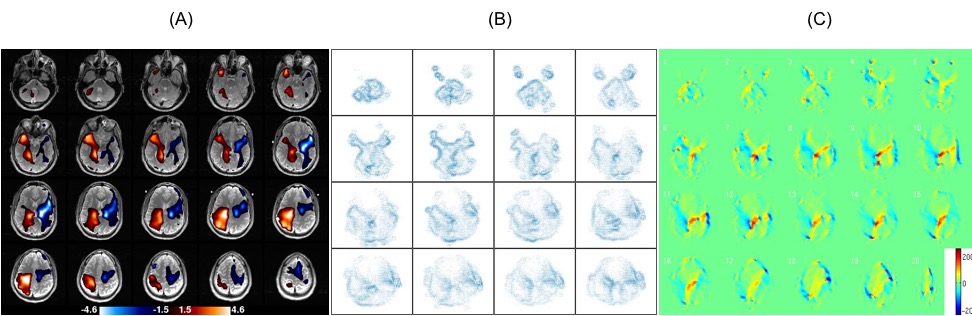
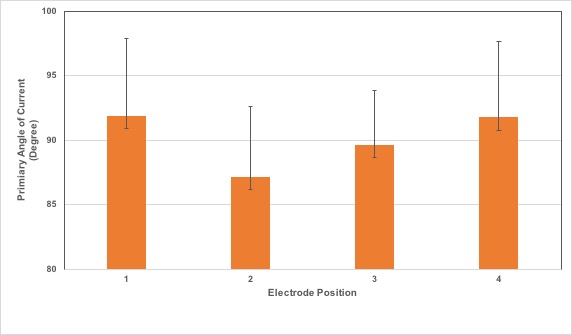
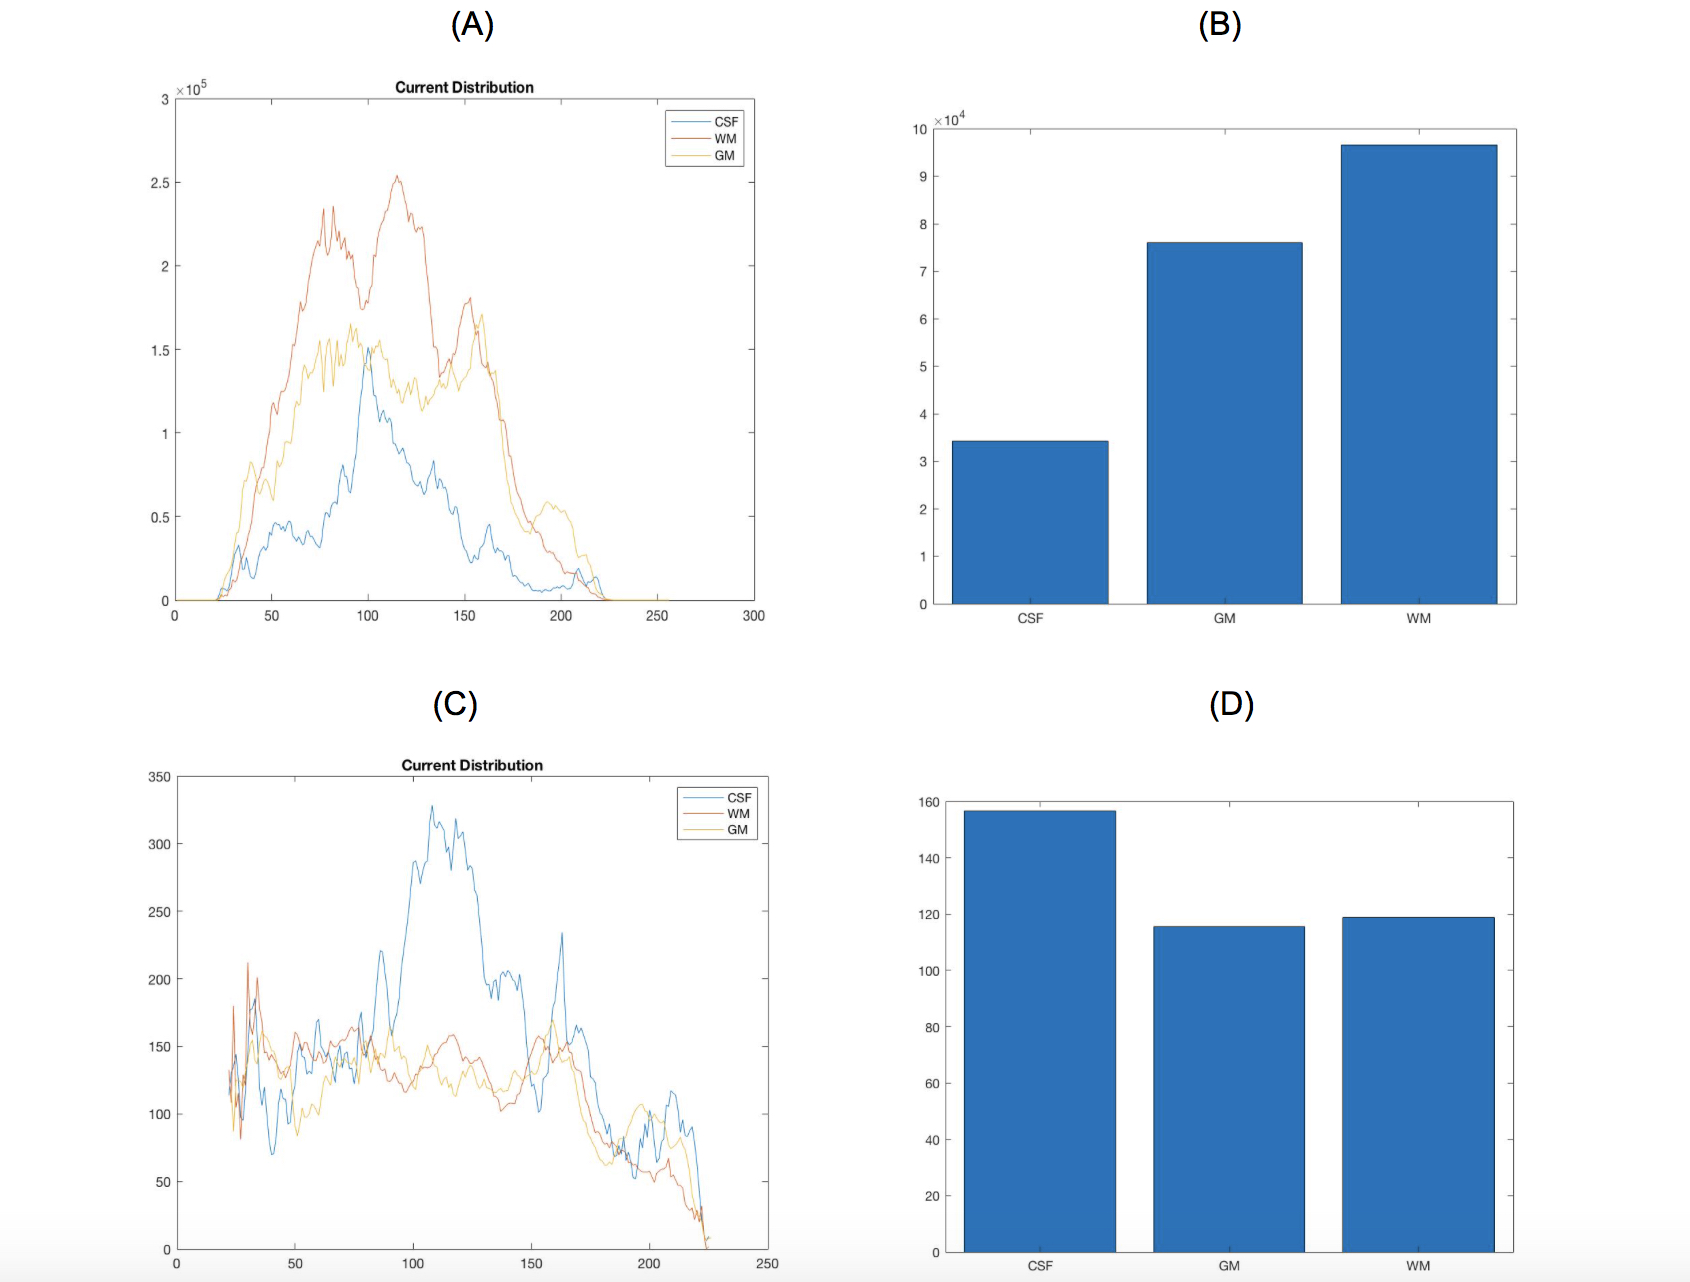
Fig.4: Typical distribution of current in cerebrospinal Fluid (CSF), gray matter (GM), and white matter (WM): (A),(B) without density compensation; (C),(D) normalized by tissue volume.