0356
Exploring the Application of an Multi-Advanced-Diffusion-Model-Based Radiomics Method in Grading of Intestinal Fibrosis of Crohn's Disease1The First Affiliated Hospital of Sun Yat-Sen University, Guangzhou, China, 2The First Affiliated Hospital of Sun Yat-Sen University, guangzhou, China, 3MR Scientific Marketing, Siemens Healthcare, guangzhou, China, 4Shanghai Key Laboratory of Magnetic Resonance, East China Normal University, shanghai, China
Synopsis
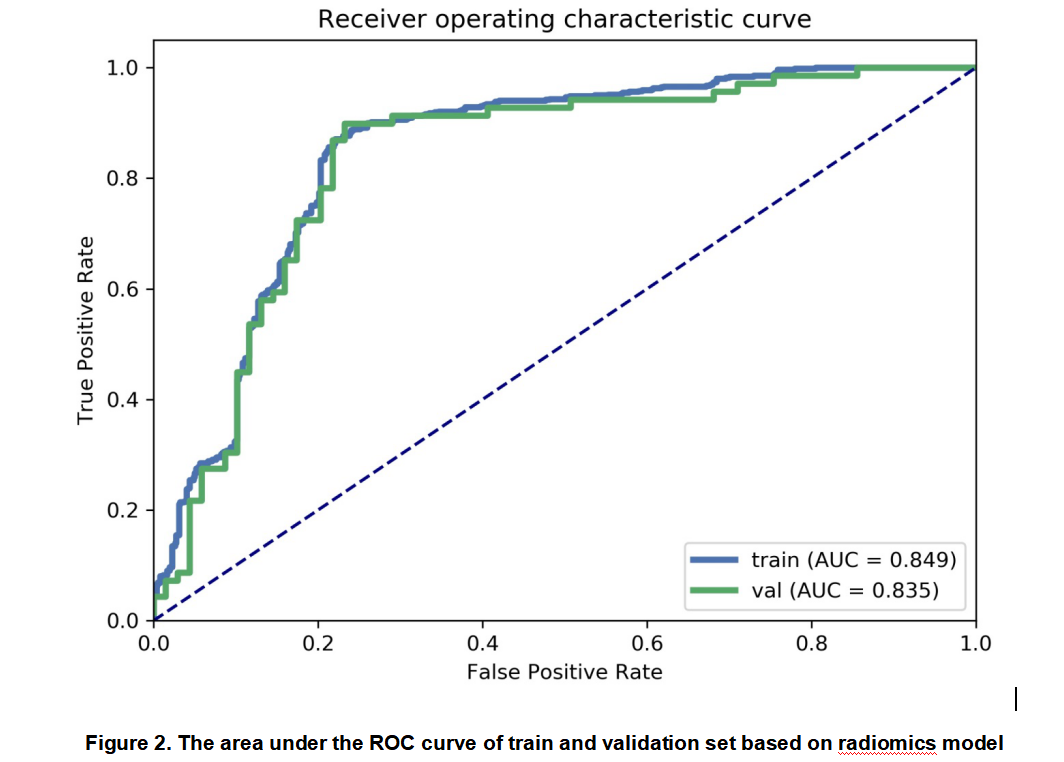
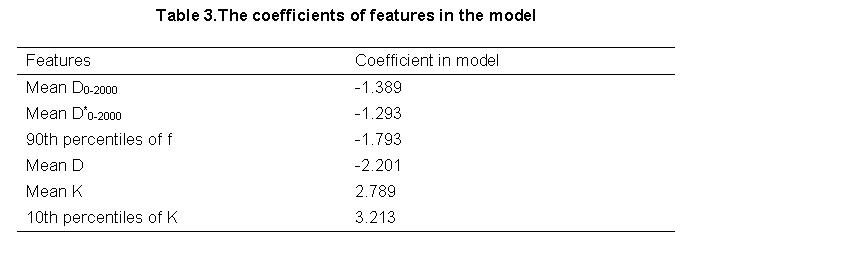
In the present study, we investigated a multiple diffusion-model-based radiomics model in grading of bowel fibrosis of Crohn's disease (CD) patients. We used histogram features derived from parameters of DWI, IVIM and DKI models and chose SVM as the classifier to construct a prediction model. The results showed that the most accurate prediction was achieved by incorporating the following 6 features into a nomogram, including the DKI-related histogram parameters (mean D, mean K, 10th percentiles of K) and IVIM-related parameters (mean D0-2000, mean D*0-2000, 90th percentiles of f), with AUC and accuracy reached 0.835 and 0.833, respectively.
Introduction
Advanced diffusion weighted imaging (DWI) has been applied for the diagnosis of Crohn's disease (CD) in recent years1. Previous studies2-4 reported that parameters derived from two advanced DWI models showed significant correlated with inflammatory and fibrotic histopathological changes, including diffusion kurtosis imaging (DKI) model, reflecting non-Gaussian behavior of water diffusion, and intravoxel incoherent motion (IVIM) model, reflecting blood perfusion and pure molecular diffusion. This led to the hypothesis that applying advanced diffusion models in radiomics analysis might show high potential in diagnosis of intestinal fibrosis5-8. This study aims to extract radiomics features from multi-diffusion-parameters and evaluate the performance of these features in grading intestinal fibrosis of CD patients, with surgical histopathology as reference standard. DWI, DKI and IVIM models were jointly used here.Method
A total of 32 patients with CD (18-63 years old, 13 males and 19 females) were enrolled and 107 colonoscopy biopsy tissue specimens were divided into two groups (32 cases for mild/moderate-degree group, 69 cases for severe-degree fibrosis group) according to the masson staining results. Each subject underwent MRI scan using a 3T MR scanner (MAGNETOM Verio, Siemens Healthcare, Erlangen, Germany) with a multi-channel phased-array body matrix coil. Conventional magnetic resonance enterography (MRE) was acquired, including an breath-hold HASTE-T2WI in the axial view and an fat-suppressed 3D-VIBE in the coronal view. A single-shot spin-echo (SE) echo-planar-imaging (EPI) sequence was performed to acquire DWI images. The parameters of EPI were listed as following: b values = 0, 10, 20, 40, 60, 80, 100, 150, 300, 600, 1000, 1500 and 2000 s/mm2; TR/TE = 3300/81.2 ms, FOV =236×299 mm2, number of slice =18, slice thickness =5mm, matrix =132×132, iPAT factor =2. For diffusion model estimation, the parameter maps of three diffusion models, namely DWI, IVIM and DKI, were derived from an in-house developed tool based on Matlab (Mathworks, Natick, MA). For DWI model, the ADC maps of the different b-values ranging 100-1000 s/mm2 and 100-2000 s/mm2 were separately calculated, denoting as ADCs100-1000 and ADCs100-2000. For IVIM model, the b-values ranging 0-1000 and 0-2000 s/mm2 were used, with the derived parameters denoted as D0-1000, D*0-1000, f0-1000, D0-2000, D*0-2000 and f0-2000, whereas D, D* and f represented real diffusion coefficient, pseudo-diffusion coefficient and perfusion fraction, respectively. For DKI model, the diffusivity (D) and kurtosis (K) values were derived using the b values of 0, 600, 1000, 1500 and 2000 s/mm2. Then, radiologists manually draw three regions of interest (ROIs) on the bowel wall excluding the bowel content, in which histogram-based radiomics features were automatically extracted. For the radiomics features analysis, an open source tool called FeAture Explorer (FAE, v0.1.1, https://github.com/salan668/FAE) was used. We selected 138 cases as the training and validation dataset. First, the features clean and preparation were performed. The data of negative group was up-sampled to balance the two sets of samples. The range of each feature was normalized to unit. If two features were similar to each other (dot product larger than 0.86), we removed one of them randomly to reduce the dimension of the feature space. Second, the feature selection was performed before model development using recursive feature elimination (RFE). Lastly, we trained the model by support vector machine (SVM) with linear kernel. To investigate the performance of the model, we applied cross validation with 10-folder on the dataset. The performance of the model was evaluated using receiver operating characteristic (ROC) curve analysis.Result
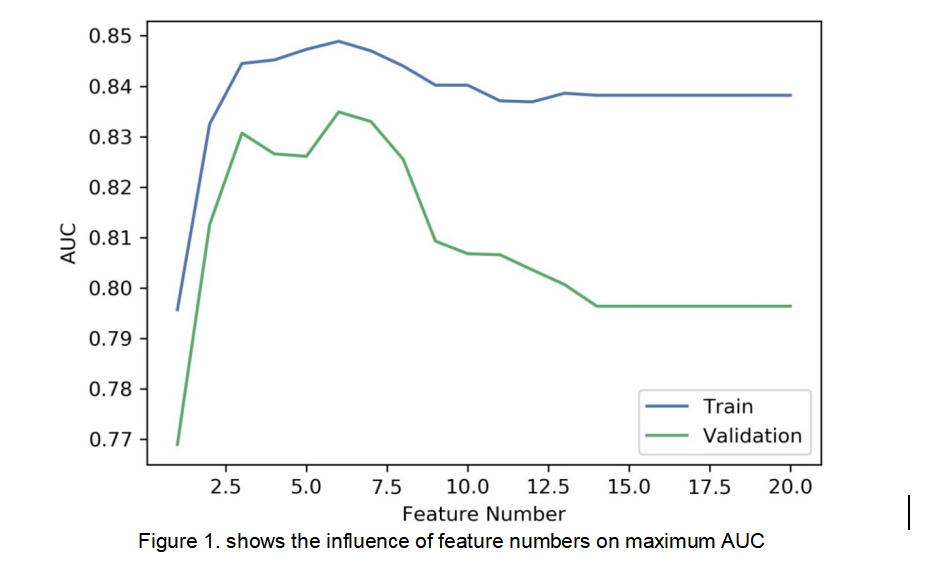
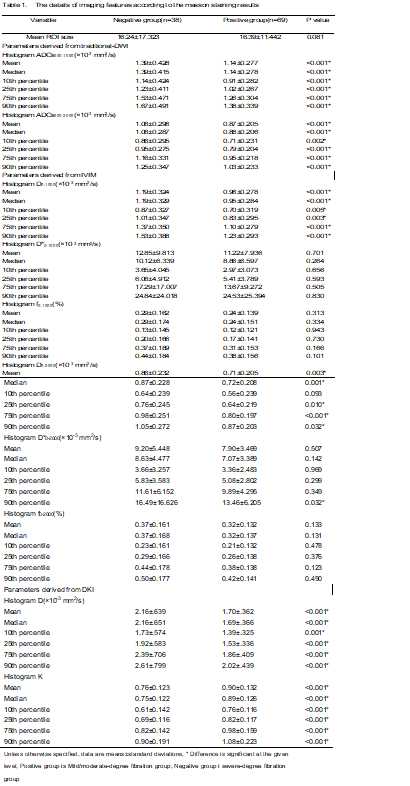
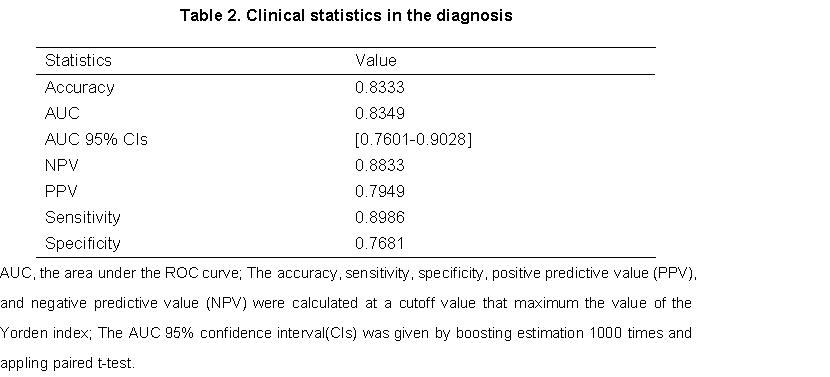
A total of 61 features were calculated in this study (Table 1). We found that the model based on 6 features returned the highest AUC results on the validation dataset (Figure 1). The AUC and the accuracy could achieve 0.835 and 0.833, respectively (Figure 2). The clinical statistics of the radiomics model was summarized in Table 2. The selected features and their corresponding weights in the developed model were listed in Table 3.Discussion
Our findings demonstrated that the radiomics features based on multi-diffusion-parameters could be used to grade bowel fibrosis of CD patients. The highest prediction accuracy was acquired by incorporating the following 6 features into a nomogram: the DKI-related histogram parameters (mean D, mean K, 10th percentiles of K) and IVIM-related parameters (mean D0-2000, mean D*0-2000, 90th percentiles of f). Our results indicated that selected key features achieved an excellent classifying performance. Moreover, the results confirmed the findings in previous works that IVIM and DKI model showed high potential in grading of intestinal fibrosis of CD.Conclusion
We developed and validated an effective radiomics model for grading intestinal fibrosis of Crohn's disease. Our results suggested that combining DKI and IVIM parameters in the radiomics model could improve the accuracy of bowel fibrosis grading.Acknowledgements
We acknowledge Siemens Healthcare for their support of the project.References
1. Rimola J, Planell N, Rodríguez S, et al. Characterization of inflammation and fibrosis in Crohn's disease lesions by magnetic resonance imaging. American Journal of Gastroenterology 2015, 110:441-3.
2. Zhang Y, Wang Q. The Histogram Analysis of Diffusion-Weighted Intravoxel Incoherent Motion (IVIM) Imaging for Differentiating the Gleason grade of Prostate Cancer. European Society of Radiology, 2014, DOI 10.1007/s00330-014-3511-4.
3. Sheng R F, He Q W, Li Y, et al. Diffusion kurtosis imaging and diffusion-weighted imaging in assessment of liver fibrosis stage and necroinflammatory activity. Abdominal Radiology 2016, 42(4):1-7.
4. França M, Martí-Bonmatí L, Alberich-Bayarri Á, et al. Evaluation of fibrosis and inflammation in diffuse liver diseases using intravoxel incoherent motion diffusion-weighted MR imaging. Abdominal Radiology 2016:1-10.
5. Liu Z , Wang Y et al. Radiomics analysis allows for precise prediction of epilepsy in patients with low-grade gliomas. NeuroImage, 2018, 19:271-278.
6. Aerts HJ, Velazquez ER et al. Decoding tumour phenotype by noninvasive imaging using a quantitative radiomics approach. Nat Commun. 2014. Doi: 10.1038/ncomms5006.
7. Huang YQ, Liang CH, et al. Development and Validation of a Radiomics Nomogram for Preoperative Prediction of Lymph Node Metastasis in Colorectal Cancer. J Clin Oncol., 2016, 34(18):2157-64.
8. Nie K, Shi L et al. Rectal Cancer: Assessment of Neoadjuvant Chemoradiation Outcome based on Radiomics of Multiparametric MRI. Clinical cancer research, 2016, 22(21):5256-5264.
Figures