0354
Diffusion kurtosis imaging in quantitative diagnosis of nonalcoholic fatty liver disease: a rabbit model study1Department of radiology, Clinical Medical School of Yangzhou University, Northern Jiangsu People’s Hospital, Yangzhou, China, 2XiangYa school of medicine, Central South University, Changsha, China, 3GE Healthcare,MR Research China, beijing, China
Synopsis
We aimed to investigate if diffusion kurtosis imaging (DKI) can be applied to assess nonalcoholic fatty liver disease (NAFLD) by providing fractional anisotropy (FA), mean diffusion (MD) and mean kurtosis (MK). We used DKI derived parameters to analyze NAFLD in a rabbit model and compared them with the apparent-diffusion-coefficient (ADC) from a mono-exponential diffusion-weighted imaging model. While FA showed comparable results with the severity of NAFLD group, MD and MK indicated more robust performance in the diagnosis of nonalcoholic steatohepatitis (NASH) compared with ADC. We therefore demonstrated that DKI had potential in stratifying NAFLD and early diagnosis of NASH.
Introduction
Nonalcoholic fatty liver disease (NAFLD) is the most common diffusion liver disease worldwidely. It can be divided into simple steatosis (NAFL) and nonalcoholic steatohepatitis. Diffusion-weighted imaging (DWI), capable of estimating liver fibrosis and inflammation, has been applied in NAFL disease1. Assuming a Gaussian distributed diffusion of water molecule, the resultant apparent-diffusion-coefficient (ADC) showed an inverse relation with liver fat content. In comparison, diffusion kurtosis imaging (DKI), measuring non-Gaussian distribution of water diffusion and characterizing the complexity of micro-environment, was assumed to have potential for more accurate water diffusion than DWI2,3. However, to our knowledge, no study has investigated this in the assessment of NAFLD.Therefore, this study aimed to explore the feasibility of DKI in the diagnosis of NAFLD. The corresponding DKI-derived parameters were compared with ADC obtained from conventional DWI.Animal Model
Thirty-two male New Zealand rabbits were divided into 5 groups (2.5kg each). Six rabbits (group 1) were fed a standard diet for 3 weeks. Twenty-six rabbits in other 4 groups were fed a high fat and high cholesterol diet (i.e., six with high fat diet for 1 week, six with high fat diet for 3 weeks, six with high fat diet for 4 weeks and eight with high fat diet for 8 weeks ).MRI experiment
All MRI experiments were performed on a 3.0 T clinical scanner (Discovery 750w, GE Healthcare, USA) equipped with a GEM-flex 16-chanels surface-coil. DWI and DKI were measured. For DWI, the scan parameters included: repetition time/echo time 2500/77.4ms, matrix 128×128, slice thickness 3.0 mm, and field-of-view (FOV) 15.0 mm×10.0 mm. The chosen b values were 0 and 600 sec/mm2. The acquisition time was 1 minute 25 seconds.DKI was performed by using three b values (0, 400, 800sec/mm2) with 15 diffusion directions for each b value. Other scan parameters were repetition time 2500msec, echo time 77.4msec, matrix 128×128, slice thickness 3.0mm, slice space 0.3mm and FOV 15.0mm×10.0mm. The scan time was 2 minute 38 seconds.Imaging Analysis
All data were processed at a GE workstation (AW 4.6 GE Medical Systems).
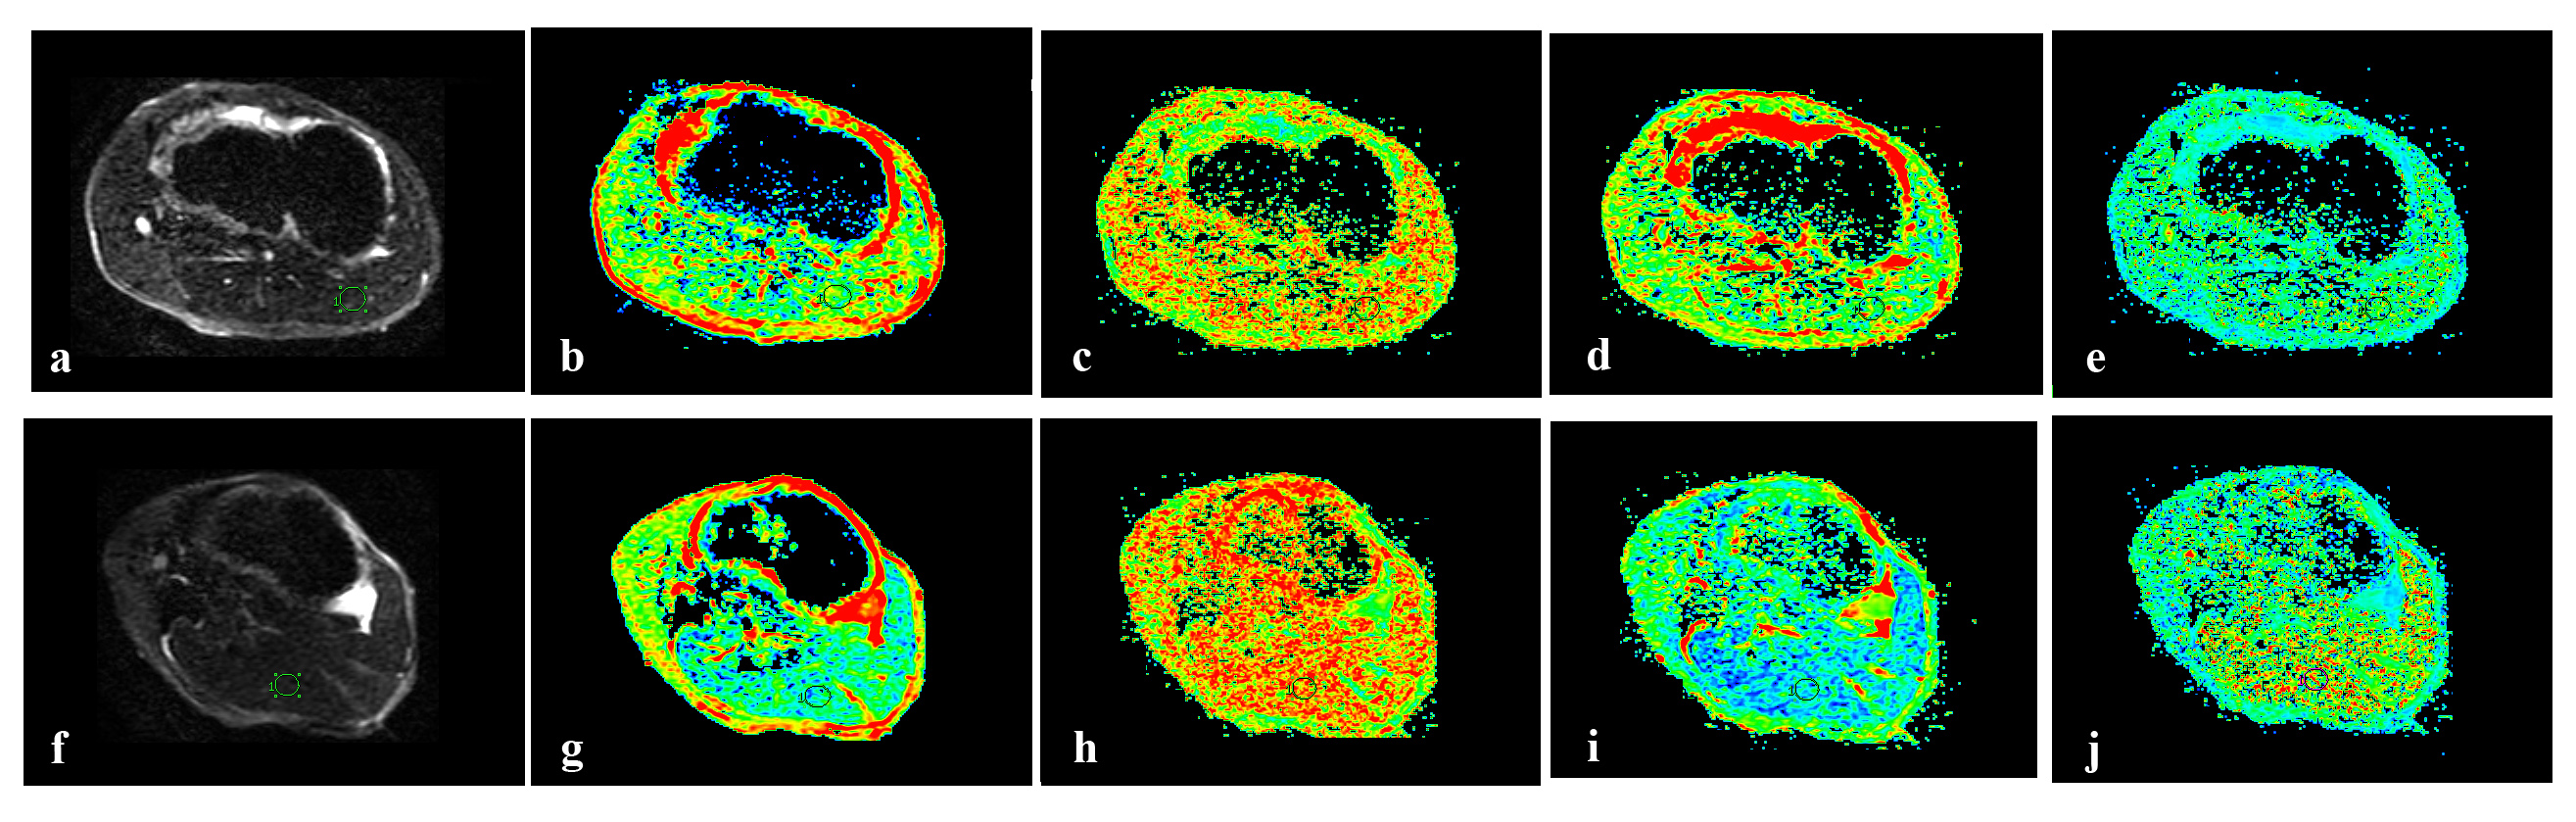
The acquired DKI images were fitted voxel-by-voxel using equation 1: S=S0·exp(-b·D+b2·D2 · k/6). [Eq.1], where b is the applied b value, D represents the apparent diffusion coefficient derived from non-Gaussian diffusion and K represents apparent kurtosis coefficient. The resultant parametric maps representing mean kurtosis (MK), fractional anisotropy (FA) and mean diffusion (MD) were thus obtained.
For comparison, the ADC values were calculated from a mono-exponential diffusion-weighted imaging model as follows: S(b)/S(0)=exp(-b·ADC). [Eq.2], where S(0) and S(b) represent the signal intensities with and withot diffusion sensitization.
Histological analysis
Liver samples were obtained and specimens were stained with haematoxylin-eason and Masson’s trichrome. In histologic analysis, livers were categorized as normal (NAS=0), simple-steatosis (NAS=1,2), borderline (NAS=3,4) and NASH (n≥5) according to NASH CRN-NAS scoring system.Statistical Analysis
All statistical analyses were performed using SPSS software version-21.0. Diffusion parameters (ADC, FA, MD and MK) between different groups of NAFLD were compared by one-way-analysis-of-variance, and least-significant-difference-test was utilized for post-hoc analysis. Spearman rank correlation analysis was used to estimate the correlation between ADC, FA, MD and MK with the severity of NAFLD. In addition, characteristic-operating-curve (ROC) was applied to evaluate the diagnostic efficiency of ADC, FA, MD and MK for NASH. The threshold of significance was set as P=0.05.Results
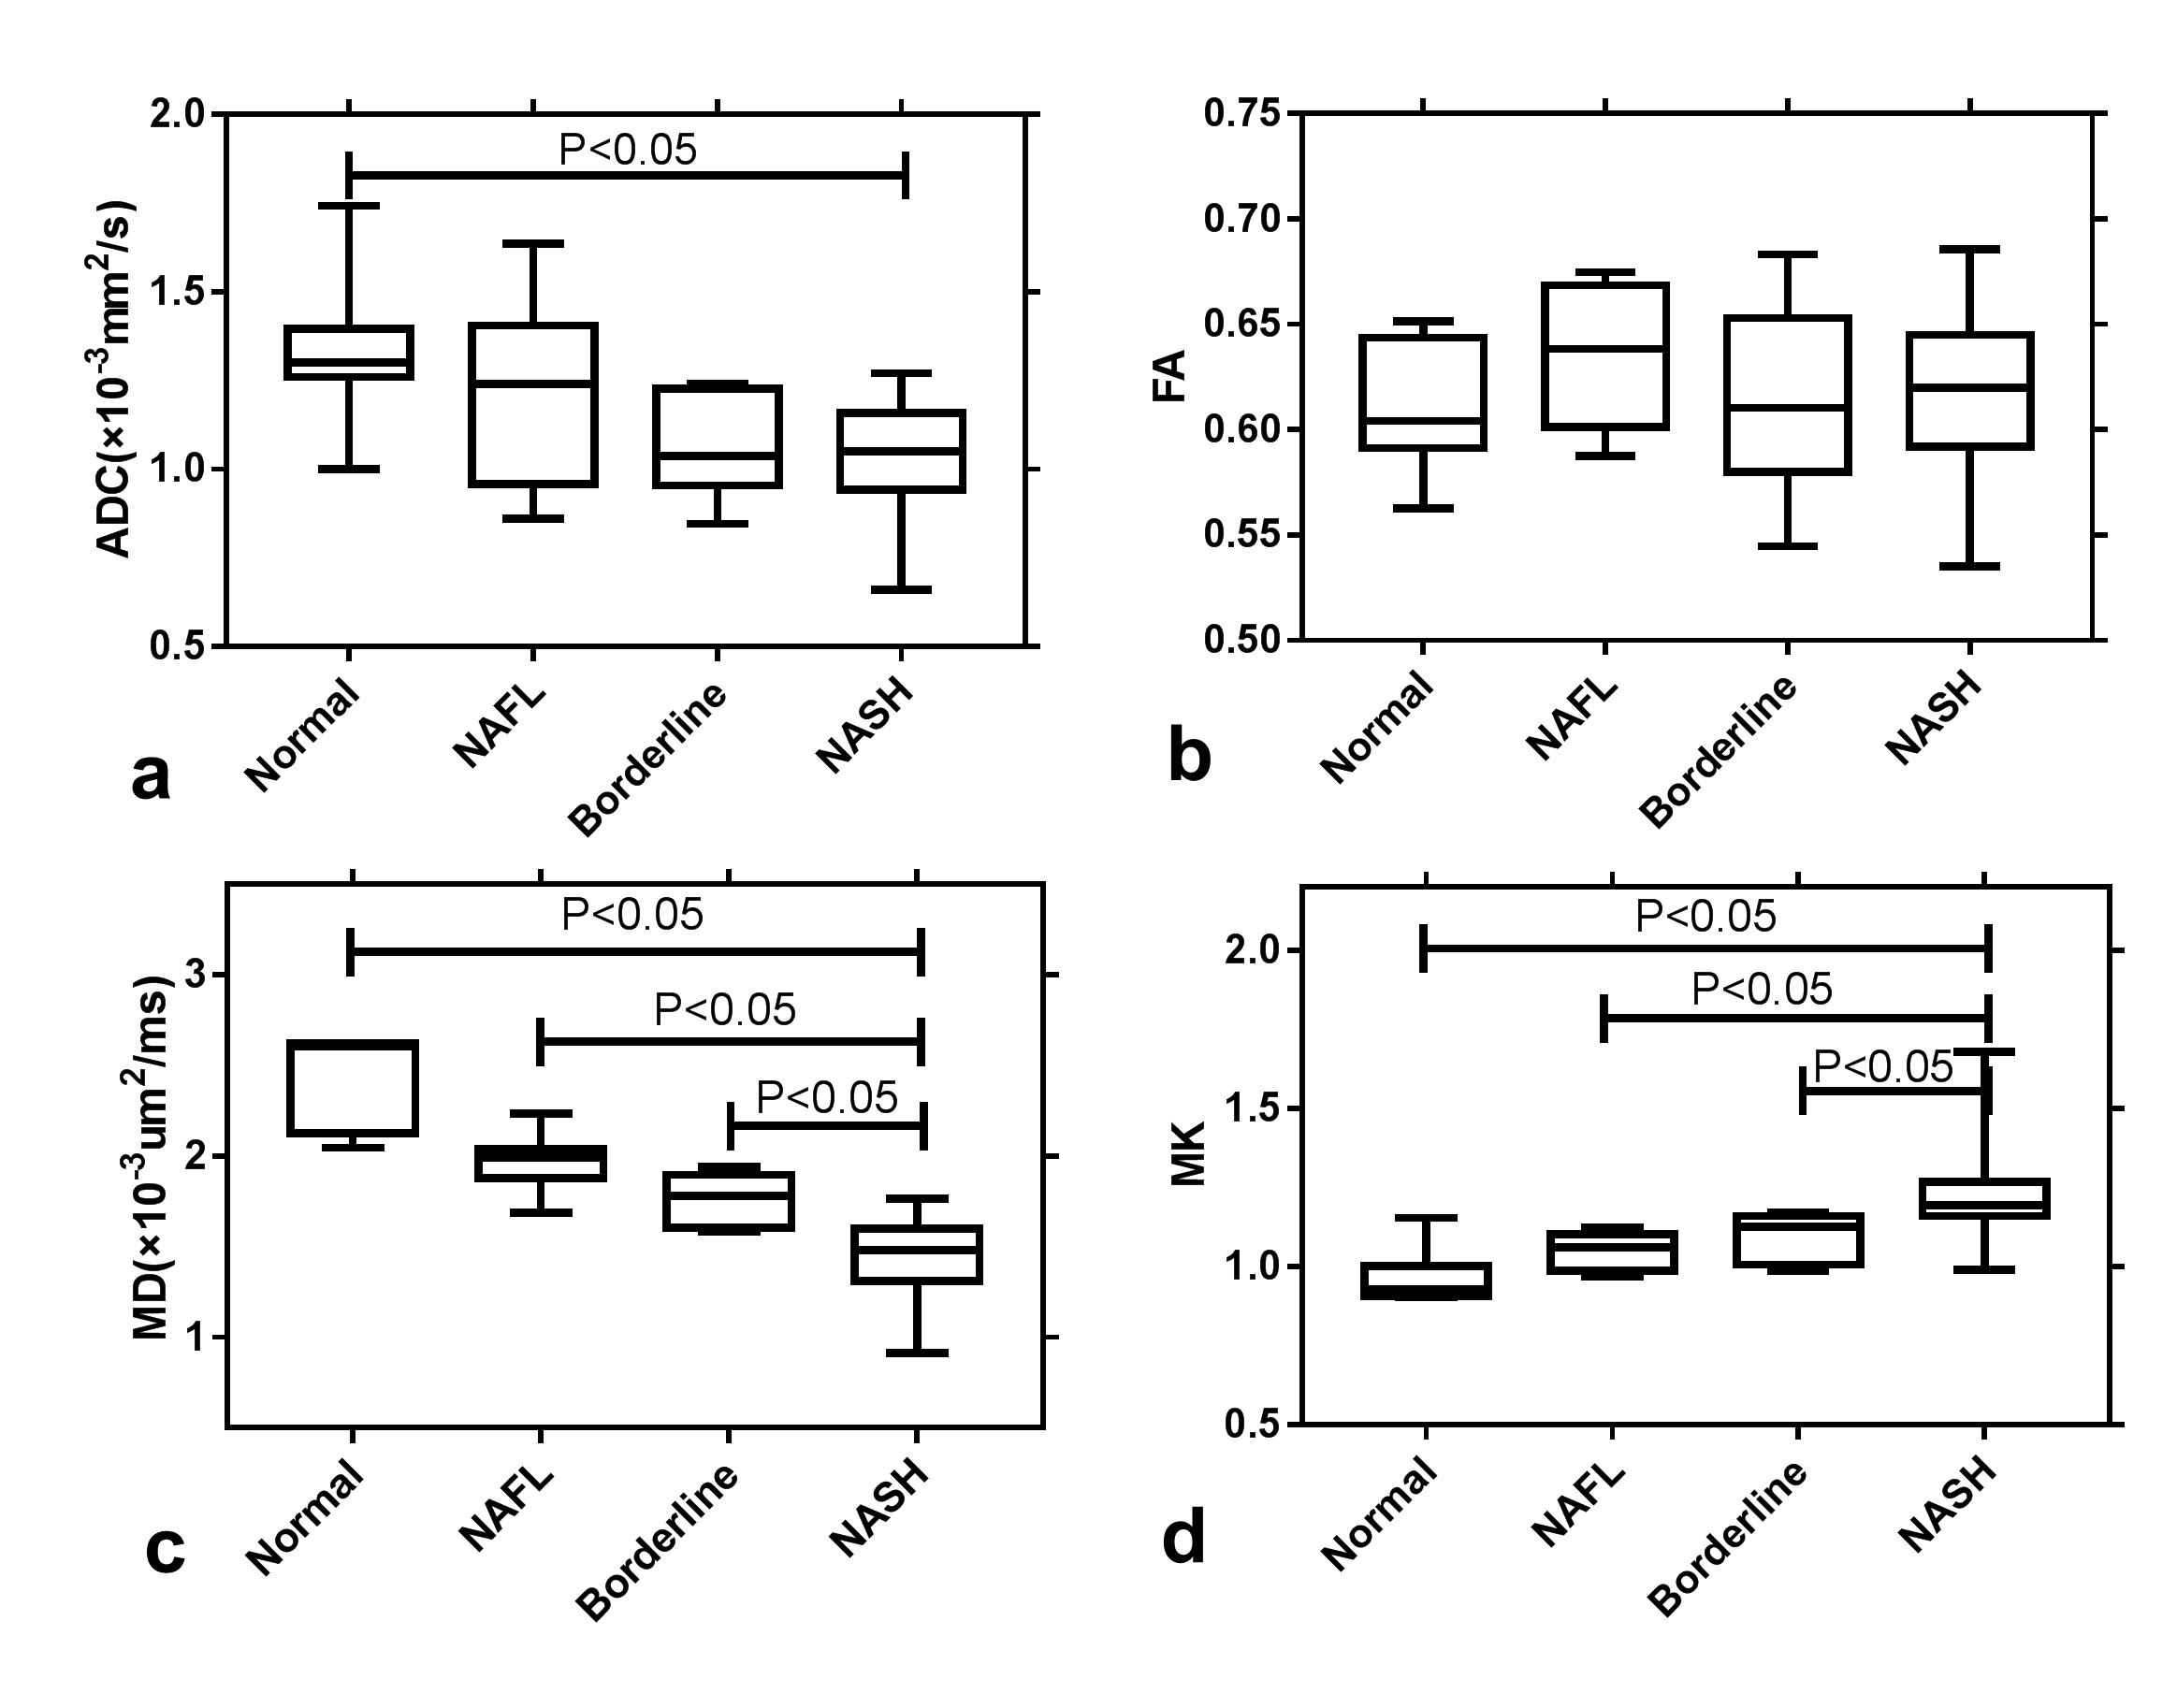
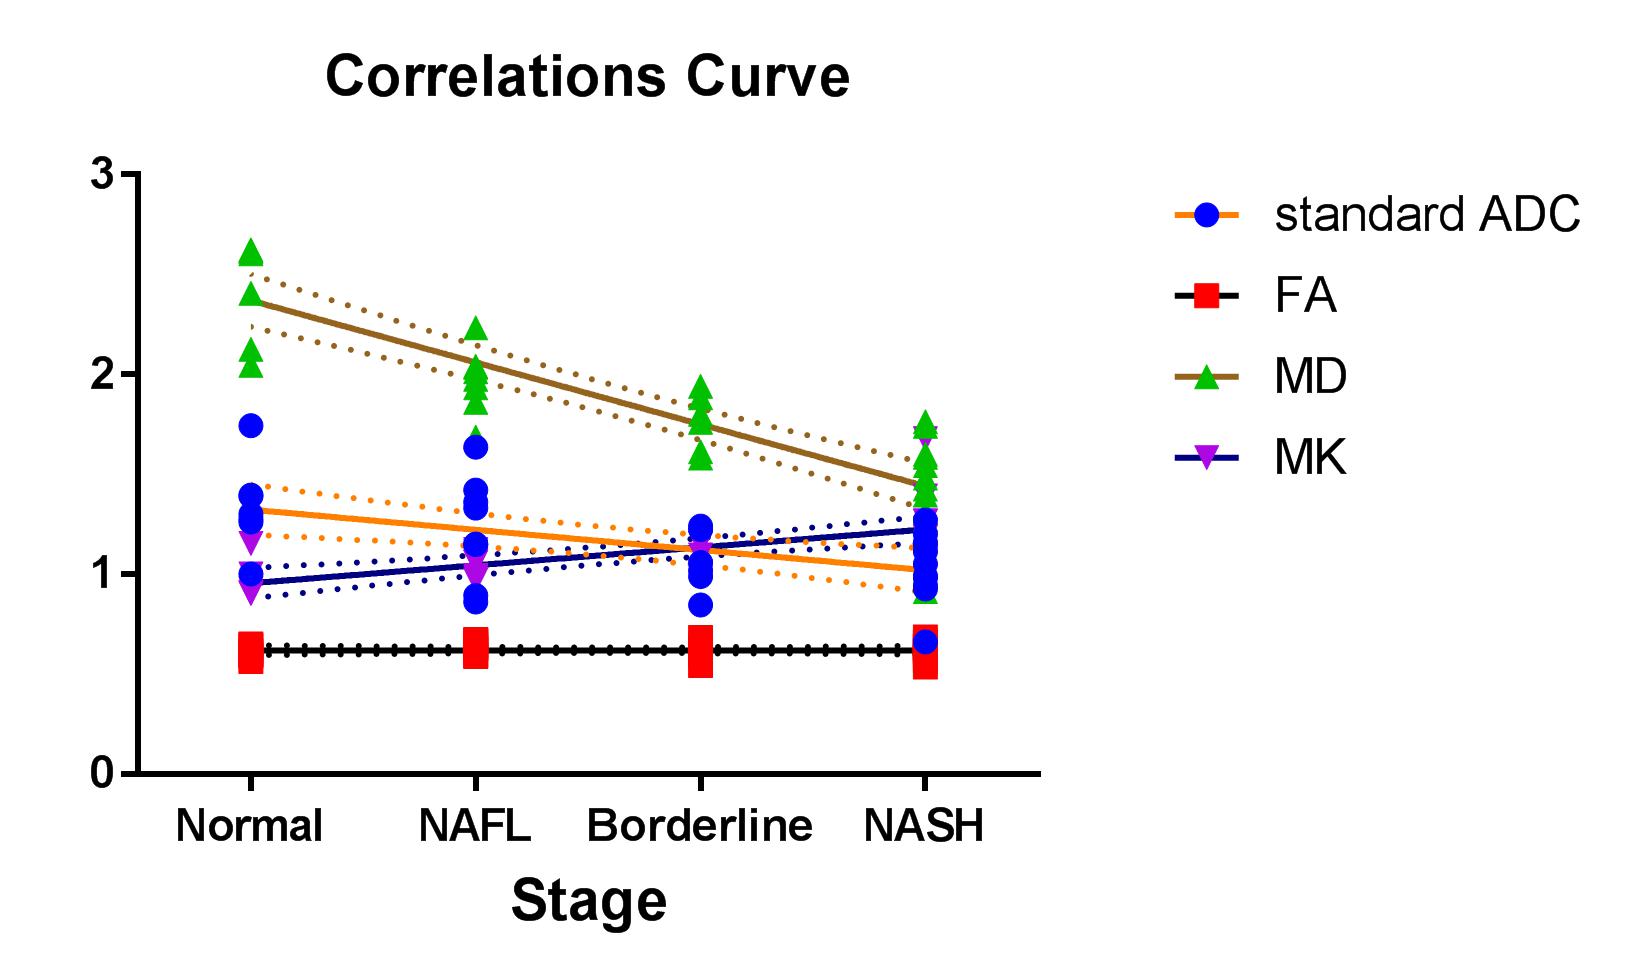
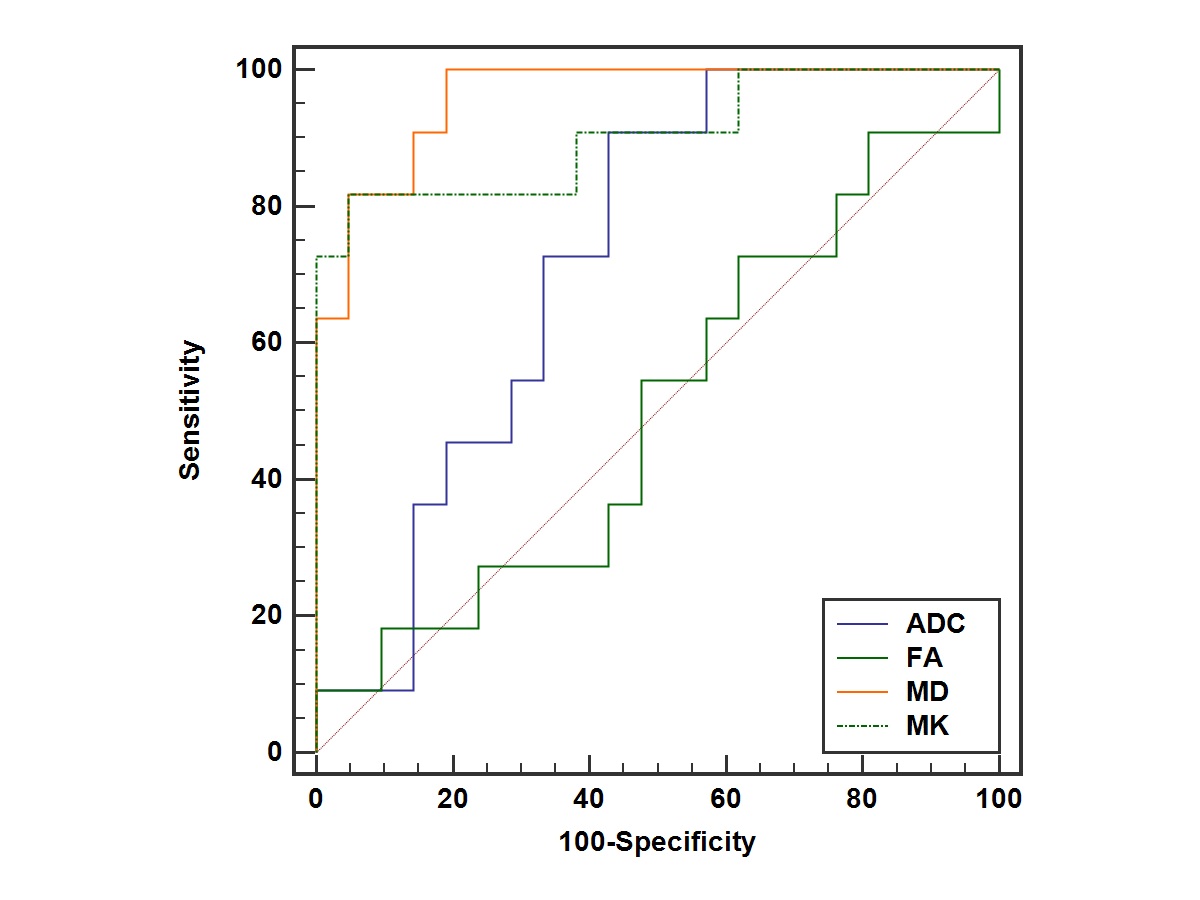
Both ADC and MD showed inverse relation (P<0.05) with the severity of NAFLD, and a positive relation (P<0.05) was found between MK and the severity of NAFLD (Figs.1-3). The corresponding correlation coefficients were -0.529, -0.904, and 0.761. In addition, while FA showed comparable values among the NAFLD severity groups, MK and MD were significantly different (P<0.05) between borderline and NASH. In Fig.4, MK and MD showed significantly larger area-under--the-receiver-operating-characteristic-curve (AUC) values than ADC (MK:0.905; MD:0.961; ADC:0.727;P<0.05) in the differentiation of different NAFLD severe groups, indicating that DKI is more robust in the diagnosis for NASH relative to DWI.Discussion and conclusion
In this study, DKI was applied to assess the severity of NAFLD in a rabbit model. Comparing with the ADC from DWI model, the MD and MK parameters derived in DKI showed significantly larger AUC values in the differentiation of NASH from other less severe groups. As a severity stage of NAFLD is related to increased fat accumulation, narrowed sinusoidal, perivascular fibrosis or changed micro-structures, higher MK and lower MD manifested the aggravation of NAFLD4. Therefore, DKI model may yield an accurate assessment in NAFLD patient.In conclusion, we demonstrated that the DKI technique exhibits a great potential in the assessment of NAFLD and differentiating NASH from simple steatosis.Acknowledgements
Funded by the Youth Project from Department of Science and Technology of Jiangsu (BKM20160450); Top Six Talent Summit Project of Jiangsu Province Human Resources and Social Security Department (2016-WSN-277).References
1. Joo I, Lee JM, Yoon JH, Jang JJ, Han JK, Choi BI. Nonalcoholic Fatty Liver Disease: Intravoxel Incoherent Motion Diffusion-weighted MR Imaging-An Experimental Study in a Rabbit Model. Radiology 2014;270(1):131-140.
2. Anderson S, Barry B, Soto J, Ozonoff A, O'Brien M, Jara H. Characterizing non-gaussian, high b-value diffusion in liver fibrosis: Stretched exponential and diffusional kurtosis modeling. Journal of magnetic resonance imaging : JMRI 2014;39(4):827-834.
3. Bai Y, Lin Y, Tian J, Shi D, Cheng J, Haacke E, Hong X, Ma B, Zhou J, Wang M. Grading of Gliomas by Using Monoexponential, Biexponential, and Stretched Exponential Diffusion-weighted MR Imaging and Diffusion Kurtosis MR Imaging. Radiology 2016;278(2):496-504.
4. Sheng RF, Wang HQ, Yang L, Jin KP, Xie YH, Chen CZ, Zeng MS. Diffusion kurtosis imaging and diffusion-weighted imaging in assessment of liver fibrosis stage and necroinflammatory activity. Abdominal Radiology 2016;42(4):1176-1182.
Figures