0351
Diffusion Time Dependence in the Evaluation of Choroid Plexus Cysts1Department of Radiology, Graduate School of Medicine, Juntendo University, Tokyo, Japan, 2Department of Radiology, Graduate School of Medicine, The University of Tokyo, Tokyo, Japan, 3Siemens Healthcare Japan KK, Tokyo, Japan, 4Siemens Healthcare GmbH, Erlangen, Germany
Synopsis
To obtain information regarding the internal structure of choroid plexus cysts (CPCs) that appear hyperintense on DWI, we investigated the ADC values acquired with a shorter diffusion time using an oscillating gradient spin-echo (OGSE). The ADC values for twenty-seven patients with CPCs were measured with effective diffusion time (Δeff) of 6.5 and 35.2 ms. The ADC values of CPCs were significantly higher at the Δeff of 6.5 ms than with Δeff of 35.2 ms. The dependence of ADC values on the diffusion time in CPCs suggested spatially restricted diffusion.
INTRODUCTION
Oscillating gradient spin-echo (OGSE) prototype sequences can shorten diffusion times by replacing the long-lasting diffusion-sensitizing gradients used in pulsed gradient spin-echo (PGSE) methods with rapidly oscillating gradients. Therefore, it is expected as a method to estimate the internal structures of lesions by change of the ADC values.1-3 Choroid plexus cysts (CPCs) are common, incidental, and almost invariably asymptomatic lesions. In general, a helpful feature is that they usually have an extremely high signal on diffusion-weighted imaging (DWI) because of the restricted motion of the water molecules due to the slightly higher protein content.4 However, the actual influence of the protein content or the size of the cyst wall on the high DWI signal is unknown. To estimate the internal structures of CPCs, we investigated the ADC values of CPCs scanned with shorter diffusion times on DWI with an OGSE sequence.
METHODS
MRI data from 27 patients were retrospectively analyzed. All subjects underwent scanning on a 3T MR scanner (MAGNETOM Prisma, Siemens Healthcare, Erlangen, Germany). DWI was performed with prototype sequences using b-values of 0 and 1000 s/mm2 and six uniformly distributed directions for both OGSE and PGSE acquisitions. OGSE using a trapezoid-cosine waveform was performed with an effective diffusion time (Δeff) of 6.5 ms (frequency = 30 Hz). PGSE sequences were performed with a Δeff of 35.2 ms. Other parameters for the OGSE and PGSE sequences were as follows: TR, 4800 ms; TE, 101 ms; FOV, 200 × 200 mm2; matrix size, 82 × 82; slice thickness, 5 mm; and acquisition time, approximately 2 minutes. Circular regions of interest (ROIs) were placed within the CPCs on ADC maps. As statistical analysis, the Shapiro-Wilk test was used to assess normality. We used the Wilcoxon signed-rank test to compare the ADC values of CPCs, WM, and CSF with Δeff values of 6.5 and 35.2 ms.RESULTS
A representative case of CPCs is shown in Figure 1. The CPCs showed high intensity in the lateral ventricles on DWI using PGSE (Figure 1A). Meanwhile, the CPCs showed decreased visualization on DWI using OGSE (Figure 1B). The ADC values of the CPCs appear higher at short Δeff, values in comparison with those at long Δeff values (Figure 1C, D). The mean ADC values and the rate of change of CPCs, WM, and CSF by ROI analysis are shown in Table 1. The ADC values of CPCs and WM were significantly higher on OGSE, compared with those on PGSE. The ADC values of CSF were significantly lower on OGSE, compared with those on PGSE. The ADC values of CPCs were lower than the ADC values of CSF on PGSE and OGSE.DISCUSSION
The ADC values of CPCs were higher at the shorter Δeff of 6.5 ms. This diffusion time-dependence suggests spatially restricted diffusion, consistent with pathological findings. Previous pathological reports have shown that CPCs consisted of 50 × 75 μm2 columnar epithelium.5 Mean square distances of water molecule movement for diffusion times of Δeff = 6.5 ms and 35.2 ms are 10.8 μm and 25.1 μm, respectively, at body temperature. Both were smaller than 50 μm, and the influence of spatially restricted diffusion of the wall could be small. However, our results showed that the ADC values of CPCs were higher at the shorter Δeff of 6.5 ms. The influence of spatially restricted diffusion of the wall is larger at the longer Δeff of 35.2 ms and smaller at the shorter Δeff of 6.5 ms. In addition, it is also presumed the presence of cyst walls with distances smaller than 50 μm as well as the influence of interstitial tissues and cystic components. Moreover, the ADC values of CPCs were lower than those of CSF at Δeff values of 35.2 ms and 6.5 ms, and the difference in ADC values between CPCs and CSF was smaller at the shorter Δeff. This suggests that the influence of the spatially restricted diffusion becomes more important with longer Δeff values. If we can perform investigations with Δeff values smaller than 6.5 ms and eliminate the influence of spatially restricted diffusion, we can confirm the ADC values due to the viscosity of CPCs.CONCLUSION
The observed diffusion time-dependence of ADC values in the CPCs suggests spatially restricted diffusion. The lower ADC values of the CPCs measured with short diffusion times in comparison with CSF suggest the presence of spatially restricted diffusion and increased viscosity of the cysts.Acknowledgements
No acknowledgement found.References
- Martin M. Measuring restriction sizes using diffusion weighted magnetic resonance imaging: a review. Magn Reson Insights 2013;6:59-64.
- Wu D, Martin LJ, Northington FJ, Zhang J. Oscillating gradient diffusion MRI reveals unique microstructural information in normal and hypoxia-ischemia injured mouse brains. Magn Reson Med 2014;72(5):1366-74.
- Does MD, Parsons EC, Gore JC. Oscillating gradient measurements of water diffusion in normal and globally ischemic rat brain. Magn Reson Med 2003;49(2):206-15.
- Cakir B, Karakas HM, Unlu E, Tuncbilek N. Asymptomatic choroid plexus cysts in the lateral ventricles: an incidental finding on diffusion-weighted MRI. Neuroradiology 2002;44(10):830-3.
- Shangshotti
S, Metsky M. Neuroepithelial cysts of the nervous system. Neurology
1966;16:887-903.
Figures
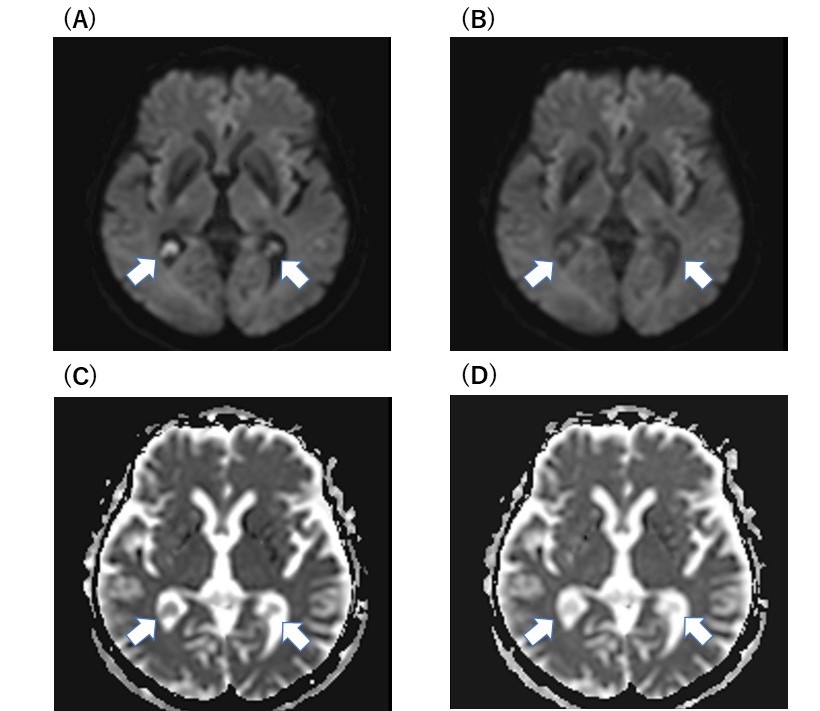
Figure 1. A case of choroid plexus cysts
The choroid plexus cysts showed high intensity in the lateral ventricles on DWI using PGSE with an Δeff of 35.2 ms (A). Meanwhile, the choroid plexus cysts showed decreased visualization on DWI using OGSE with an Δeff value of 6.5 ms (B). The ADC values of the choroid plexus cysts appear higher at short Δeff, values in comparison with those at long Δeff values (C, D).

Table 1. The mean ADC values of choroid plexus cysts, white matter (WM), and cerebrospinal fluid (CSF).
The ADC values of choroid plexus cysts and WM were significantly higher at the Δeff of 6.5 ms on OGSE, compared with those at the Δeff of 35.2 ms on PGSE. The ADC values of CSF were significantly lower at the Δeff of 6.5 ms on OGSE, compared with those at the Δeff of 35.2 ms on PGSE. The ADC values of choroid plexus cysts were lower than the ADC values of CSF at Δeff values of 35.2 and 6.5 ms.