0349
Gyri and sulci microstructural differences in the sheep brain during cortical folding assessed by diffusion MRI.1Service développement et croissance, Université de Genève, Genève, Switzerland, 2Laboratoire d'imagerie fonctionnelle et métabolique, Ecole polytechnique fédérale de Lausanne, Lausanne, Switzerland, 3The Ritchie Centre, Hudson Institute of Medical Research, Monash University, Clayton, Australia, 4School of Health and Biomedical Sciences, RMIT University, Bundoora, Australia
Synopsis
Despite a large number of studies assessing cerebral development, some of the events underlying folding of the cerebral cortex remain unclear, especially those concerning micro-architectural differences between outward (gyri) and inward (sulci) folds. The aim of this work was twofold: 1) depict cortical microstructure differences between gyri and sulci and 2) assess the potential of NODDI in the understanding of cortical folding. Gyri and sulci present different maturation timelines leading to microstructural differences. Diffusion imaging is a powerful tool to probe accurately these differences. These results are of high interest for the understanding of cortical folding process.
Introduction
Cortical folding represents one of the most important event of cerebral development in humans and various mammalian species, as improper folding of the cortex has been associated with a myriad of clinical implications. Despite a large number of studies assessing cerebral development, some of the events underlying folding of the cerebral cortex remain unclear, especially those concerning micro-architectural differences between outward (gyri) and inward (sulci) folds. Nonetheless, in humans cortical fiber density in gyri appeared higher than in sulci between 0 and 2 years of age [1], but the microstructural differences that arise in utero, when the main changes in cortical folding occur in humans and other species, are yet to be addressed. Pre-clinical studies at ultra-high magnetic field allow to push the image resolution in order to probe more accurately the intrinsic cortical differences and help on the understanding of cortical folding. Diffusion tensor imaging (DTI) has been widely used to assess brain microstructure but recently new diffusion imaging models including Neurite Orientation Dispersion and Density Imaging (NODDI) have been proposed to provide more tissue-specific parameters such as intra-neurite volume fraction and orientation dispersion index. In this work we used high image and angular resolutions DTI and NODDI at 9.4T to assess cortical microstructural differences between sulci and gyri in the developing sheep brain during cortical folding, as the timing of cortical folding process of sheep resembles human development. The aim of this work was twofold: 1) depict cortical microstructure differences between gyri and sulci and 2) assess the potential of NODDI in the understanding of cortical folding.Materials and methods
Sheep brains were collected at 98 days of gestation (d98, n = 3). MR
experiments were performed on an actively-shielded 9.4T/31cm magnet (Agilent)
equipped with 12-cm gradient coils (400mT/m, 120µs) with birdcage coil of 3.5cm
diameter. A multi-b-value shell protocol was acquired using a spin-echo sequence
with the following parameters: FOV: 30×25mm2, matrix size: 116×148, 20
slices of 1mm thickness in the axial plane, resolution 234×260×1000 µm3,
4 averages with TE/TR = 45/3000ms. 96 DWI were acquired, 15 as b0 reference
images and 81 separated in 3 shells (non-collinear and uniformly distributed in
each shell) with the following distribution (# of directions/b-value in s/mm2
with δ/Δ = 5.5/30ms): 21/1750, 30/3400 and 30/5100). Acquired data were fitted
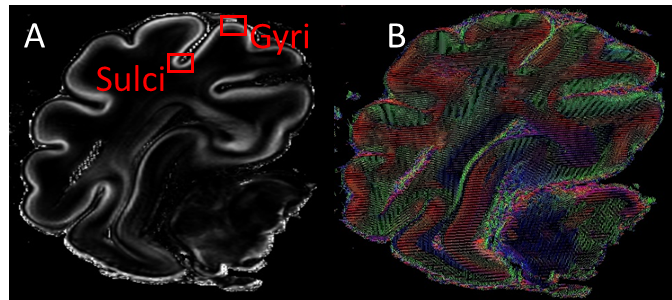
using the NODDI toolbox [2] including an isotropic restricted compartment for ex-vivo imaging. NODDI estimates were measured in the sulci and the
gyri of the cortex (Figure 1) at different image planes. Indeed, microtubule
associated protein 2 (MAP2) staining was performed as neurite outgrowth marker
and more specifically dendrogenesis
marker at d90. For
statistics, a two-way ANOVA test was used (significance: P<0.05).Results
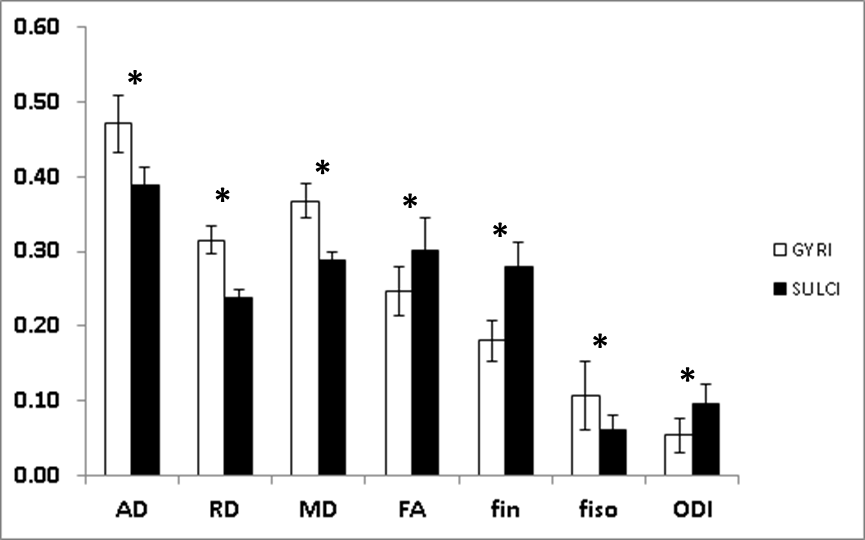
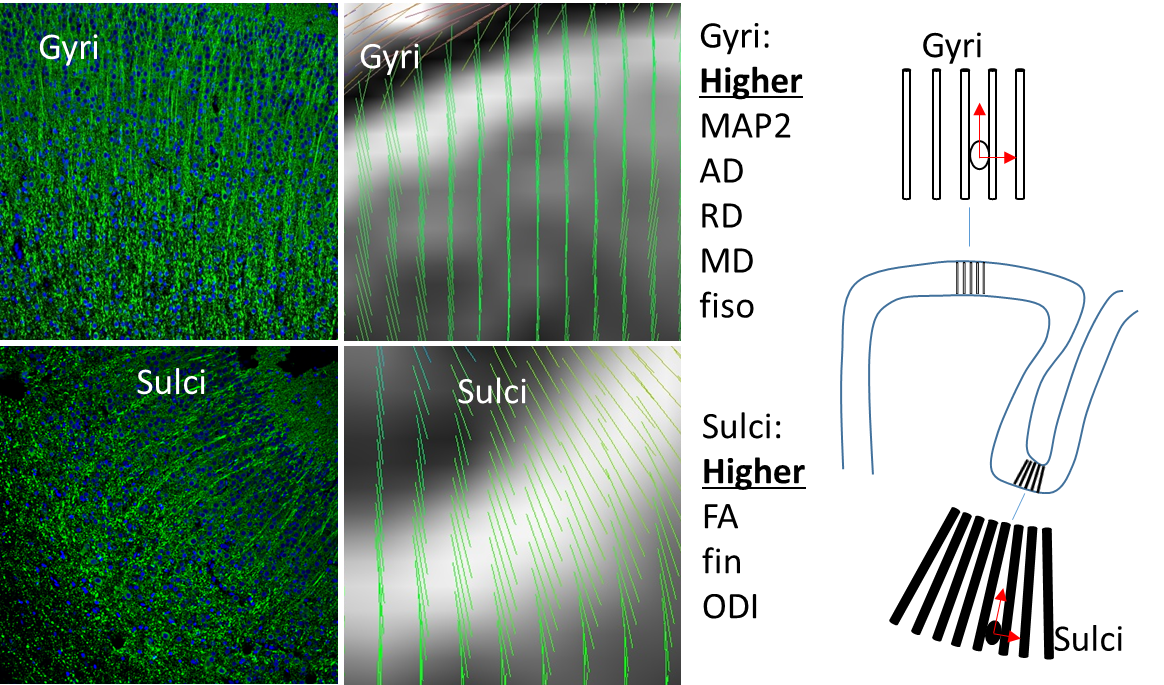
DTI and NODDI derived parameters are presented in Figure 2. Diffusivity values (i.e. axial, radial and mean) as well as fiso were found significantly larger in gyri than sulci (P<0.0001 for diffusivities and P=0.0088 for fiso). In the other hand, FA, fin and ODI were significantly lower in gyri compared to sulci (P=0.0093 for FA, P<0.0001 for fin and P=0.0022 for ODI). At d90, MAP2 analyses (Figure 3) showed major differences between gyri and sulci, showing consistently higher MAP2 expression density in gyri than sulci (P<0.0001). A small but significant (P<0.05) reduction in cell density in gyri compared to sulci was observed.Discussion
Immunostaining results suggest differences in terms of development between gyri and sulci. MAP2 shows subcellular localization for dendrites and cell bodies and as such MAP2 results suggest a more mature cortical structure in gyri than sulci. As such, dendritic arborization should be more pronounced in gyri. Reduction of cell density in gyri depicts more cellular dispersion. Interestingly these different developmental stages are clearly characterized by DTI and NODDI. Diffusion results suggest that, in gyri density of neurites is lower leading to a larger inter-neurite space depicted by higher diffusivity and isotropic volume as well as FA reduction despite more dendrites. In sulci a larger density of neurites (matching with increase of cell density) was observed (lower inter-neurite space) but more dispersed as depicted by higher ODI. ODI discrepancies could be also due to the curvature of the sulci more pronounced than in gyri. Eigenvector images match well with this explanation. A putative illustration of these microstructure differences can be found in figure 3.Conclusion
Gyri and sulci present different maturation timelines leading to microstructural differences. Diffusion imaging is a powerful tool to probe accurately these differences. These results are of high interest for the understanding of cortical folding process.Acknowledgements
Supported by the Fond national Suisse, the CIBM of the UNIL, UNIGE, HUG, CHUV, EPFL, Leenards and Jeantet foundation.References
[1] Spatiotemporal patterns of cortical fiber density in developing infants, and their relationship with cortical thickness. Li G, Liu T, Ni D, Lin W, Gilmore JH, Shen D. Hum Brain Mapp. 2015 Dec;36(12):5183-95.
[2] NODDI: practical in vivo neurite orientation dispersion and density imaging of the human brain. Zhang H, Schneider T, Wheeler-Kingshott CA, Alexander DC. Neuroimage. 2012 Jul 16;61(4):1000-16.
Figures