0348
Using microstructure informed tractography to reduce discrepancy in the density of structural connectomes. An application to Multiple Sclerosis.1Department of Computer Science, University of Verona, Verona, Italy, 2DINOGMI, University of Genoa/IRCCS AOU San Martino-IST, Genoa, Italy, 3Department of Neurology, Icahn School of Medicine at Mount Sinai, New York, NY, United States
Synopsis
Graph theory is a valuable framework to study brain connectivity and has been widely applied to investigate pathological conditions such as Multiple Sclerosis (MS). However, differences in topology between groups of subjects could be affected by discrepancy in density. Here we propose to use microstructure informed tractography to directly account for such density differences and provide a fair comparison between MS patients and healthy subjects. Our results show the capability of the proposed method to control for density and support the appropriateness of global efficiency and clustering coefficient for the characterization of comprehensive functions such as cognition in MS.
Purpose
Graph theory is a valuable framework to study brain connectivity and has been widely applied to investigate neurological conditions such as Multiple Sclerosis (MS). However, especially when comparing healthy subjects with patients affected by brain diseases, graph measures may be influenced by the discrepancy in density1,2. In the case of structural connectomes this discrepancy can be related to the known biases in tractography3. Even though it is known that reducing this effect will highlight the true differences in graph’s topology between groups of subjects, up to date there is no common strategy to deal with this issue. Here we propose to use microstructure informed tractography to directly account for such density differences and provide a fair comparison between MS patients and healthy subjects (HC).Methods
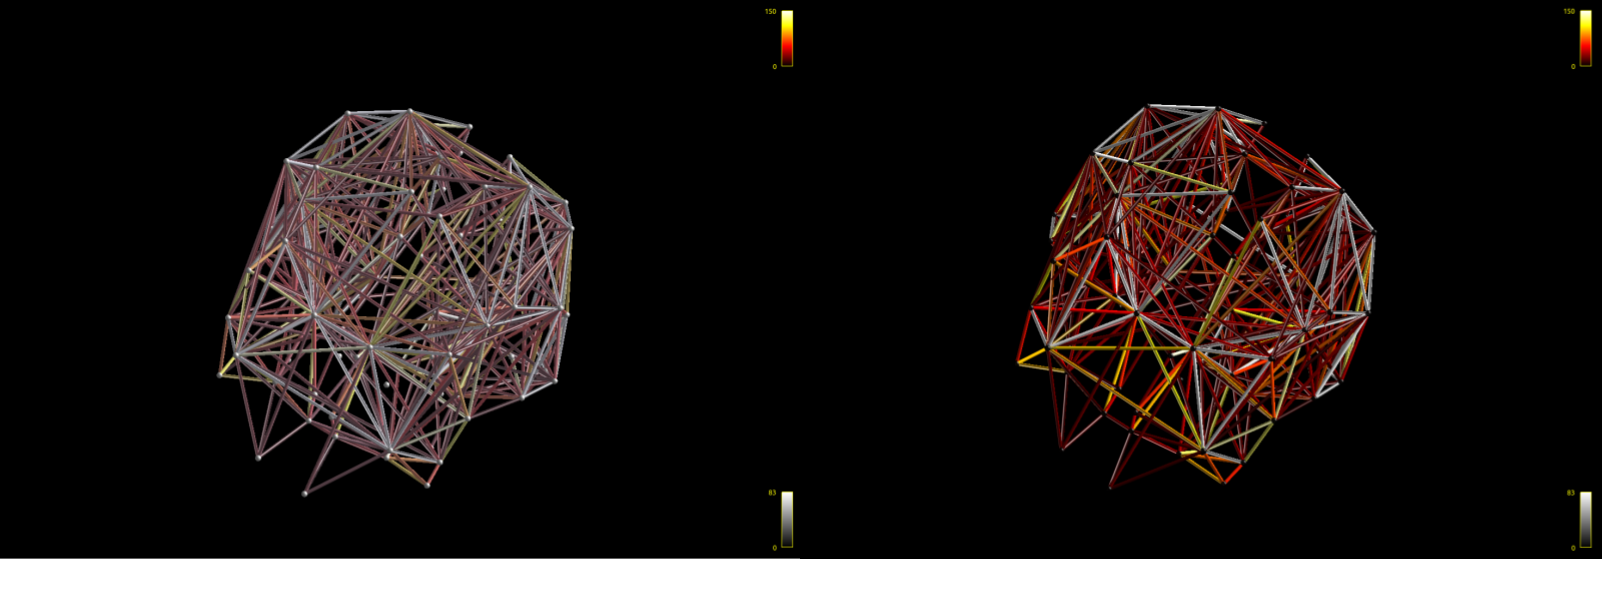
24 Progressive MS (P-MS) patients (16F, mean age $$$54.8\pm9.3$$$ years), and 18 healthy controls (HC) (8F, mean age $$$50.4\pm7.9$$$years) were prospectively enrolled. All subjects underwent MRI on a Siemens Skyra 3T including: 3D T2-weighted image and T1-weighted magnetization-prepared rapid gradient echo (MPRAGE) image with voxel size $$$1x1x1mm^3$$$, and a Diffusion Kurtosis Imaging (DKI) sequence with b-values of $$$1000,2000s/mm^2$$$ and 30 directions each in addition to $$$b=0s/mm^2$$$ images and voxel size of $$$2x2x2mm^3$$$. For the MS patients, white matter (WM) lesions were outlined on T2-W and T1-W images and a lesion filling was applied on T1-W images to perform tractography with ACT4. DKI images were corrected for motion and eddy currents and used to perform tractography with iFOD2 algorithm5 implemented in MRtrix3. COMMIT6,7 with cylinder and zeppelin ball model8 was then applied to the tractograms of each subject to filter out eventual false-positives connections9 and obtain the total intra-axonal signal fraction (IASF) associated to each streamline. For each subject, the connectomes were built using standard FreeSurfer Desikan-Killiany parcellation and by considering the total amount of IASF associated to each bundle instead of the traditional number of streamlines connecting two cortical regions of interest (fiber count)10. After controlling for age and gender, HC and P-MS were compared in terms of the following global network measures: global efficiency (GE, reflecting the efficiency in the information’s exchange), clustering coefficient (CC, reflecting the degree to which the nodes tend to cluster together), modularity (reflecting the segregation of the network), and density (describing the portion of the potential connections that are actual connections). To directly account for eventual discrepancies in density, we repeated the between-group comparison also accounting for this quantity. Global network measures that showed differences between P-MS and HC were tested for correlation with measures of motor disability (Expanded Disability Status Scale-EDSS, 25-foot walk test-25FWT, 9-hole peg test of both dominant and non-dominant hand-9HPTDH and 9HPTNDH) and global cognitive function (symbol digit modalities test-SDMT) correcting for age, gender, disease duration and density. Correlations with SDMT scores were further adjusted for years of education.Results and Discussion
Results of the between-group comparison are reported in Table 1. As expected, the presence of lesions in P-MS patients, that likely affect tractography, is reflected in a significant higher density in HC than in P-MS (p=0.044). Nevertheless, this difference is mitigated by the fact that COMMIT filters out streamlines that are not necessary to explain the signal, and associates to each streamline kept its own amount of IASF. Investigating the connectome’s global properties after controlling for age, gender and discrepancies due to density, we found significantly higher GE and CC in HC than in P-MS (p=0.001 and p=0.003 respectively) (Table 1). Partial correlations of these 2 global measures with clinical scores of motor disability did not show any significant results (Table 2), probably because of the anatomical segregation of motor functions to specific regions, whose properties are not adequately characterized by global measures. An indirect confirmation of such speculation derives from the partial correlation identified between both GE and CC and SDMT (r=0.530, p=0.024 and r=0.619, p=0.006 respectively), which represents a measure of information processing speed and attention requiring the integrity of several regions pertaining to different functional networks11.Conclusions
For the first time we employed COMMIT to construct microstructure-informed structural connectomes and derive graph global measures. After controlling for the effect of density we were still able to identify differences in topology between HC and P-MS patients. Finally, our results support the appropriateness of global graph measures like GE and CC for the characterization of comprehensive functions such as cognition, while the identification of the network disruption responsible for more specific deficits likely requires a subnetwork analysis.Acknowledgements
This study was supported in part by the National Multiple Sclerosis Society (NMSS RG 5120A3/1).References
1 - A. Fornito, A. Zalesky, E.T. Bullmore. Chapter 11, Statistical Connectomics. Fundamentals of Brain Network Analysis. Academic Press, 2016.
2 - B. C. M. van Wijk, C.J. Stam, A. Daffertshofer. Comparing Brain Networks of Different Size and Connectivity Density Using Graph Theory. PLoS One, 5(10): e13701, 2010
3 - G. Girard, K. Whittingstall, R. Derische, M. Descoteaux. Towards quantitative connectivity analysis: reducing tractography biases. NeuroImage, 98:266-78, 2014
4 - R. E. Smith, J.-D. Tournier, F. Calamante, A. Connelly. Anatomically-constrained tractography: Improved diffusion MRI streamlines tractography through effective use of anatomical information. NeuroImage, 62:1924-1938, 2012
5 - J.-D. Tournier, F.; Calamante, A. Connelly. Improved probabilistic streamlines tractography by 2nd order integration over fibre orientation distributions. Proc. Int. Soc. Magn. Reson. Med. 18, 1670, 2010
6 - A. Daducci, A. Dal Palù, A. Lemkaddem and J.P. Thiran. A convex optimization framework for global tractography. In Proc. IEEE ISBI, 524–7, 2013
7 - A. Daducci, A. Dal Palù, A. Lemkaddem, J.P. Thiran. COMMIT: Convex Optimization Modeling for Microstructure Informed Tractography, IEEE Trans. Med. Imaging., 33:246-57, 2014
8 - D.C. Alexander, P.L. Hubbard, M.G. Hall, E.A. Moore, M. Ptito, G.J. Parker, T.B. Dyrby. Orientationally invariant indices of axon diameter and density from diffusion MRI. NeuroImage, 52:1374-89, 2010
9 - A. Daducci, M. Barakovic, G. Girard, M. Descoteaux, and J.P. Thiran. Reducing false positives in tractography with microstructural and anatomical priors. Proc. Int. Soc. Magn. Reson. Med. 26, 0038, 2018
10 - D.K. Jones, T.R. Knösche, R. Turner. White matter integrity, fiber count, and other fallacies: The do's and don'ts of diffusion MRI. NeuroImage, 73: 239-254, 2018
11 - M. Petracca, C. Saiote, H.A. Bender, F. Arias, C. Farrell, P. Magioncalda, M. Martino, A. Miller, G. Northoff, F. Lublin, M. Inglese. Synchronization and variability imbalance underlie cognitive impairment in primary-progressive multiple sclerosis. Sci Rep., 7: 46411 2017
Figures