0347
Topological reorganizations of the white matter structural networks in early blind adolescents1Department of Radiology, Shenzhen Mental Health Center, Shenzhen Kangning Hospital, Shenzhen, China, 2Department of Mechanical Engineering, Sungkyunkwan University, Suwon, Korea, Republic of, 3GE Healthcare, MR Research China, Beijing, China, 4Medical Imaging Center, the First Affiliated Hospital of Jinan University, Guangzhou, China
Synopsis
Previous neuroimaging studies have revealed functional neuroplasticity after visual deprivation. However, the structural reorganization of the brain induced by visual deprivation is rarely reported, and the mechanism of structural neuroplasticity remains unclear. This study is one of the first attempts to investigate structural neuroplasticity in the white matter networks at both the global and the local node levels using the Diffusion Tensor Imaging data and the graph theory analysis method. The results demostrate disrupted brain structure and reorganized brain structural networks in early blind adolecents, which provide evidence of structural neuroplasticity induced by visual deprevation.
Introduction
Human brain is an extremely complex natural system with powerful adaptive and reorganizing capabilities. Previous neuroimaging studies have revealed functional neuroplasticity in patients with congenital and acquired visual deprivation. However, structural reorganization of the blind brains is rarely reported, and the mechanism of neuroplasticity remains unclear. This study aims to investigate the existence and mechanism of structural neuroplasticity induced by early visual deprivation based on Diffusion Tensor Imaging (DTI) tractography. Changes in individual white matter structural networks at both the global and the local levels are detected using the graph theory analysis method.Methods
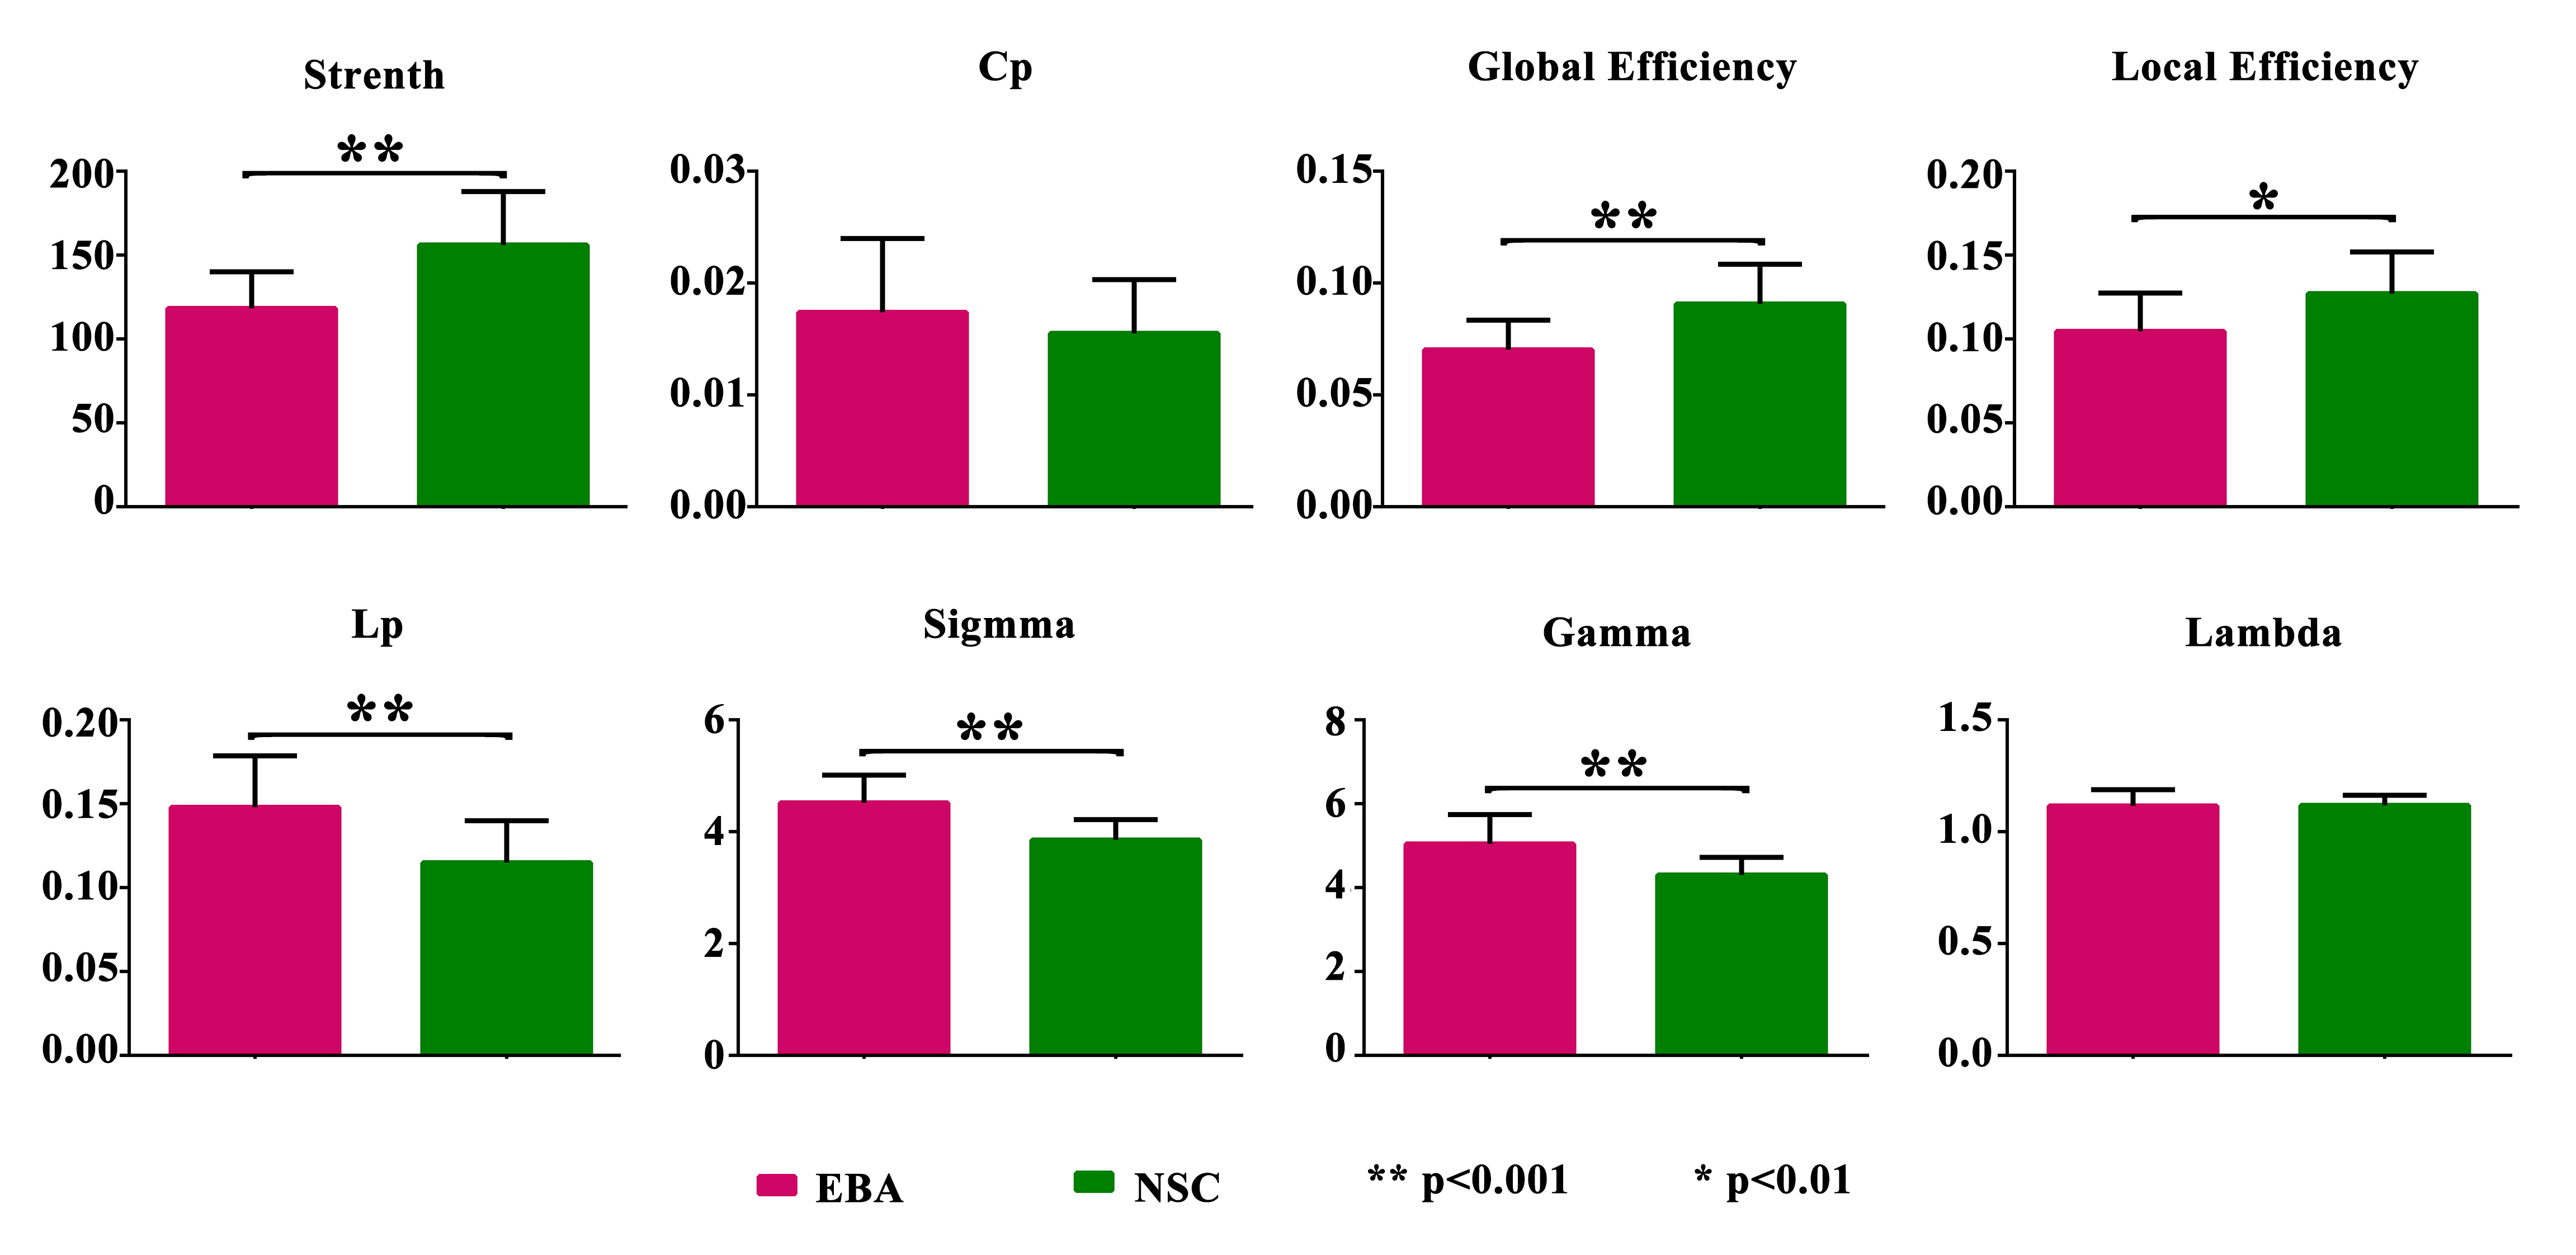
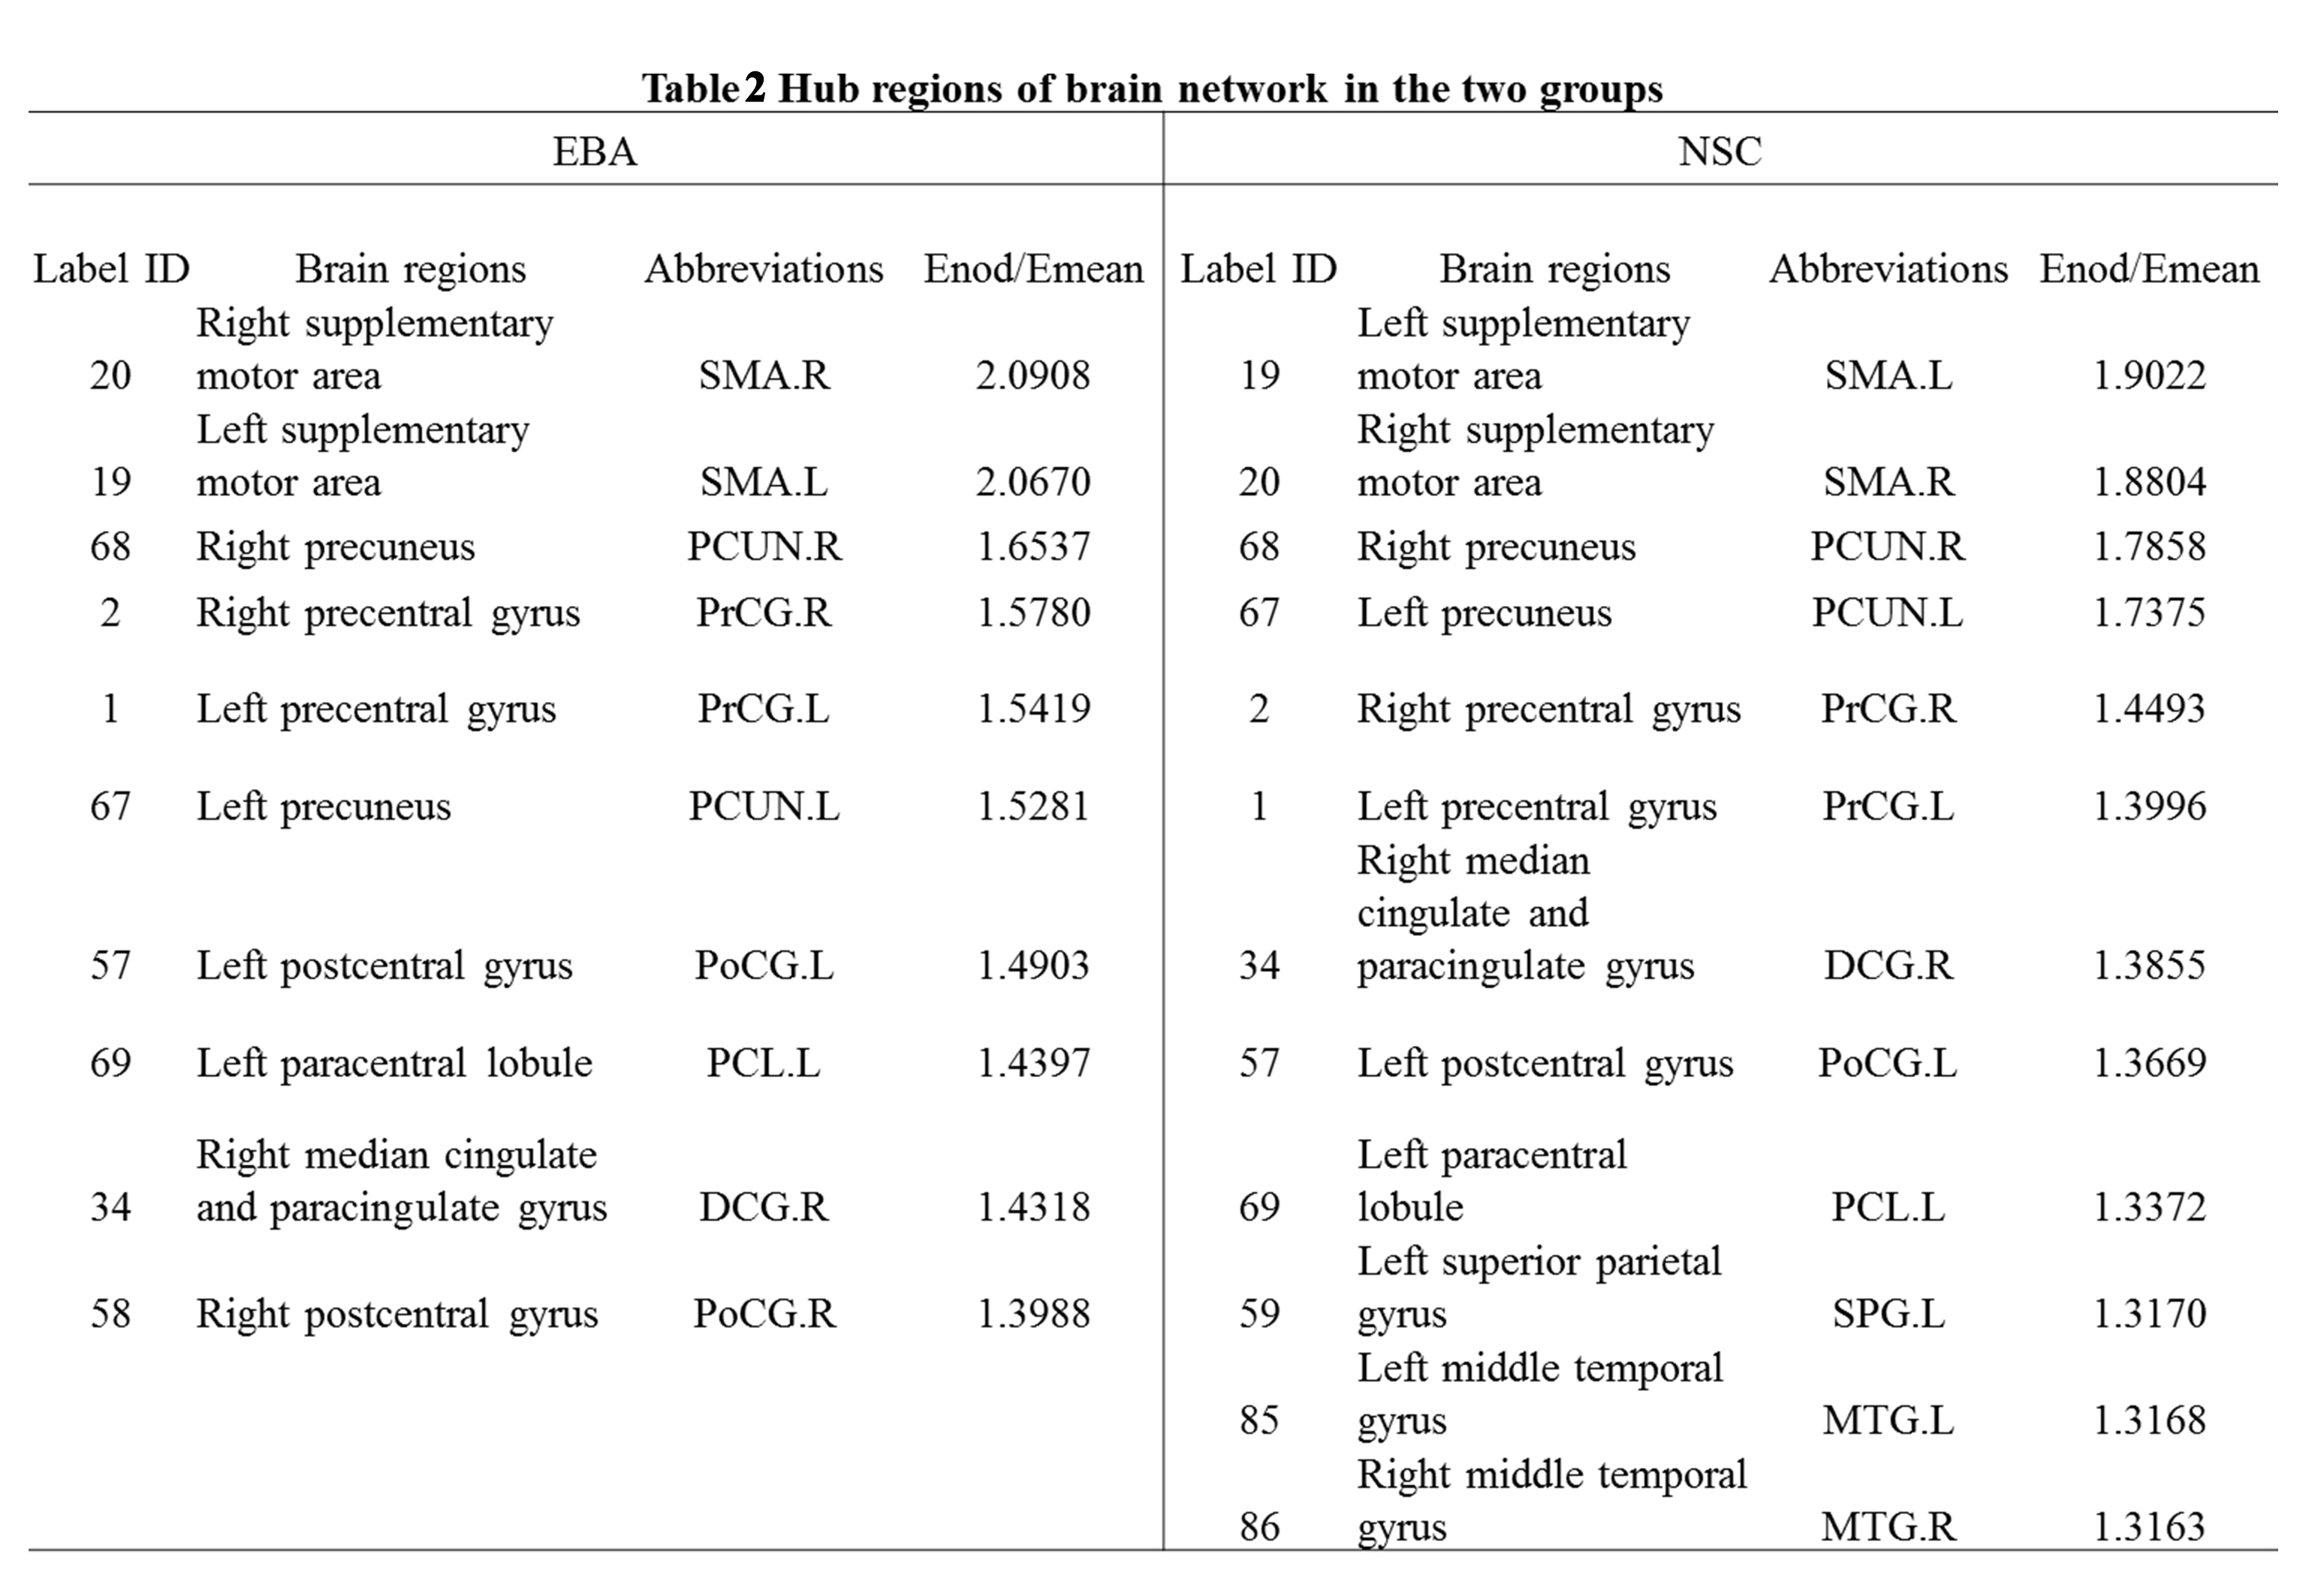
DTI data of 24 early blind adolescents (EBA group; gender: 15 males and 9 females; age range: 11-18, 14.1±2.1 years) and 26 age- and gender-matched normal sighted controls (NSC group; gender: 15 males and 11 females; age range: 11-19, 14.7±2.4 years) were acquired. The PANDA toolbox (http://www.nitrc.org/projects/panda)1 were used to preprocess the DTI data and to construct individual weighted white matter structural networks with deterministic tractography. Then both the global and nodal topological properties of individual brain structural networks were analyzed using GRETNA toolbox (https://www.nitrc.org/projects/gretna)2. The global properties include the clustering coefficient (Cp), shortest path length (Lp), global efficiency (Eglob), normalized clustering coefficient (Gamma, γ), normalized shortest path length (Lambda, λ), and small world parameters (Sigmma, σ). The nodal parameters including the nodal efficiency (Ne), nodal clustering coefficient (NCp), nodal shortest path length (NLp) and nodal strength were also estimated. In addition, hub nodes were defined as those nodes of a brain network if Ne was at least one standard deviation (SD) greater than the average nodal efficiency of the group network (i.e., Ne > mean + SD). The mean nodal strength of an individual structural network was defined as the network strength. Independent two sample t-tests were used to determine the differences in global and nodal topological properties of structural networks between the two groups.Results
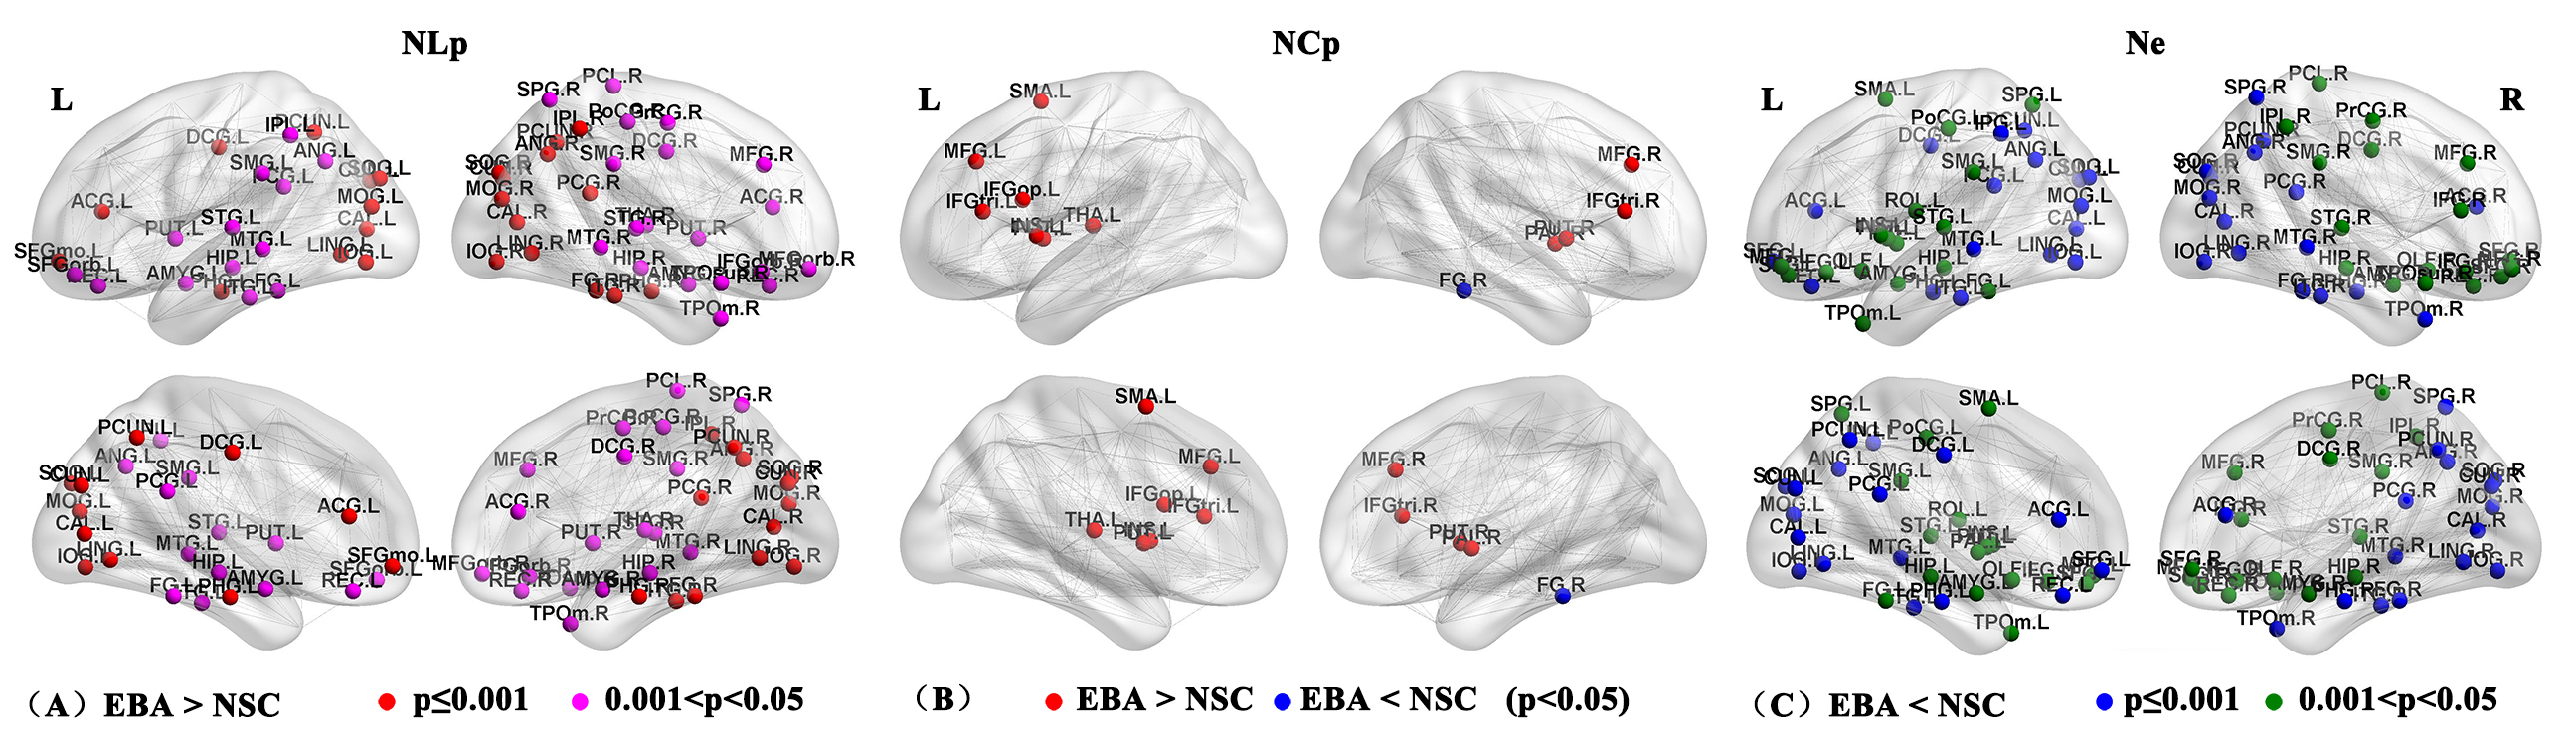
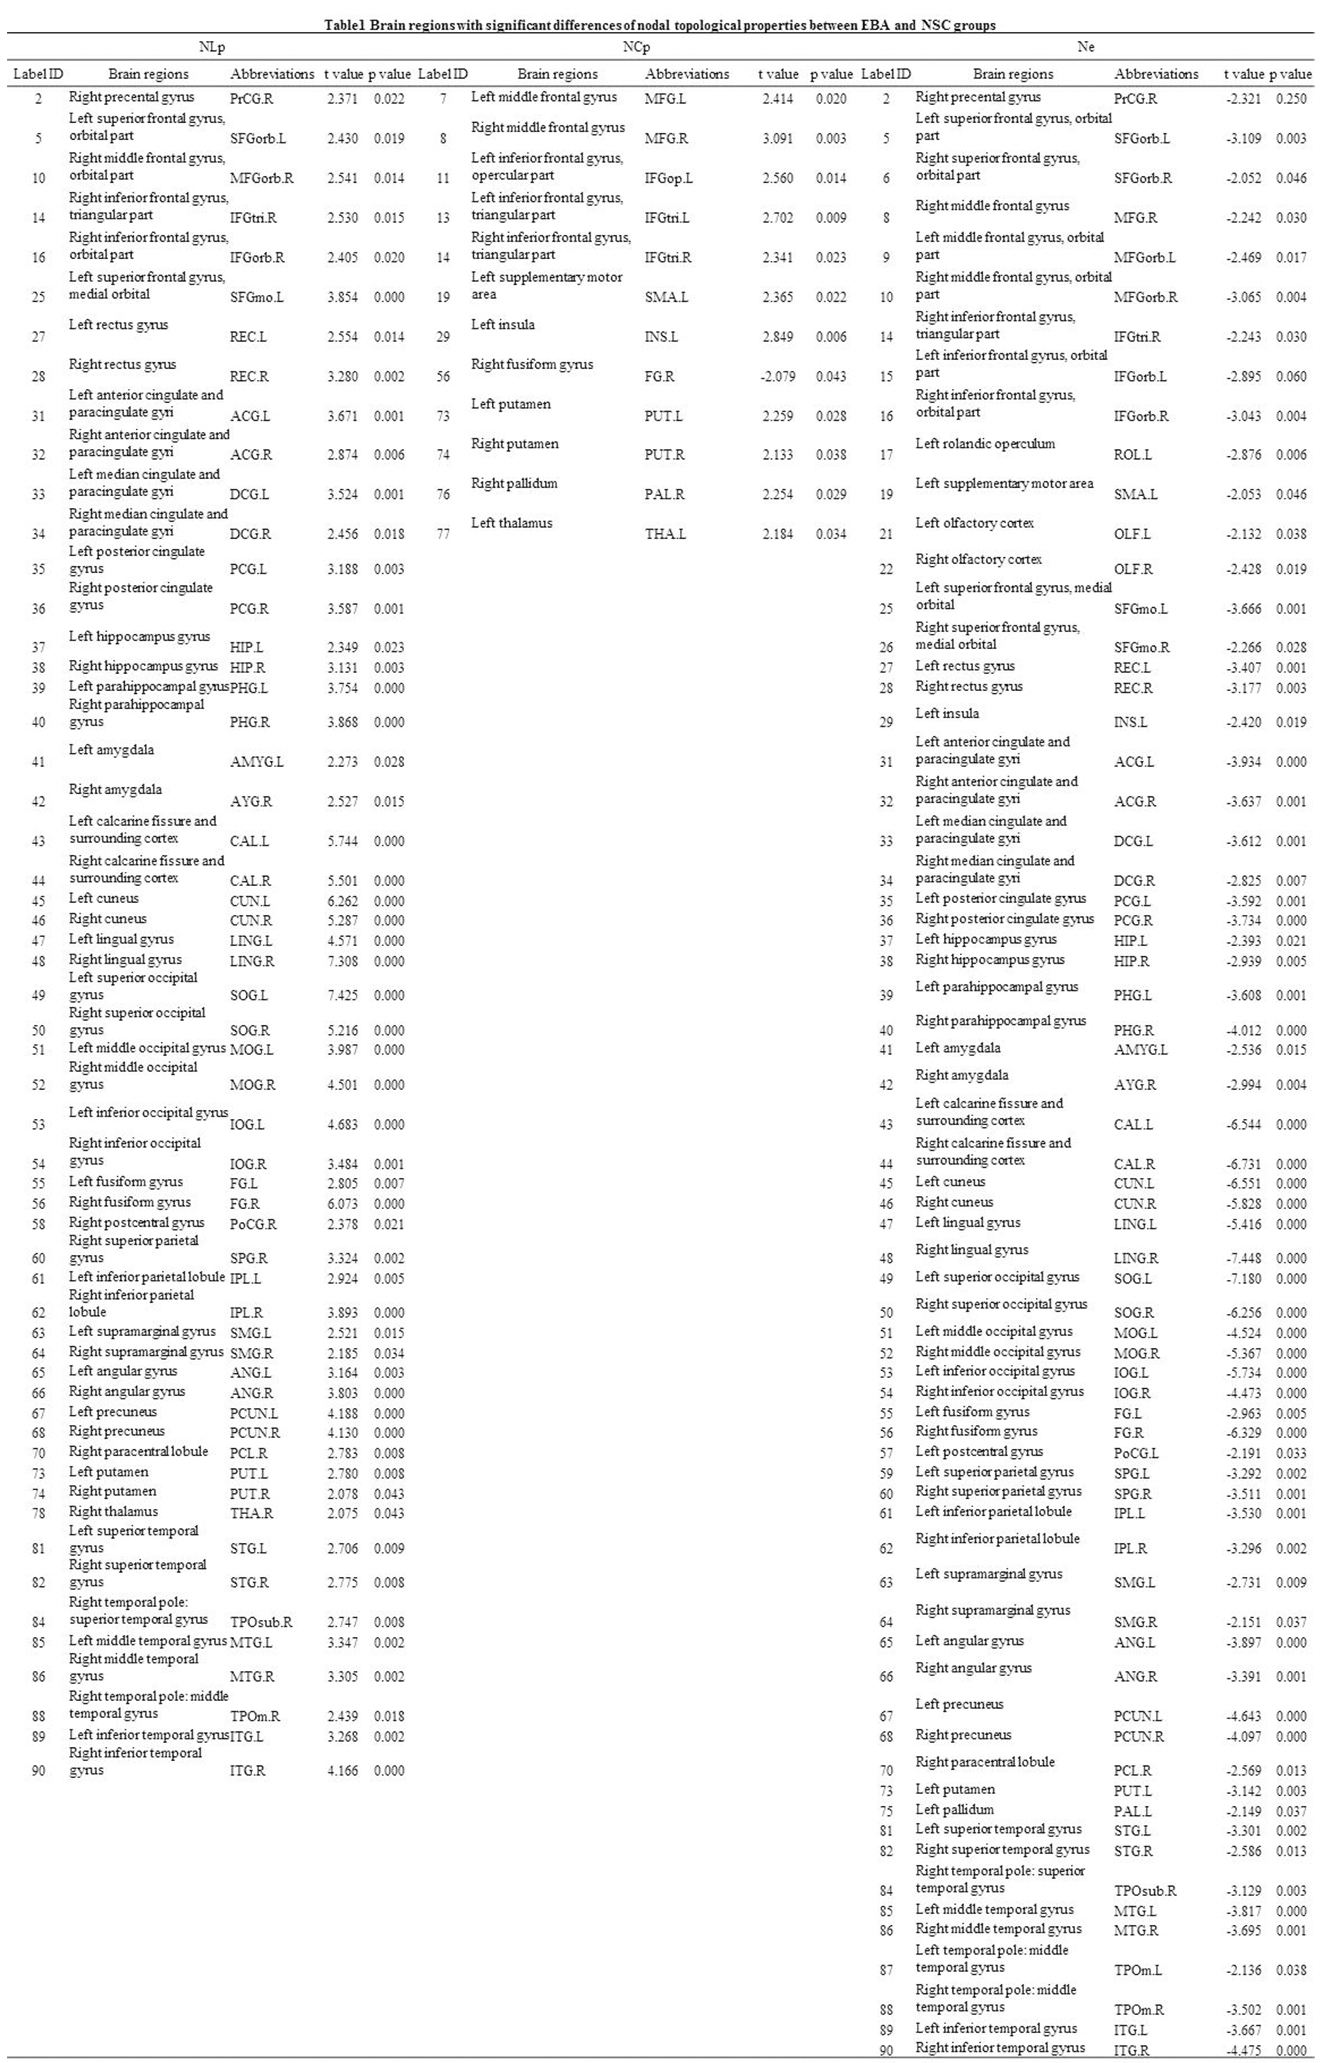
At the global level, there were significant differences between EBA and NSC groups in network topological properties, except Cp and λ (p<0.05; Figure1). The network strength, global and local efficiency of EBAs were all lower than those of NSCs, while the Lp, σ and γ of EBAs were higher than those of NSCs. At the nodal level, significantly increased NLp and decreased Ne were found in bilateral occipital visual cortex and cingulate gyrus (p≤0.001), as well as frontal and parietal cortex in EBAs compared to NSCs (p<0.05). Increased NCp was found in bilateral frontal cortex and the thalamus and basal ganglia subcortical regions in EBAs, and only the right fusiform gyrus was found to have decreased NCp in EBAs compared to NSCs (p<0.05; Figure 2 and Table 1). Ten identical hub nodes were found in both EBA and NSC networks, and additionally 2 hub nodes were found in NSC networks (Table2).Discussion and Conclusion
According to graph theory, the Lp and Cp represent the ability of the brain to transmit and integrate information, respectively, i.e. the shorter the Lp, the faster the information transmission speed; the higher the Cp, the stronger the ability to integrate information3. The network efficiency represents the ability to process information3. In this study, the changes of global network properties show the disrupted topological organization of the white matter structural network in EBAs, which can be partially explained by the general efficiency reduction and path extension at the node level. Interestingly, we found higher Cp in the bilateral frontal cortex and the sub-cortex of thalamus and basal ganglia in the EBA group compared to NSC group, which demonstrates that the ability of EBA to integrate information in the corresponding brain regions has been enhanced. The results showed disrupted brain structure of EBA at both the global and the nodal levels, and demonstrated that there existed brain structural network reorganization induced by visual deprivation, which provide evidence for structural neuroplasticity at network level in early blind brains.Acknowledgements
No acknowledgement found.References
1 Z. Cui, S. Zhong, P. Xu, et al., 'Panda: A Pipeline Toolbox for Analyzing Brain Diffusion Images', Front Hum Neurosci, 7 (2013), 42.
2 J. Wang, X. Wang, M. Xia, et al., 'Gretna: A Graph Theoretical Network Analysis Toolbox for Imaging Connectomics', Front Hum Neurosci, 9 (2015), 386.
3 M. Rubinov, and O. Sporns, 'Complex Network Measures of Brain Connectivity: Uses and Interpretations', Neuroimage, 52 (2010), 1059-69.
Figures