0344
Investigation of the dependence of free water and pseudo-diffusion MRI estimates on the cardiac cycle1Image Sciences Institute, UMC Utrecht, Utrecht, Netherlands, 2C. J. Gorter Center for High Field MRI, Leiden University Medical Center, Leiden, Netherlands, 3Department of Radiology, UMC Utrecht, Utrecht, Netherlands
Synopsis
With diffusion MRI (dMRI) data at multiple diffusion weightings it is possible to quantify the relative fractions of multiple water pools. In this work, we investigated changes in free water diffusion and micro- and macro-vascular pseudo-diffusion during the cardiac cycle. Further, we propose a data driven method to bin the dMRI signals according to the cardiac phase. dMRI at 4 diffusion weightings was acquired 80 times with short repetition time. A multi-exponential fit of the binned data showed increases of free water in white matter and periventricular areas, and opposite increases/decreases for micro- and macro-vascular pseudo-diffusion in grey matter, respectively.
Introduction
The diffusion MRI (dMRI) signal measured with Pulsed Gradient Spin-Echo (PGSE) sequences is sensitive to multiple diffusion domains, including intra/extra-cellular diffusion, free water, and blood pseudo-diffusion1. A previous study2 showed that pseudo-diffusion estimates in the brain depend on whether the dMRI signal was measured in the systole or the diastole. In this work, we investigated whether changes in free water and micro- and macro-vascular diffusion are affected by the cardiac cycle. Further, we propose a data-driven method to synchronize the dMRI signal to the cardiac phase.Methods
One subject (F, 27 years) underwent a 3T MRI. The protocol included a 1mm isotropic T1W image (TE=3.7ms, TR=8.1ms, SENSE=2+1.4) and a dMRI acquisition with 13 volumes (1 b=0s/mm2, 3xb=50,100,300,800s/mm2 with orthogonal gradients, TE=96ms, TR=1s, SENSE=2, 14 slices) at 2.5mm isotropic resolution.The acquisition was repeated for 80 dynamics to enable the acquisition of volumes randomly sampled over the different phases of the cardiac cycle, which was recorded with a peripheral pulse unit (PPU).
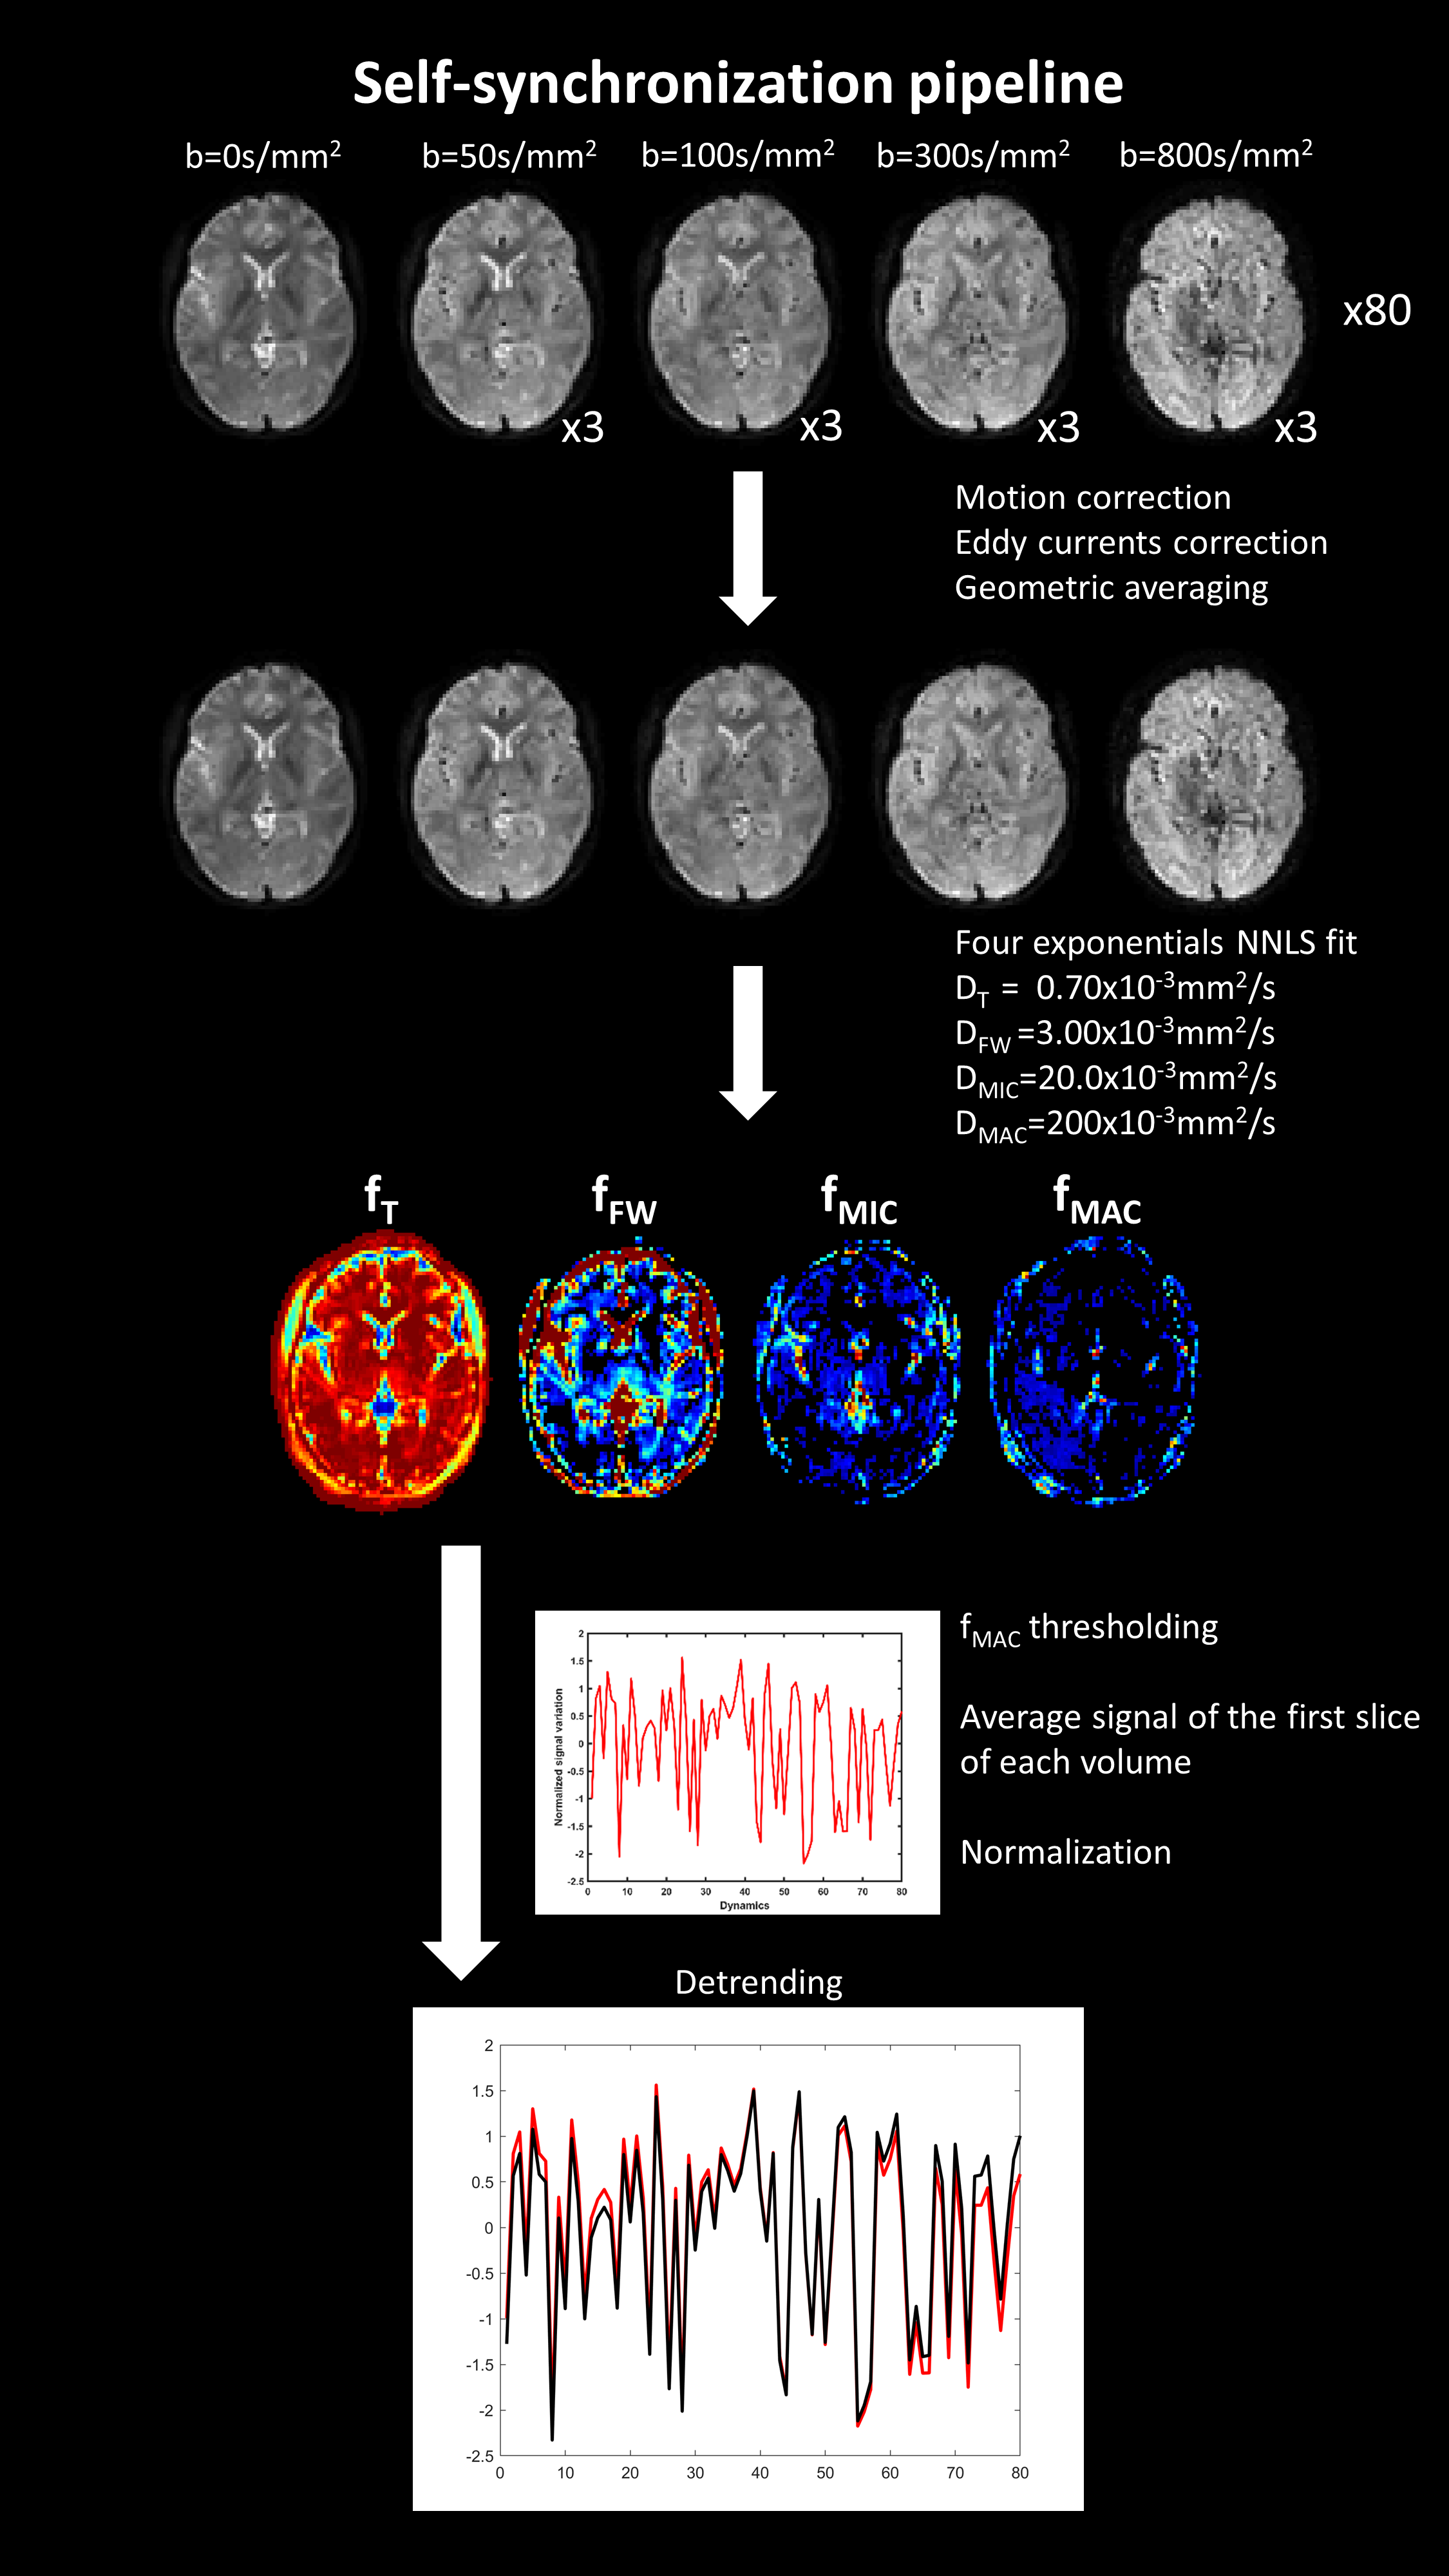
dMRI data were processed for subject motion and eddy currents3, geometrically averaged, and fit with a four-exponentials model. The exponentials were centered at diffusion values DT=0.7x10⁻³mm2/s, DFW=3x10⁻³mm2/s, DMIC=20x10-3mm2/s, DMAC=200x10-3mm2/s, to determine signal fractions associated to white/grey matter tissue (fT), free water4 (fFW), micro-vascular pseudo-diffusion (fMIC) and macro-vascular pseudo-diffusion5 (fMAC), respectively.
dMRI data were binned with two methods. In the first method, the inter-peak time of the PPU signal was divided in 10 bins, and the slices binned accordingly. In the second method, named “self-synchronized” and shown in Figure 1, the average signal of the first slice of each volume was detrended6 and processed to obtain normalized signal variations, which were divided in 10 bins. This method assumes a direct link between signal variations and blood flow changes during the cardiac cycle.
Pearson correlations were computed between signal changes and the equally sampled PPU signal. Each slice of the dataset was binned accordingly by interpolating the bin assignment over the slice acquisition order. Consequently, the four exponentials fit was repeated on data corresponding to each bin. Three regions of interest (ROIs) were manually drawn over multiple slices in i) the ventricles ii) a pure white matter region iii) bi-lateral grey matter areas (with some partial volume of fluids). Statistics of the signal fractions were computed within the ROIs. Z-tests were performed between signal fractions obtained with the binned data and the results from a fit of the whole data. Further, the fractions and their difference from the average were visually compared between the two methods.
Results
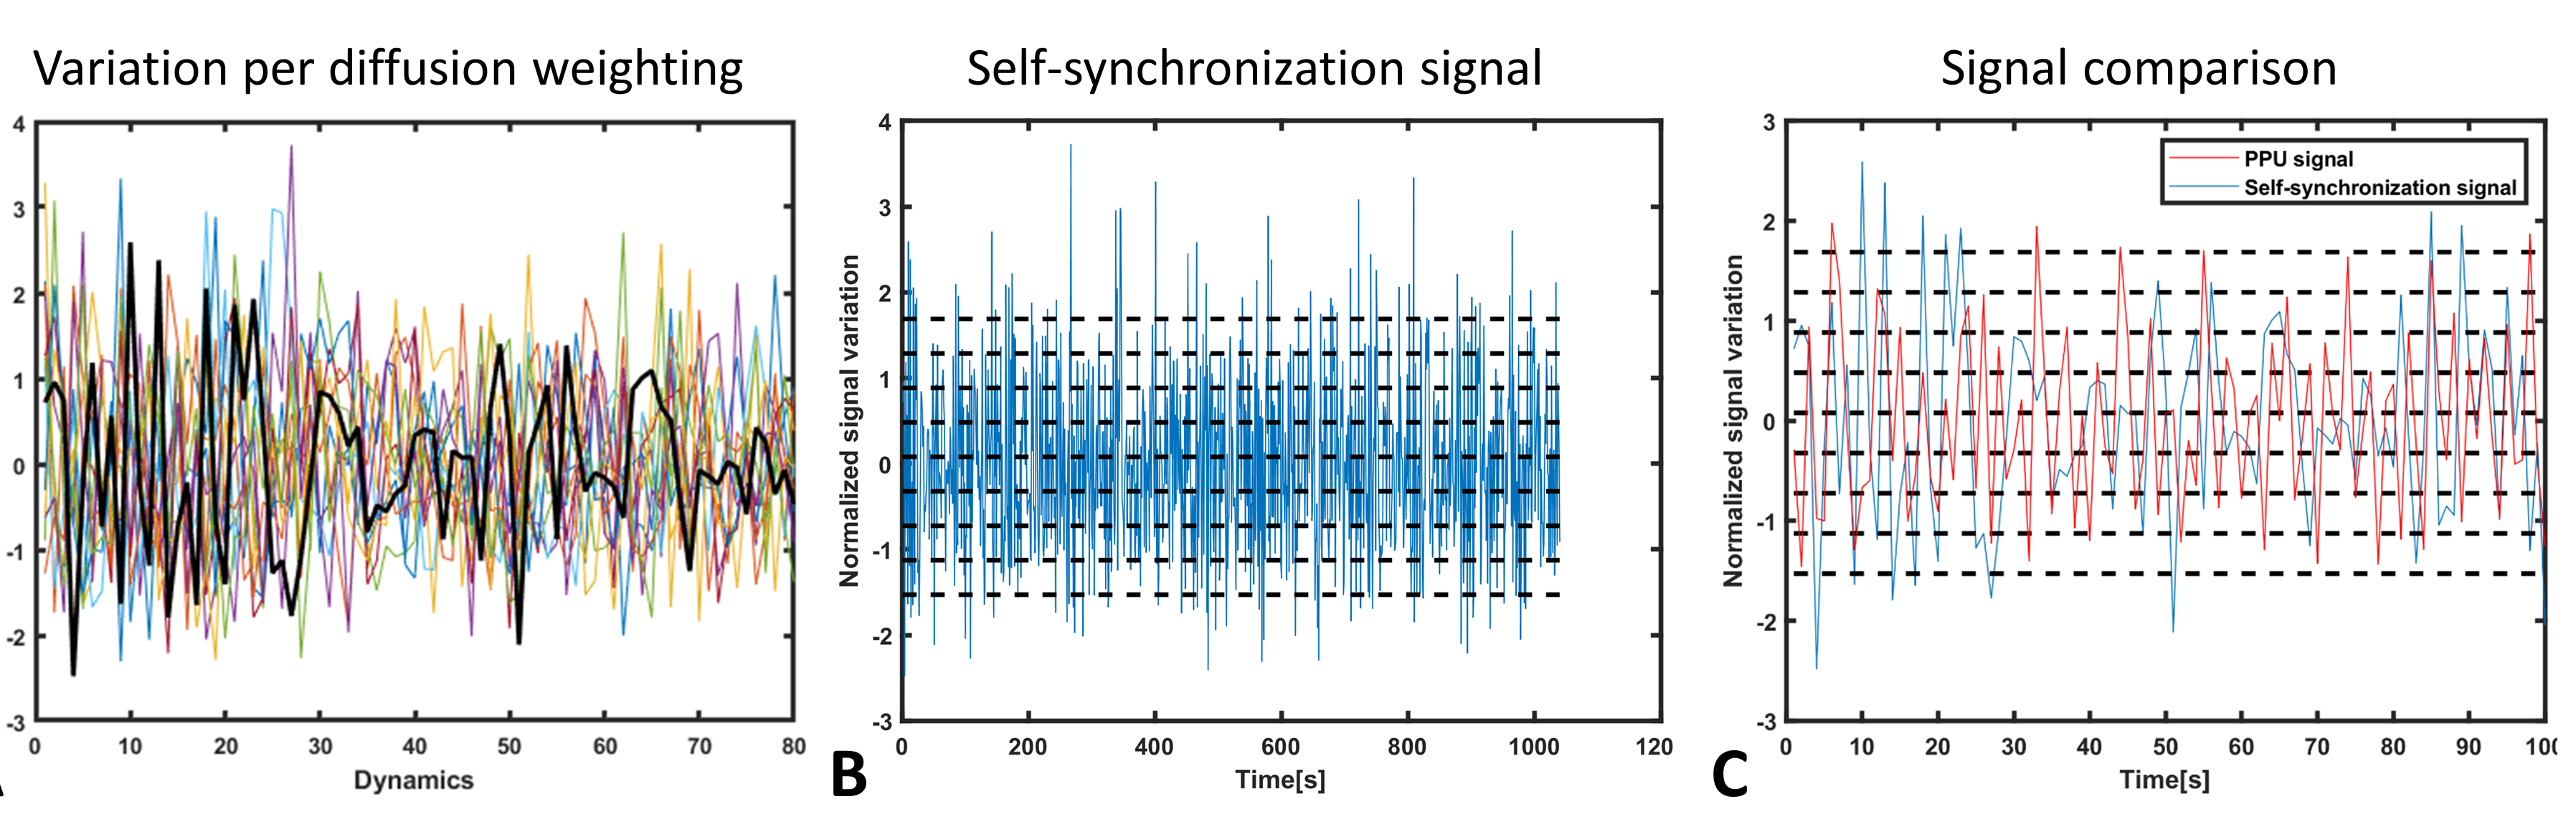
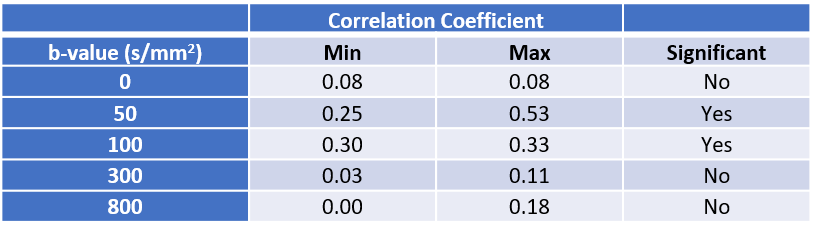
Figure 2 shows the normalized signal variations corresponding to each diffusion weighting (Figure 2A), their concatenation and binning (Figure 2B), and a comparison with the PPU signal in a short time frame (Figure 2C). Large fluctuations above 1 standard deviation were observed throughout the dynamics. Significant correlations between the signals from PPU and and dMRI were observed, as reported in Table 1.
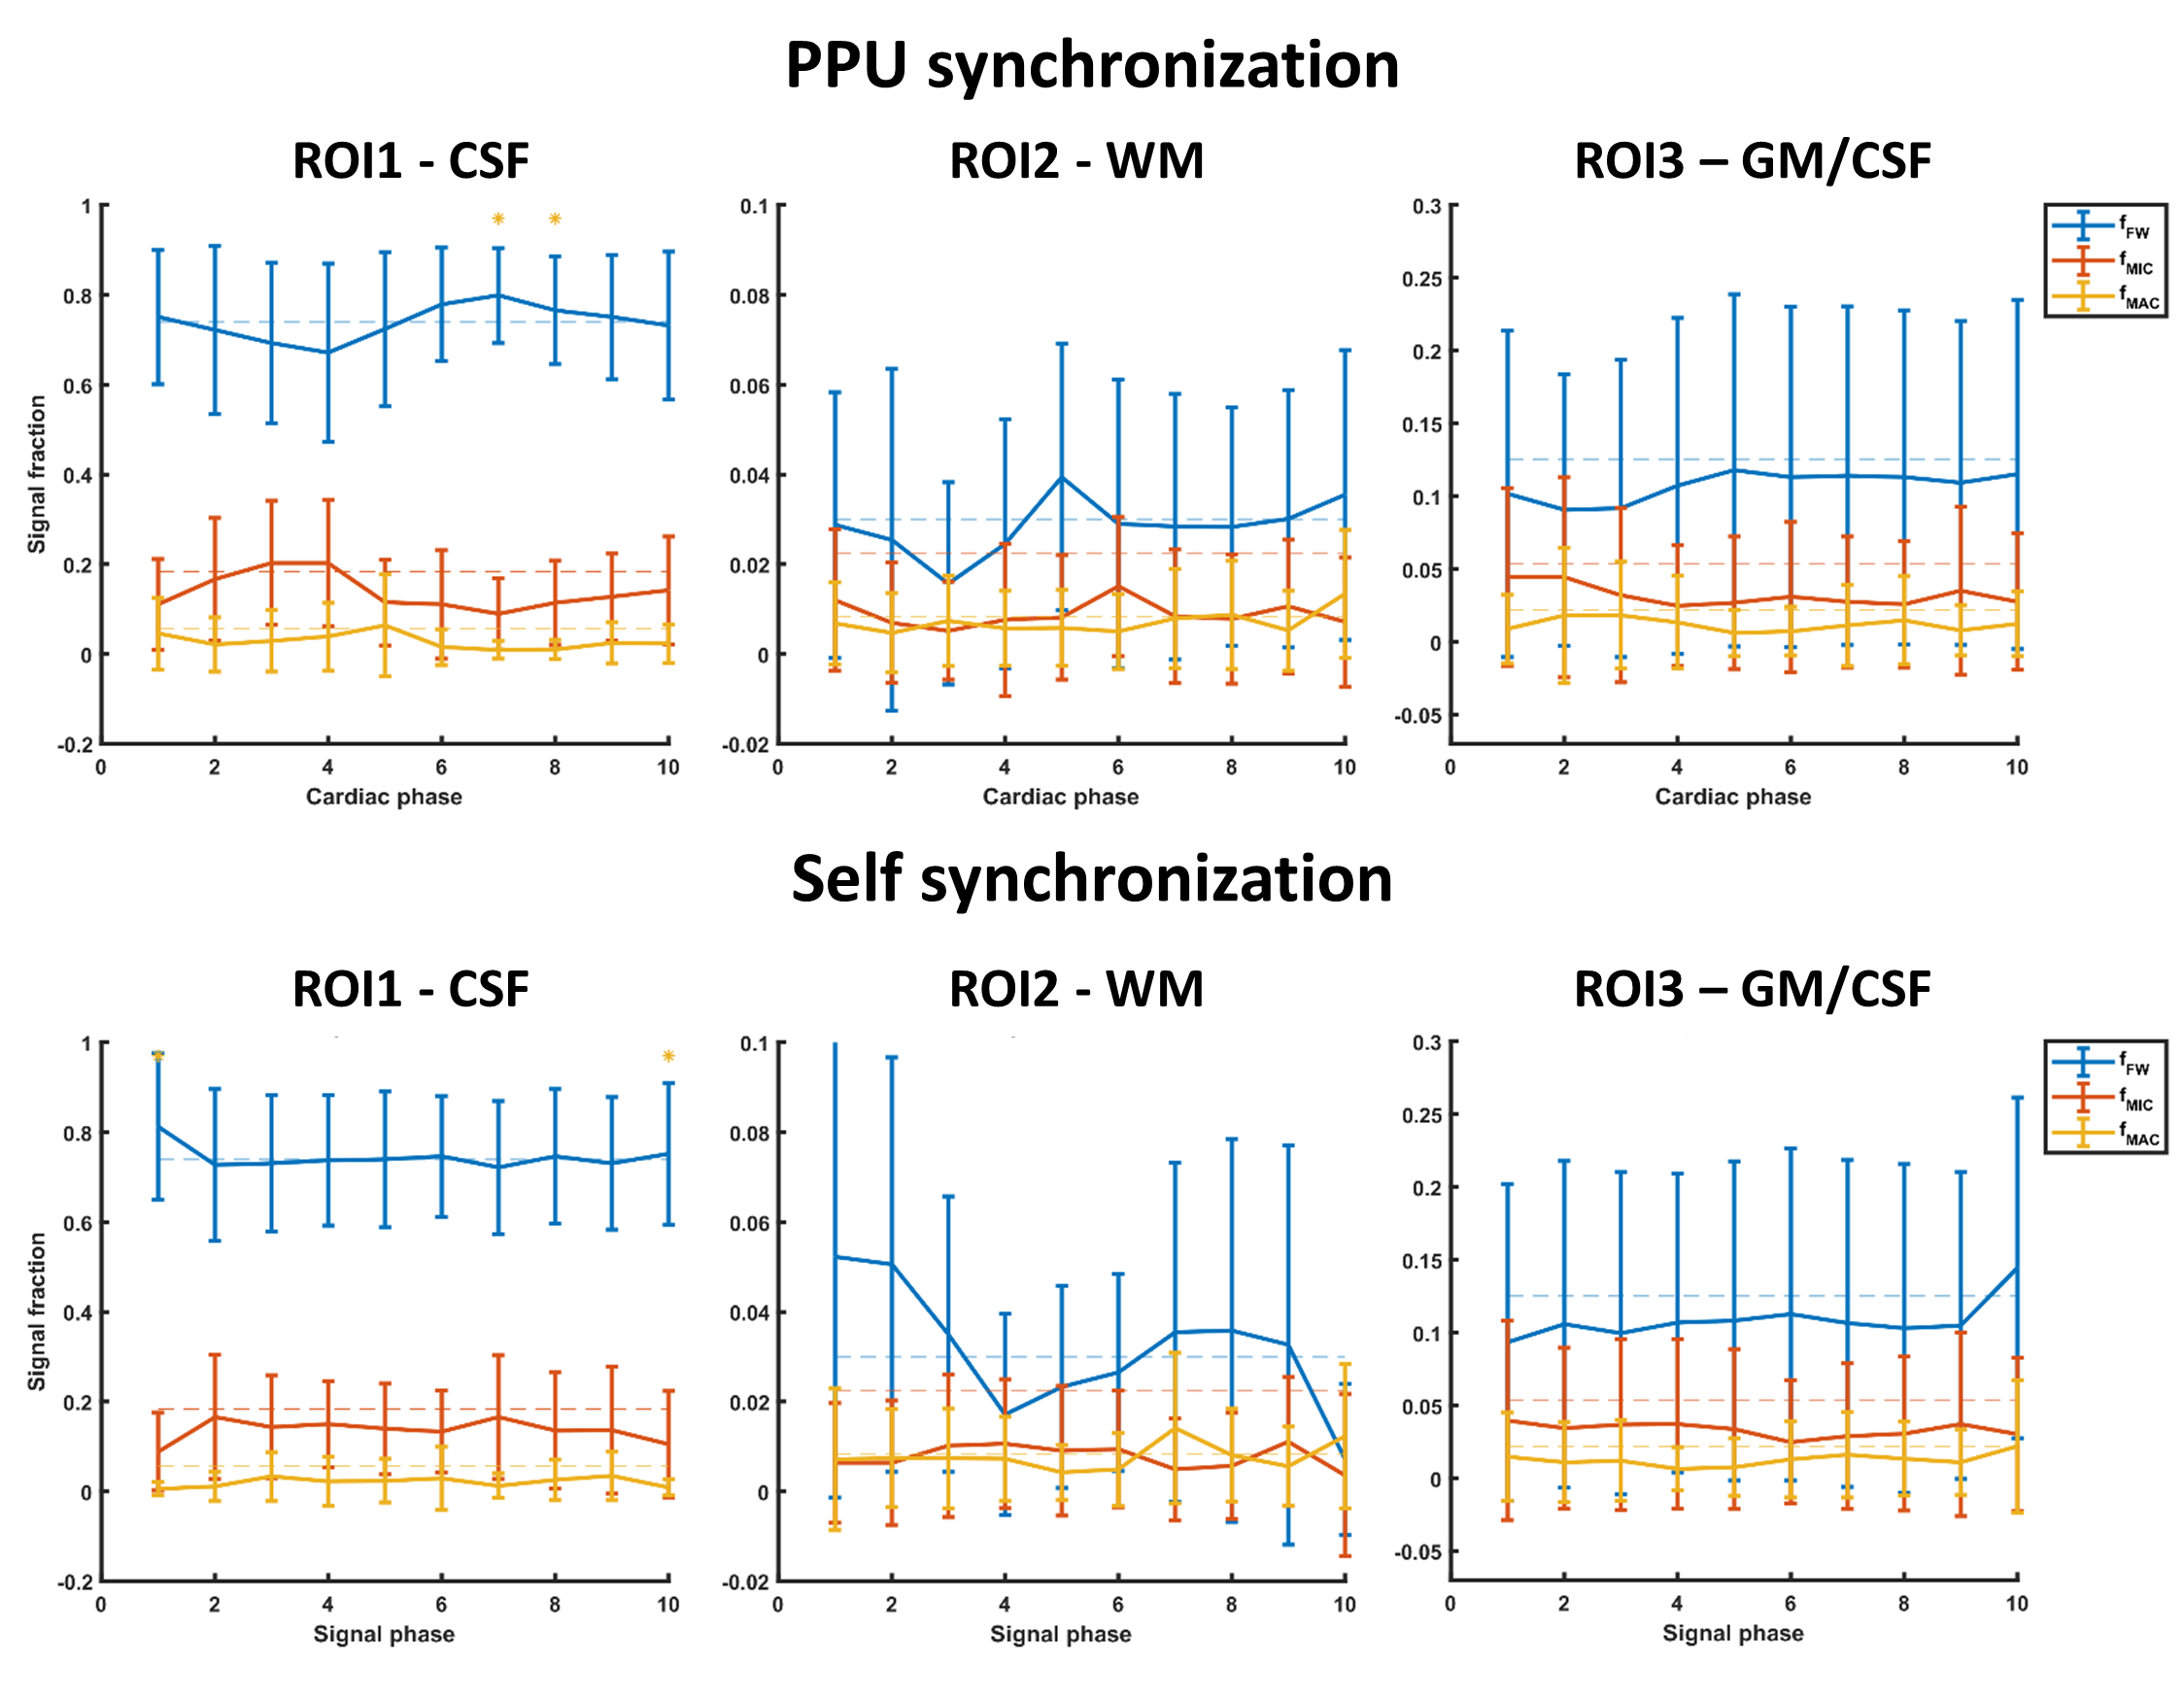
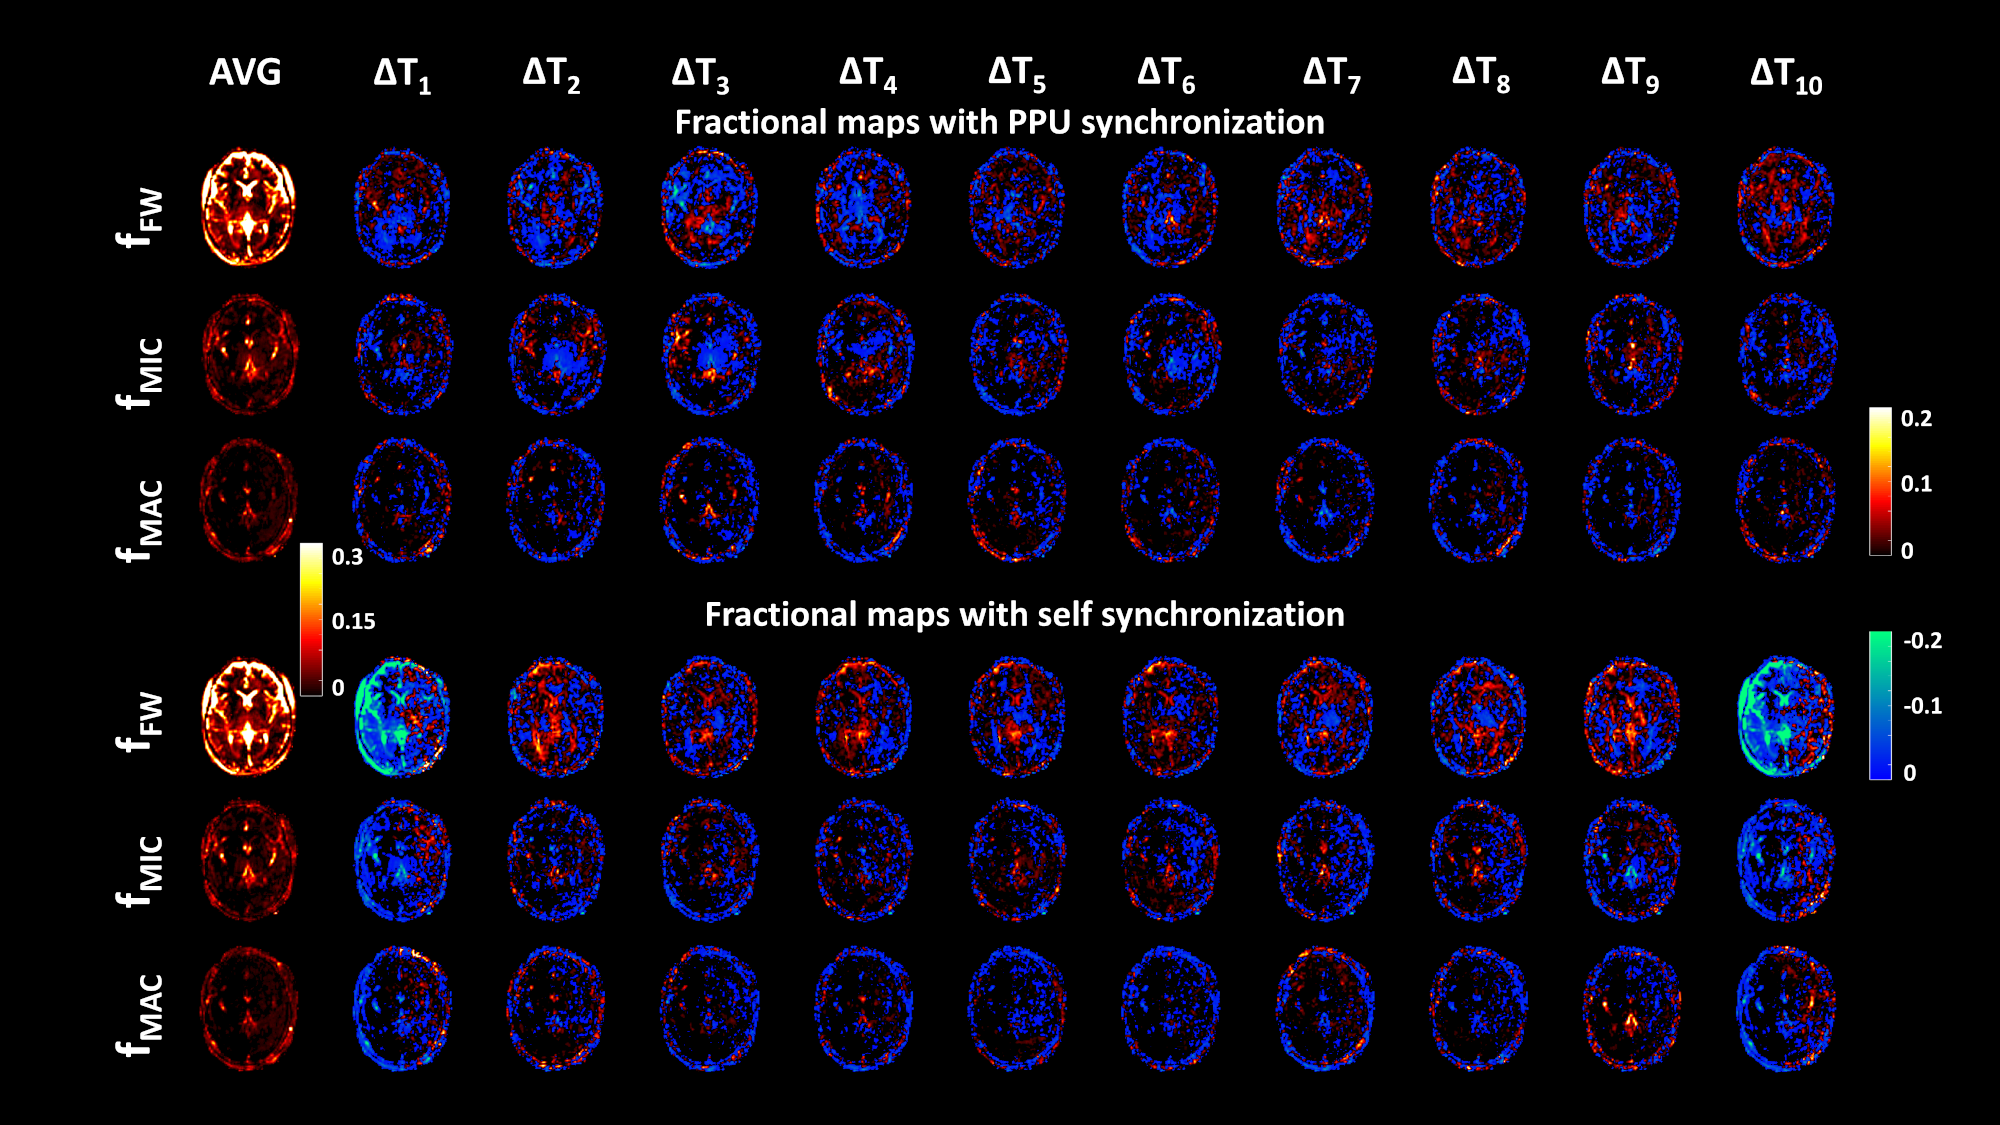
Figure 3 shows the changes in signal fractions over the cardiac phase. Estimates of fMIC and fMAC appeared to be coupled with both synchronization methods, implying that increases in fMIC reflected in decreases of fMAC, and viceversa. The largest changes were observed for fFW, with a decrease/increase in WM. Figure 4 shows an example slice of the fractional maps obtained with the two methods and their evolution over the cardiac cycle. For both methods, remarkable fFW increments were observed in WM and peri-ventricular areas. fMIC changed mostly in GM and deep GM areas, whereas the biggest changes in fMAC were located in vessels and their surroundings.
Discussion
The dMRI signal depends on the cardiac cycle over multiple diffusion weightings, as proven by the correlation with the PPU signal. At ROI level, the self-synchronized method provided similar estimates to the PPU synchronization, allowing to detect characteristic changes of free water diffusion in WM. At voxel level, both methods showed similar cyclic patterns over time, but a possible time-shift was observed. Additionally, stronger changes in fFW were observed with self-synchronization, suggesting sensitivity of the method beyond pure blood flow. In this experiment, we did not control for the delay between the PPU unit and blood arrival in the brain, which should be addressed in future work. Further, we decoupled changes in micro and macro-vascular pseudo-diffusion5, which had opposite trends that might cancel out when considered together2.Conclusions
We have shown that measures of free water diffusion, micro and macro-vascular diffusion are sensitive to physiological changes during the cardiac cycle, and introduced an acquisition and processing strategy to investigate such changes without external synchronization.Acknowledgements
The authors acknowledge dr. Frank Zijlstra for advices on the PPU signal optimization.References
1. De Luca, A., Leemans, A., Bertoldo, A., Arrigoni, F. & Froeling, M. A robust deconvolution method to disentangle multiple water pools in diffusion MRI. NMR Biomed. e3965 (2018). doi:10.1002/nbm.3965
2. Federau, C. et al. Dependence of brain intravoxel incoherent motion perfusion parameters on the cardiac cycle. PLoS One 8, e72856 (2013).
3. Leemans, A., Jeurissen, B., Sijbers, J. & Jones, D. K. ExploreDTI: a graphical toolbox for processing, analyzing, and visualizing diffusion MR data. in 17th annual meeting of the International Society for Magnetic Resonance in Medicine, Honolulu, Hawaii, USA 3537 (2009).
4. Pasternak, O., Sochen, N., Gur, Y., Intrator, N. & Assaf, Y. Free water elimination and mapping from diffusion MRI. Magn. Reson. Med. 62, 717–30 (2009).
5. Fournet, G. et al. A two-pool model to describe the IVIM cerebral perfusion. J. Cereb. Blood Flow Metab. 37, 2987–3000 (2017).
6. Vos, S. B. et al. The importance of correcting for signal drift in diffusion MRI. Magn. Reson. Med. 22, 4460 (2016).
Figures