0340
Age-specific Quantitative Brain Atlas Modelling Brain Shape and T1 Changes1Advanced Clinical Imaging Technology, Siemens Healthcare AG, Lausanne, Switzerland, 2Department of Radiology, University Hospital (CHUV), Lausanne, Switzerland, 3LTS5, École Polytechnique Fédérale de Lausanne, Lausanne, Switzerland, 4Department of Neuroradiology, Medical Center – University of Freiburg, Faculty of Medicine, University of Freiburg, Freiburg, Germany
Synopsis
In order to facilitate the use of quantitative mapping approaches in clinical routine, atlases with normative quantitative values are required for comparison on a single-subject basis. To improve such comparison, we propose here to not only model the age-related change in T1, but also the change in brain shape. The method is demonstrated on a dataset of 196 quantitative T1 maps, yielding a brain model with shape and T1 information over the potential lifespan of a patient to assess.
Introduction
Over the past decades, various fast quantitative imaging methods to measure relaxation times were developed1–4. To unfold the clinical potential of quantitative measures, atlases of normal values and methods to compare measurements from a single patient to these atlases are required5,6.
Typically, atlases are generated by co-registering the quantitative maps of a healthy cohort into a common space7. Ideally, the healthy-cohort data spans over a wide age range to be able to differentiate between brain changes driven by aging and those driven by disease. However, the co-registration of images from both young and elderly subjects into a common space may not be ideal for the same reason, i.e. age-related brain anatomy changes. In structural atlases, this problem was approached by binning the healthy subjects in several age groups and creating one common space per bin8.
Here, we create a quantitative T1 atlas which not only accounts for changes in T1 but also the change in brain shape depending on the age. This has the clinical motivation of improving the differentiation between age and disease effects.
Methods
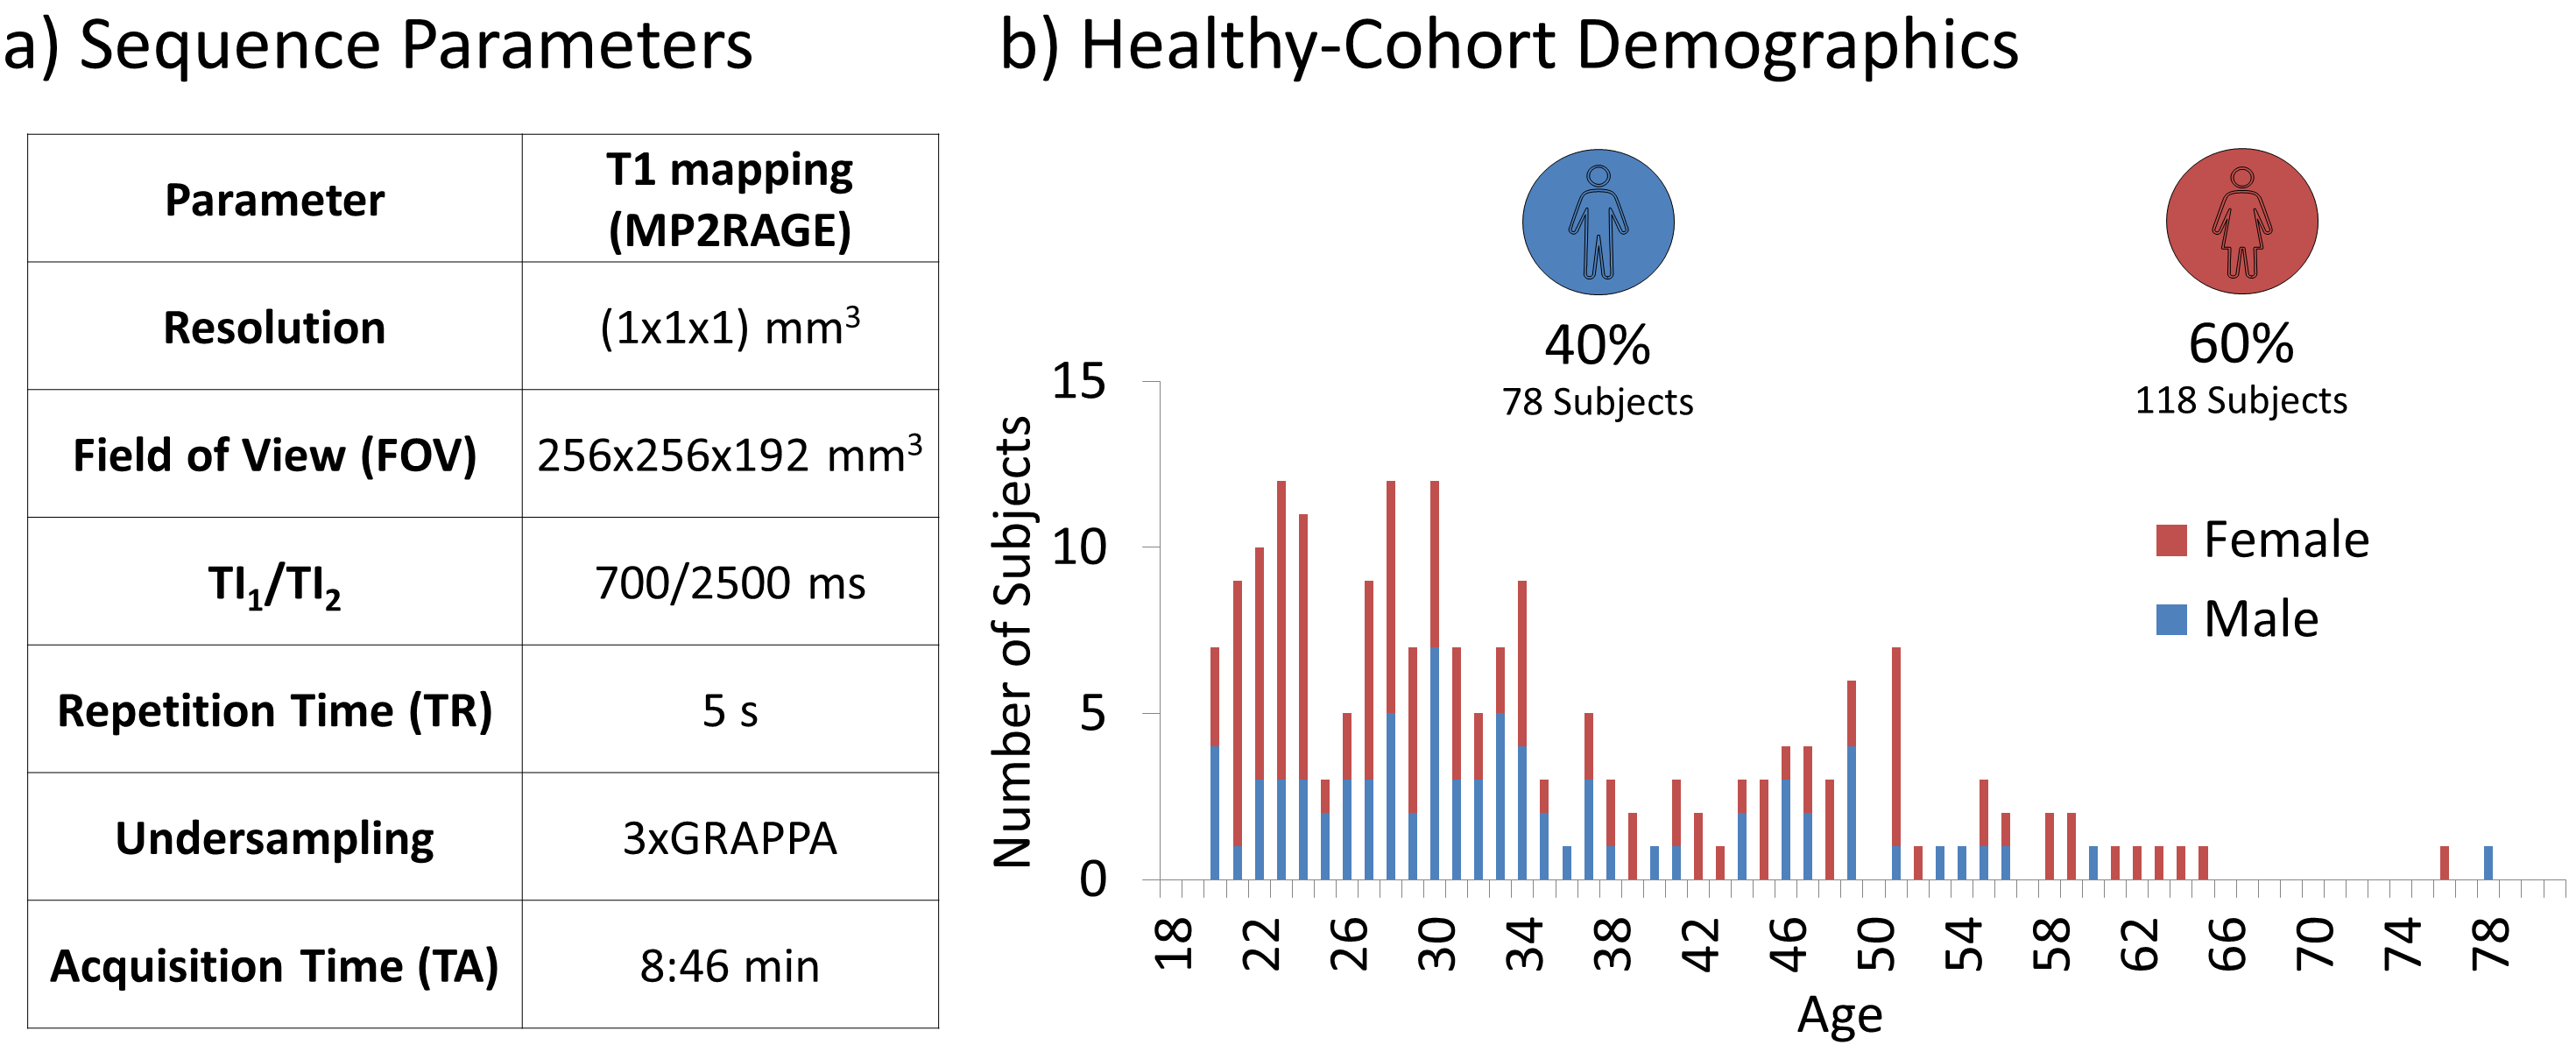
After obtaining informed written consent, quantitative 1mm-isotropic T1 maps were acquired using the MP2RAGE sequence1 (Figure 1a) from 196 healthy subjects at 3T (MAGNETOM Prisma, Siemens Healthcare, Erlangen, Germany) using a 64-channel head/neck coil. All subjects were previously screened for neurological diseases. Demographic information on the cohort can be found in Figure 1b.
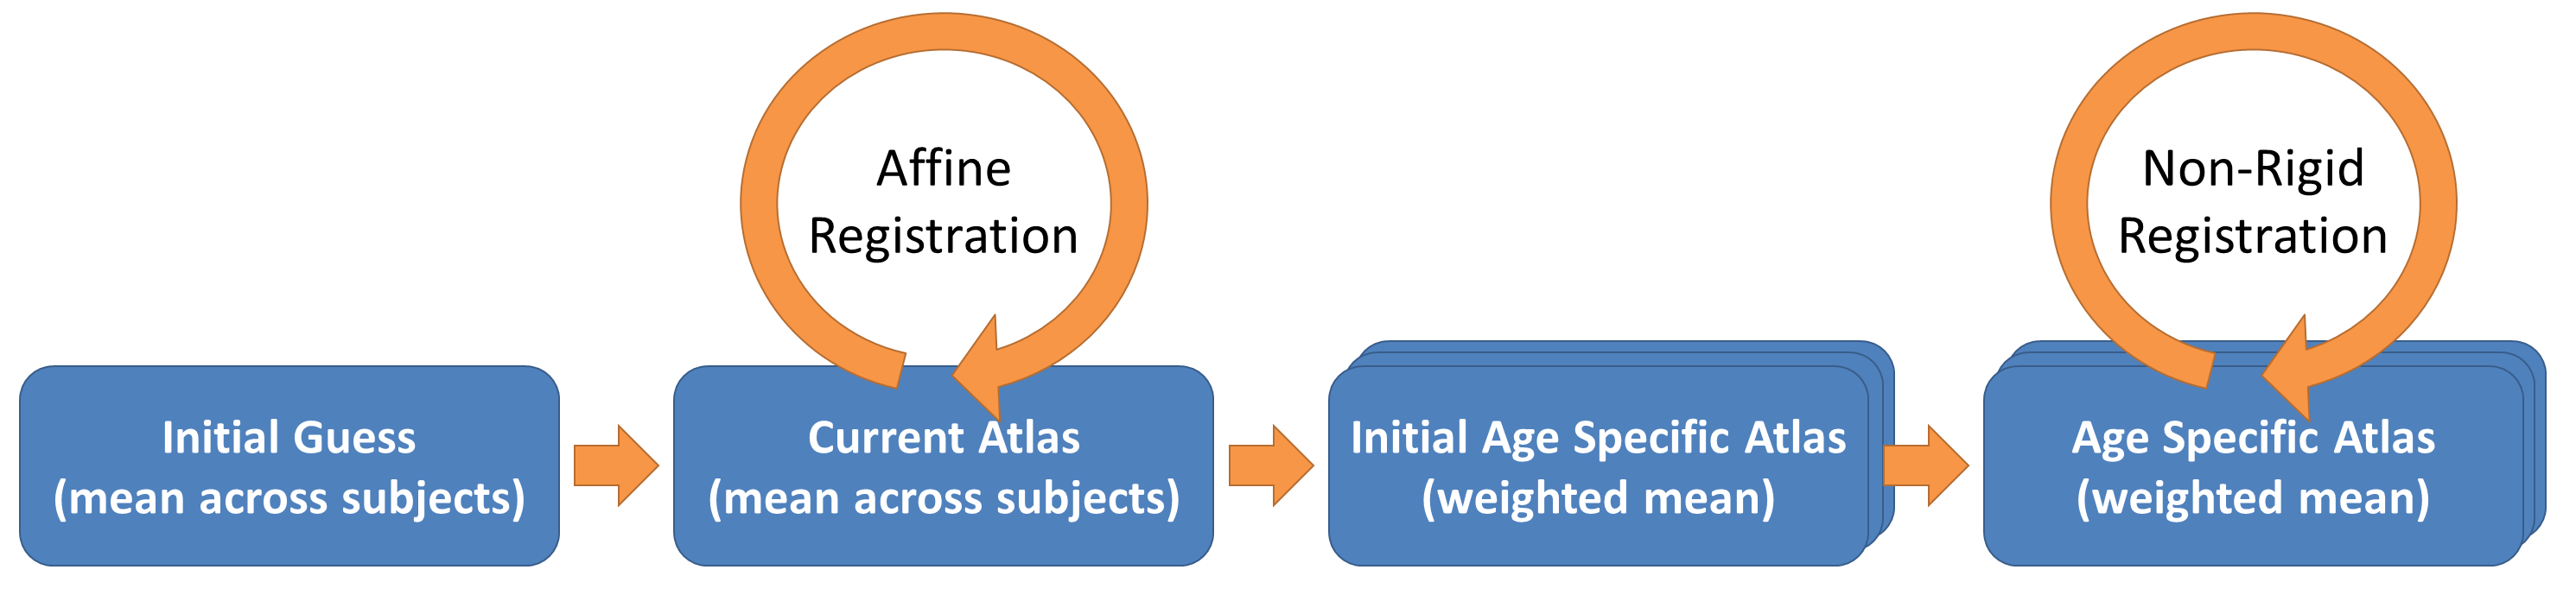
Due to the underlying MP2RAGE image combination, the quantitative T1 maps exhibit noise outside the head; synthetic T1-weighted images (synT1w)9 not showing this noise were thus used for all registrations. In the first step of the prototype algorithm, an initial guess was created by averaging the synT1w intensities across all subjects. Subsequently, all subjects were registered on this atlas10. An affine registration was used in this first step because it is not intended to change the brain shape, but account for differences in head size and alignment. The process of averaging and affine registration was then repeated to iteratively improve the head alignment between subjects (four iterations here). Until this step, the method resembles a typical atlas generation algorithm.
Contrary to standard atlas processing, the next step consisted of generating an individual age-specific atlas using a weighted mean. To that end, a Gaussian kernel was used to only take into account subjects with a similar age (σ=2 years in this example). Subsequently, each subject was registered to the atlas of this subject’s respective age using a non-rigid registration. The process of creating age-specific atlases and non-rigid registrations was repeated iteratively to improve the alignment of brain structures (two iterations here).
Finally, all transformations from the previous registrations based on the synT1w images were applied to the corresponding T1 maps. A T1 atlas for any age within the range of the healthy cohort can then be derived with the aligned T1 maps and the previously introduced weighted mean. A flowchart of the atlas generation algorithm is given in Figure 2.
Results
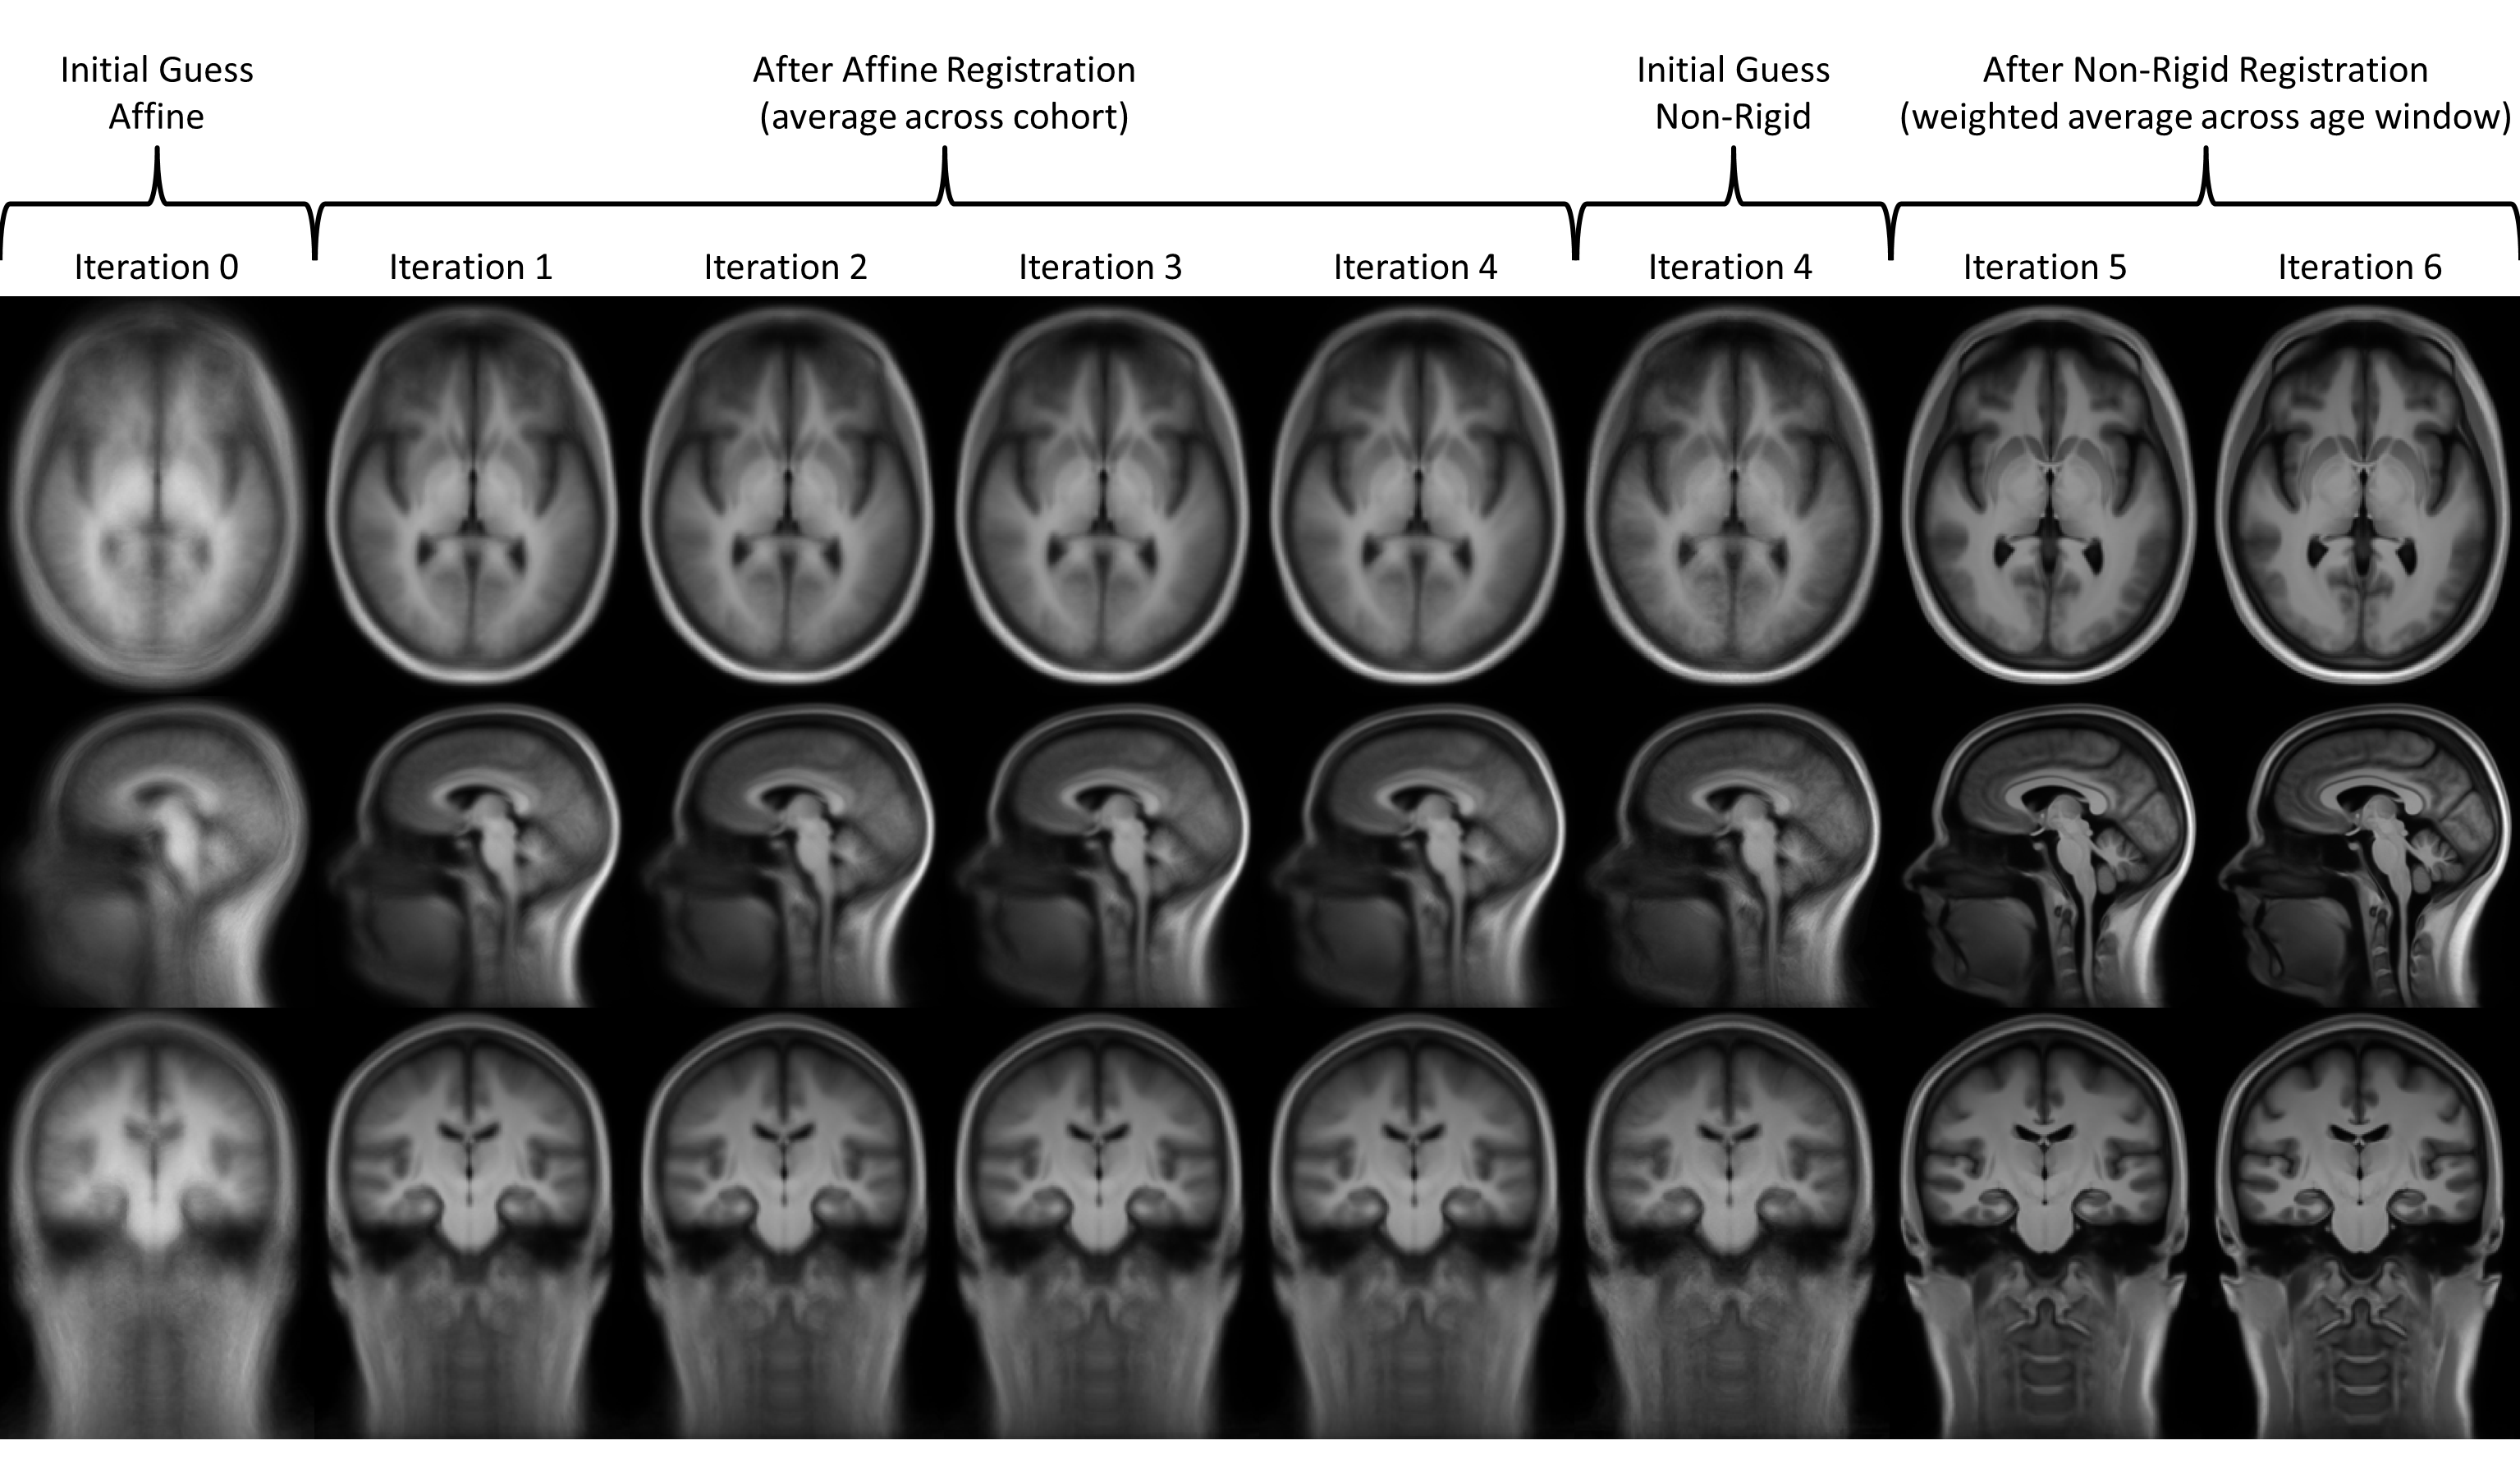
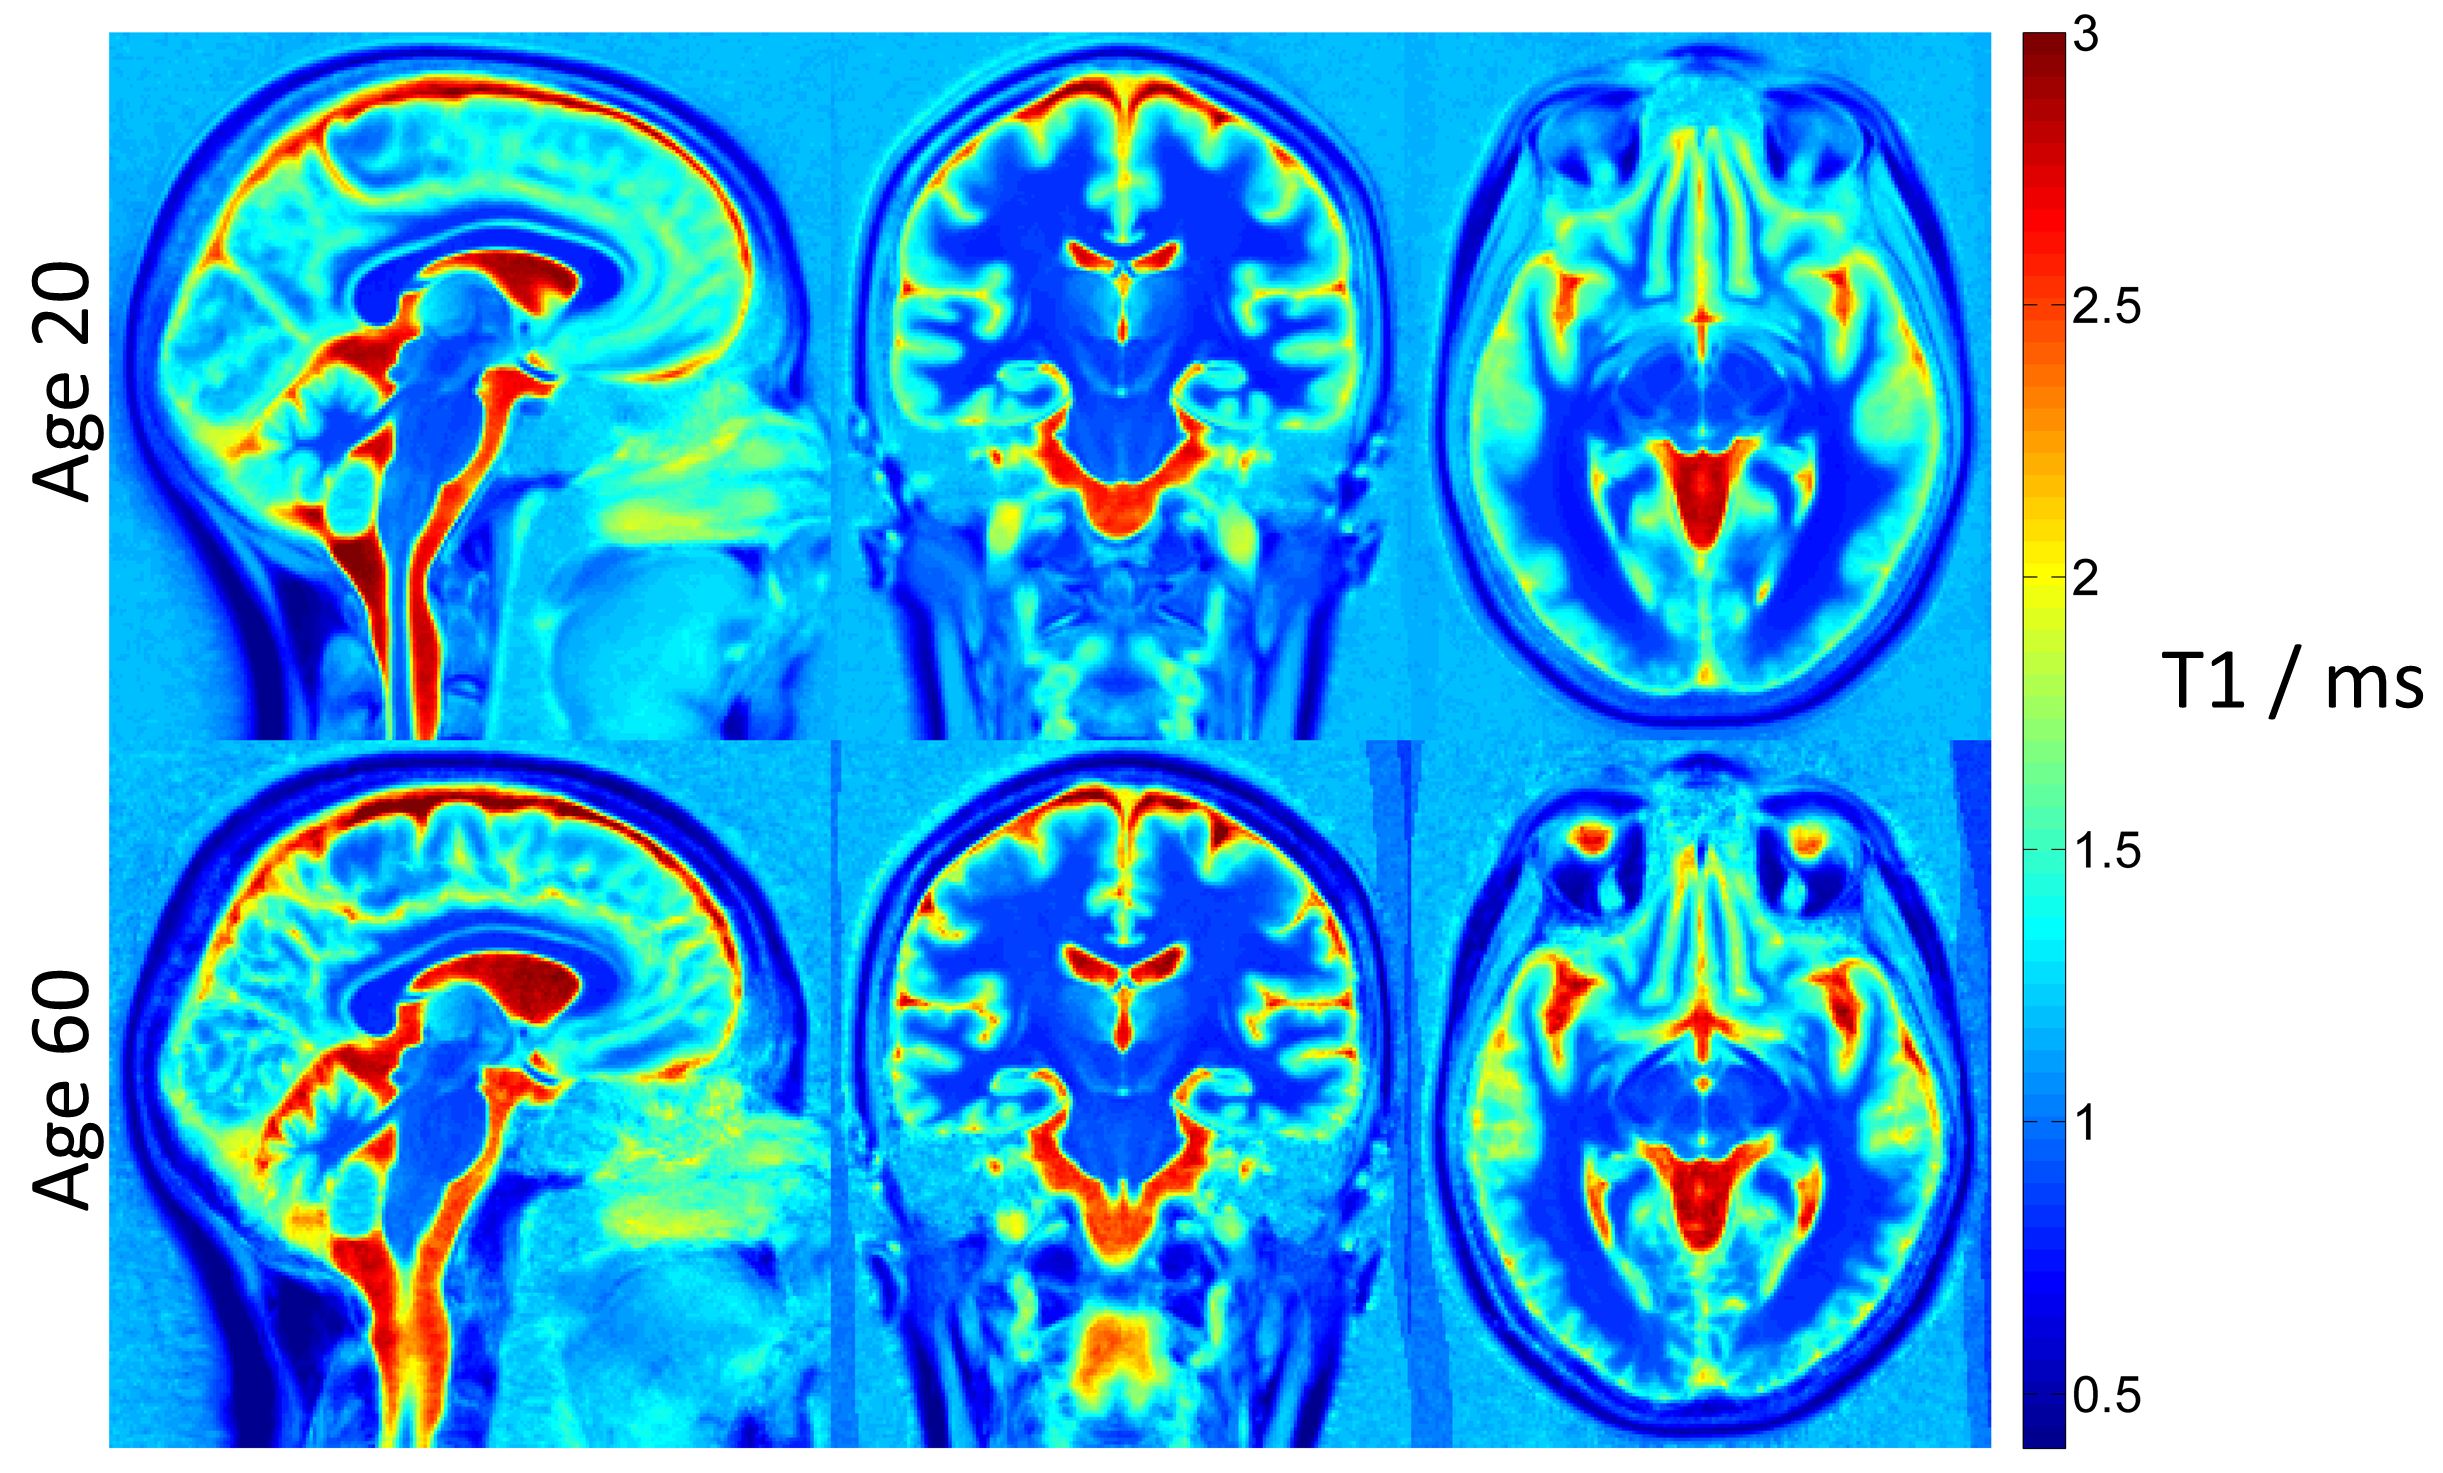
Figure 3 shows the intermediate atlases based on the synT1w contrast for each iteration. The level of detail improves in the atlas most noticeably with the first non-rigid registration step. Figure 4 shows the age-specific quantitative T1 atlas animated over age (20-70 years old). The most obvious change is the increase in atrophy in the cortex with older age. Furthermore, the size of the ventricles appears to increase especially above ~50 years of age. To better show the difference and the level of detail, Figure 5 shows a direct comparison of the age-specific atlases at ages 20 and 60.Discussion & Conclusion
The differences that can be observed across the age range emphasize the importance to use atlases which are tailored for a specific age. In that respect, the use of a weighted mean instead of age groups may help to have a more suitable atlas for comparison of patient data with the atlas for detection of abnormalities.
The main limitation of the proposed method is that it requires a large dataset of healthy subjects in order to create a reliable age-specific atlas across the entire age range. To improve the sampling rate on the employed dataset, no differences between male and female brain shapes and T1 values were therefore assumed.
In conclusion, we introduced a method to create a quantitative atlas which models the changes in T1 and brain shape continuously across different ages. This method may improve comparison methods of single patients to a healthy atlas in order to detect changes in relaxation times, possibly indicating pathological microstructural changes in the tissue.
Acknowledgements
References
- Marques JP, Kober T, Krueger G, van der Zwaag W, Van de Moortele PF, Gruetter R. MP2RAGE, a self bias-field corrected sequence for improved segmentation and T1-mapping at high field. Neuroimage. 2010;49(2):1271-1281. doi:10.1016/j.neuroimage.2009.10.002.
- Sumpf TJ, Uecker M, Boretius S, Frahm J. Model-based nonlinear inverse reconstruction for T2 mapping using highly undersampled spin-echo MRI. J Magn Reson Imaging. 2011;34(2):420-428. doi:10.1002/jmri.22634.
- Ma D, Gulani V, Seiberlich N, et al. Magnetic resonance fingerprinting. (1). Nature. 2013;495(7440):187-192. doi:10.1038/nature11971.
- Deoni SCL. Quantitative relaxometry of the brain. Top Magn Reson Imaging. 2010;21(2):101-113. doi:10.1097/RMR.0b013e31821e56d8.
- Bonnier G, Roche A, Romascano D, et al. Advanced MRI unravels the nature of tissue alterations in early multiple sclerosis. Ann Clin Transl Neurol. 2014;1(6):423-432.
- Piredda GF, Hilbert T, Granziera C, et al. Quantitative T1 and T2 Brain Atlases for the Detection of Abnormal Relaxation Times. In: ISMRM 2018, ISMRM 25rd Annual Meeting & Exhibition,. ; 2018.
- Avants B, Gee JC. Geodesic estimation for large deformation anatomical shape averaging and interpolation. Neuroimage. 2004;23:S139--S150.
- Fonov V, Evans AC, Botteron K, et al. Unbiased average age-appropriate atlases for pediatric studies. Neuroimage. 2011;54(1):313-327.
- Fujimoto K, Polimeni JR, Van Der Kouwe AJW, et al. Quantitative comparison of cortical surface reconstructions from MP2RAGE and multi-echo MPRAGE data at 3 and 7 T. Neuroimage. 2014;90:60-73.
- Klein S, Staring M, Murphy K, Viergever MA, Pluim JPW. elastix: a toolbox for intensity-based medical image registration. IEEE Trans Med Imaging. 2010;29(1):196-205. doi:10.1109/TMI.2009.2035616.
Figures