0337
Characterization of perivascular space morphology in healthy volunteers between 21 and 55 years old1Department of Radiology and BRIC, Univeristy of North Carolina at Chapel Hill, Chapel Hill, NC, United States, 2BRIC, Univeristy of North Carolina at Chapel Hill, Chapel Hill, NC, United States
Synopsis
Perivascular spaces (PVS) are an integral part of the brain’s glymphatic system. Although enlarged PVSs are often observed in older population and patient with neurological diseases, normal PVS morphological features in healthy subjects and their age dependences remain poorly understood. We studied the age-dependence of PVS morphology in healthy volunteers aged 21 – 55. The number and diameters of PVSs were positively correlated with age but exhibited large inter-subject variations. We also found clear spatial heterogeneity in the density of visible PVSs. Further studies are needed to realize the utility of PVS as a potential biomarker for aging and neurological diseases.
INTRODUCTION
Perivascular spaces (PVS) are an integral part of the brain’s glymphatic system, which plays an important role in clearing metabolic wastes in the brain.1 Although enlarged PVSs are often observed in older subjects and patients with neurological diseases,2-5 the morphological features of normal PVSs and their age dependences remain poorly understood. In this study, we aim to characterize the dependences of PVS morphology on age in healthy volunteers with the goal of establishing the normal range of PVS morphology and employing it as a reference for detecting abnormal PVS changes under diseased conditions. As the PVS signal cannot be separated from that of enclosed penetrating arteries (PA), PA diameter was modulated by carbogen breathing to study whether the measured PVS morpholgy depends on PA diameter variations. Furthermore, we monitored subject head motion to control for the potential confounding effects of motion on the measured age dependences.METHODS
Totally 44 healthy volunteers aged 21–55 were scanned on a Siemens 7T MRI scanner with a 3D variable flip angle TSE sequence.6 The sequence parameters were: TE/TR = 328/3000 ms, voxel size = 0.4102×0.4102×0.4 mm3, and FOV = 210×210×99.2 mm3. PVS masks were segmented with a convolutional network, followed by manul refinment.7 To exam age dependence of PVS diameter, the peak PVS diameters along their paths were determined. Then averages of the 10 and 100 largest peak diameters ( Dpeak,10 and Dpeak,100) in subcortical nuclei (SCN; including thalamus and basal ganglia) and white matter (WM) PVSs, respectively, were used as indices for PVS enlargment. To measure head motion, fat navigator images (voxel size 2.2×2.2×2.2 mm3) was acquired with a 3D-GRE sequence in each TR.8 Rigid-body registration was performed on the images to obtain the mean and maximum total translation and rotation (Rmean and Rmax) during the scan. To modulate PA diameters, 35 of the subjects were scanned for a second time while breathing carbogen (5% CO2+95% O2). To assess the spatial distribution of PVS, the PVS masks were transformed to the JHU_MNI_SS atlas using the diffeomorphic Demon algorithm.9, 10RESULTS
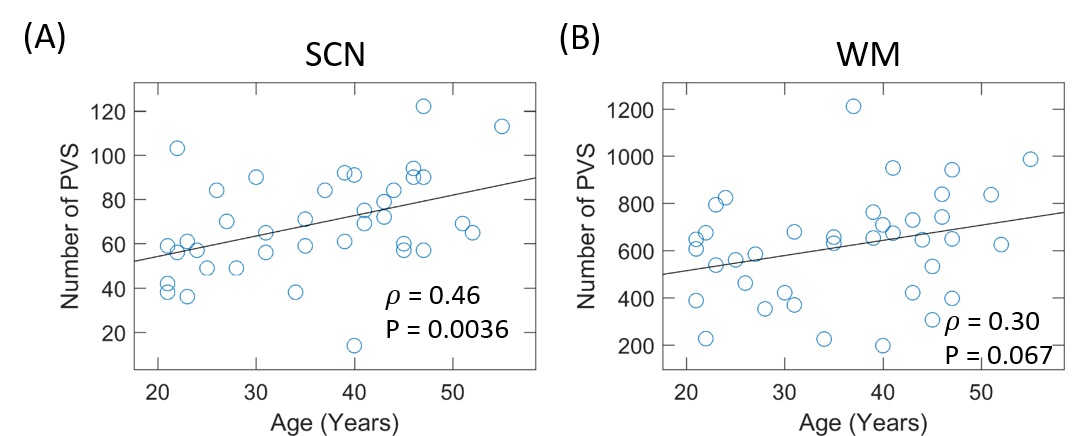
The
number of PVSs (nPVS) in SCN significantly increased with age (Fig. 1A). However, no significant age effect was
observed in WM (Fig. 1B), although there was a trend toward increased
nPVS in older subjects. In addition, there
were large inter-subject variations in nPVS in both SCN and WM in subjects with
similar ages.
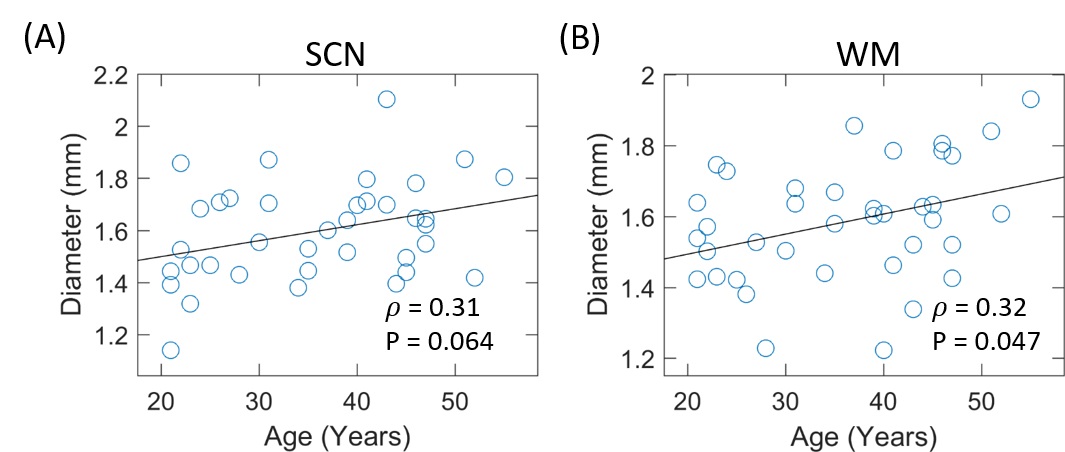
As
shown in Fig. 2, the peak diameters increased with age in both WM and SCN. There were large inter-subject variations in
the diameters in both SCN and WM in subjects with similar age.
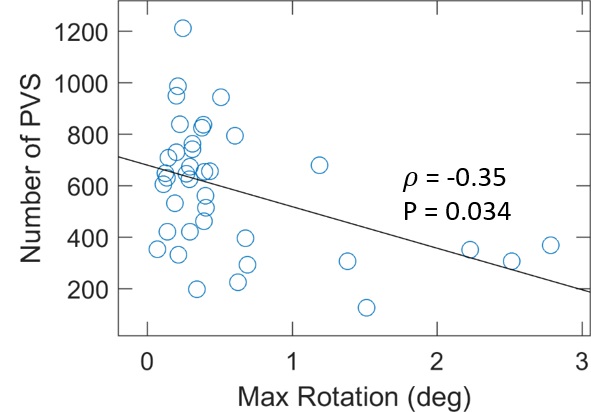
nPVS
in SCN did not show significant correlation with any motion parameters (p≥0.13).
However, Rmax was significantly correlated with nPVS in WM, as shown in
Fig. 3. Age and motion parameters together
explained only 24% and 32% of the inter-subject variances in nPVS in SCN and
WM, respectively. On the other hand, no correlation were observed between Dpeak,10 and Dpeak,100, or age and any of the motion parameters
(p>0.27).
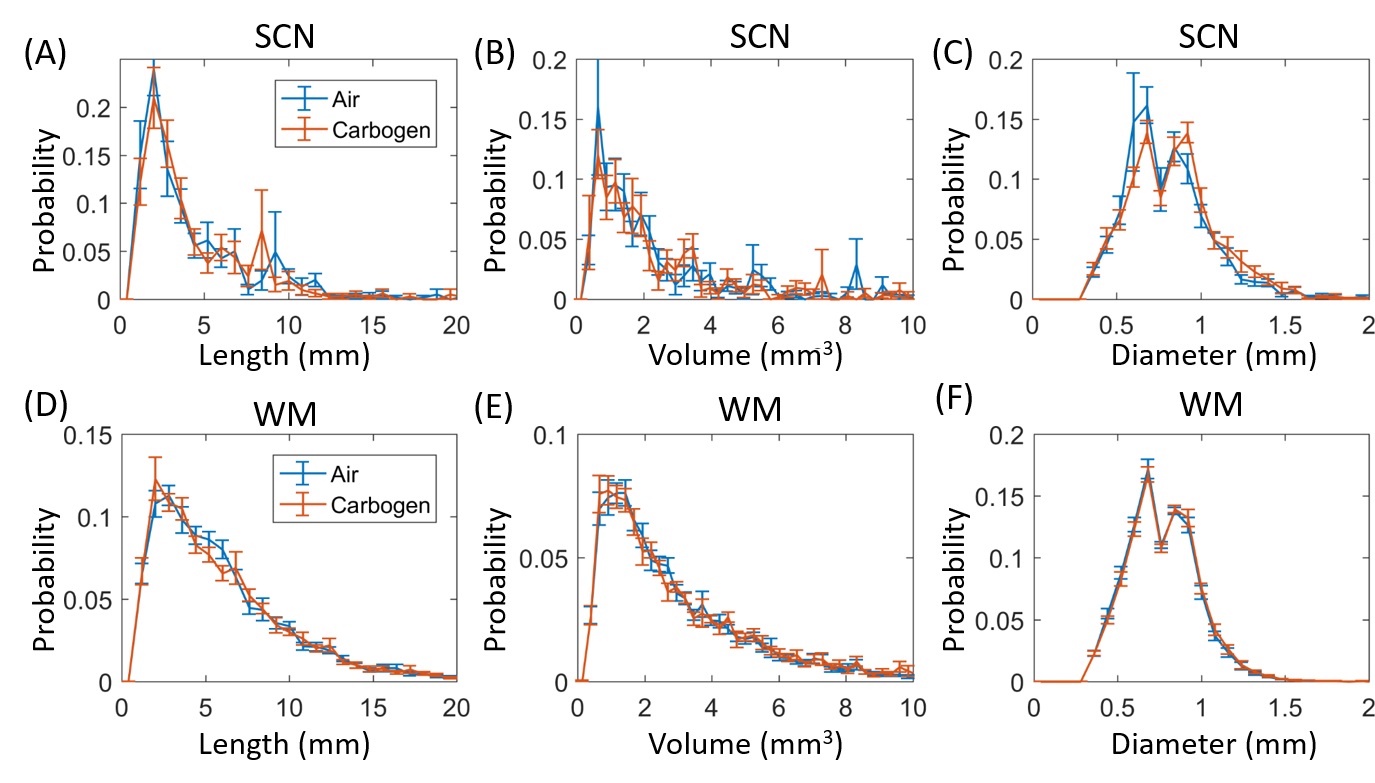
Figure
4 compares the distributions of PVS length, diameter, and volume during air and
carbogen breathing. The distributions
between these two gas conditions were almost identical, suggesting that the measurements
are not susceptible to acute changes in physiological conditions.
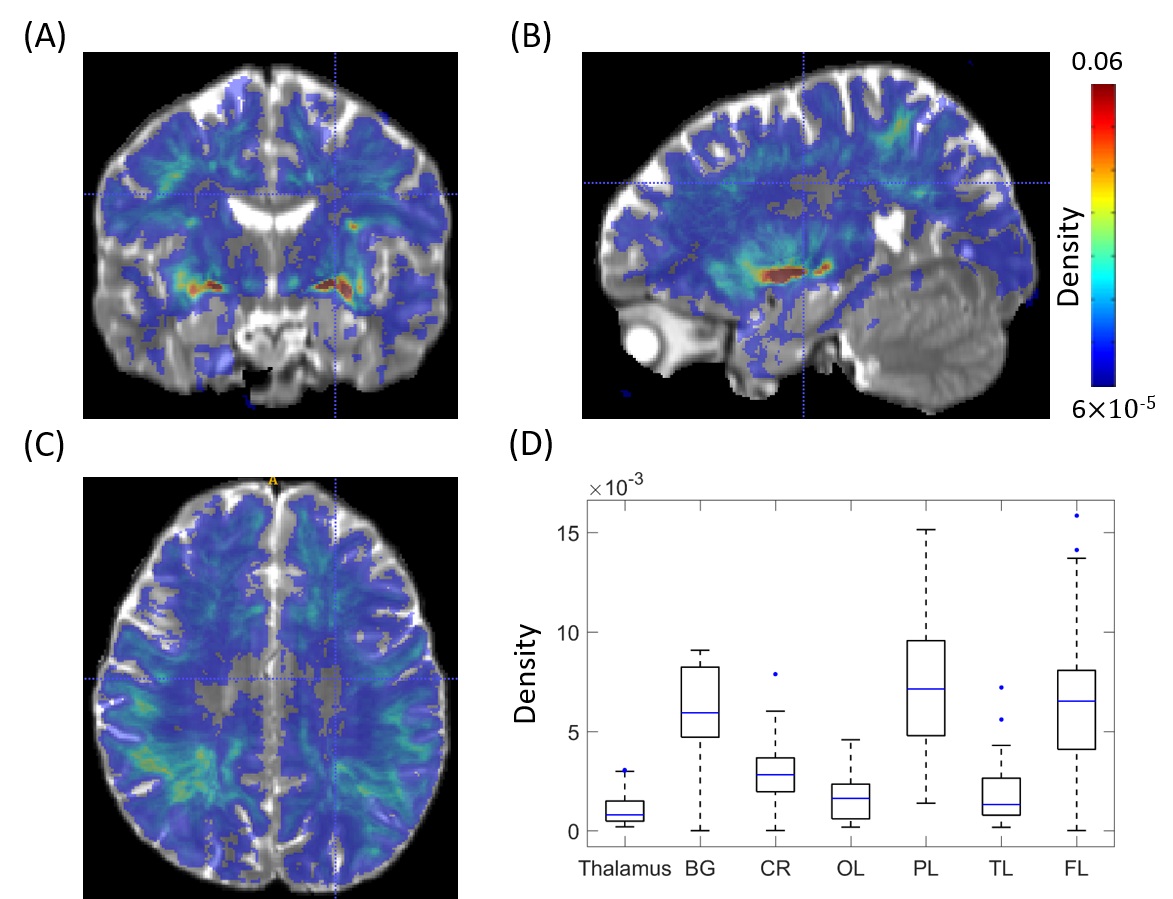
The
group-averaged density of PVS voxels is shown in Fig. 5(A)-(C). PVSs were most often observed in the basal
ganglia, parietal and frontal lobe WMs, while their density appears much lower
in corona radiata, temporal and occipital lobes. The regional differences are also evident in ROI
averaged results in Fig. 5(D).DISCUSSION
The increases in the numbers and diameters of MRI-visible PVSs may be related to age-related activations of astrocyte whose endfeet lines the outer surface of PVS.11 We also found large age and motion independent inter-subject variations in nPVS and diameter. Factors underlying such inter-subject variations must be investigated in order to improve the utility of PVS morpholgy as a potential biomarker for aging and neurological diseases. The spatial heterogeneity of the density of visible PVSs suggest that the PVS may have smaller diameters in some regions, making many of them invisible in our images.CONCLUSIONS
We observed overall positive increases in PVS numbers and diameters with age. The observed PVS morphology is stable under different gas conditions. However, there exist large inter-subject and spatial variations in PVS density and diameters that cannot be explained by age and head motion. The sources of the variations must be further studied to realize the utility of PVS morpholgy for clinical applications.Acknowledgements
This study was supported by NIH grant 5R21NS095027-02.References
1. Iliff JJ, Wang M, Liao Y, Plogg BA, Peng W, Gundersen GA, et al. A paravascular pathway facilitates csf flow through the brain parenchyma and the clearance of interstitial solutes, including amyloid beta. Science translational medicine. 2012;4:147ra111
2. Inglese M, Bomsztyk E, Gonen O, Mannon LJ, Grossman RI, Rusinek H. Dilated perivascular spaces: Hallmarks of mild traumatic brain injury. AJNR Am J Neuroradiol. 2005;26:719-724
3. Maclullich AM, Wardlaw JM, Ferguson KJ, Starr JM, Seckl JR, Deary IJ. Enlarged perivascular spaces are associated with cognitive function in healthy elderly men. Journal of neurology, neurosurgery, and psychiatry. 2004;75:1519-1523
4. Doubal FN, MacLullich AM, Ferguson KJ, Dennis MS, Wardlaw JM. Enlarged perivascular spaces on mri are a feature of cerebral small vessel disease. Stroke. 2010;41:450-454
5. Zhu YC, Tzourio C, Soumare A, Mazoyer B, Dufouil C, Chabriat H. Severity of dilated virchow-robin spaces is associated with age, blood pressure, and mri markers of small vessel disease: A population-based study. Stroke. 2010;41:2483-2490
6. Zong X, Park SH, Shen D, Lin W. Visualization of perivascular spaces in the human brain at 7t: Sequence optimization and morphology characterization. Neuroimage. 2016;125:895-902
7. Lian C, Zhang J, Liu M, Zong X, Hung SC, Lin W, et al. Multi-channel multi-scale fully convolutional network for 3d perivascular spaces segmentation in 7t mr images. Med Image Anal. 2018;46:106-117
8. Gallichan D, Marques JP, Gruetter R. Retrospective correction of involuntary microscopic head movement using highly accelerated fat image navigators (3d fatnavs) at 7t. Magn Reson Med. 2016;75:1030-1039
9. Oishi K, Zilles K, Amunts K, Faria A, Jiang H, Li X, et al. Human brain white matter atlas: Identification and assignment of common anatomical structures in superficial white matter. Neuroimage. 2008;43:447-457
10. Vercauteren T, Pennec X, Perchant A, Ayache N. Diffeomorphic demons: Efficient non-parametric image registration. Neuroimage. 2009;45:S61-72
11. Rozovsky I, Finch CE, Morgan TE. Age-related activation of microglia and astrocytes: In vitro studies show persistent phenotypes of aging, increased proliferation, and resistance to down-regulation. Neurobiology of aging. 1998;19:97-103
Figures