0335
Arterial stiffness and white matter integrity in the elderly: a diffusion tensor and magnetization transfer imaging study1Neurosciences, Faculty of Medicine, Université de Montréal, Montreal, QC, Canada, 2NeuroPoly Lab, Institute of Biomedical Engineering, Polytechnique Montréal, Montréal, QC, Canada, 3Unité de Neuroimagerie Fonctionnelle (UNF), Centre de recherche de l’Institut Universitaire de Gériatrie de Montréal (CRIUGM), Montréal, QC, Canada, 4Department of biomedical Sciences, Faculty of Medicine, Université de Montréal, Montreal, QC, Canada, 5Montreal Heart Institute, Montréal, QC, Canada, 6Department of Psychology, Faculty of Arts and Sciences, Université de Montréal, Montréal, QC, Canada, 7Department of biomedical Sciences, Faculty of Medicine, Université de Montréal, Montréal, QC, Canada, 8Institut de Recherches Cliniques de Montréal, Université de Montréal, Montréal, QC, Canada, 9Department of Pharmacology and Physiology, Faculty of Medicine, Université de Montréal, Montréal, QC, Canada
Synopsis
Arterial stiffness is a common condition arising with aging and is associated with an elevated risk for white matter structural abnormalities in the brain. The goal of this study is to combine white matter sensitive techniques (DTI, MTsat) to better understand the impact of arterial stiffness on the white matter microstructure and cognitive health in healthy elderly. Results suggest that arterial stiffness is associated with axon degeneration rather than demyelination. Findings from this study also show that improved executive function performance correlates with white matter metrics. Controlling arterial stiffness might play a role in maintaining the health of white matter axons in the aging brain and thus prevent or slow cognitive decline.
Introduction
Arterial stiffness in large arteries refers to the reduced capacity of the vessels to buffer the pulsatile flow generated by the heart at each contraction 1. Stiffness of large elastic arteries such as the carotids and the aorta is a common condition that arises with aging 2 and is associated with an elevated risk for structural and functional abnormalities in the brain 3. For instance, white matter (WM) lesions were shown to correlate with central artery stiffness 4,5. However, mechanisms linking arterial stiffness and cognitive health remain poorly explored. The goal of this study is to combine WM sensitive techniques (diffusion tensor imaging (DTI) and magnetization transfer saturation (MTsat)) to better understand the impact of arterial stiffness on the WM microstructure and cognition in healthy elderly.
Methods
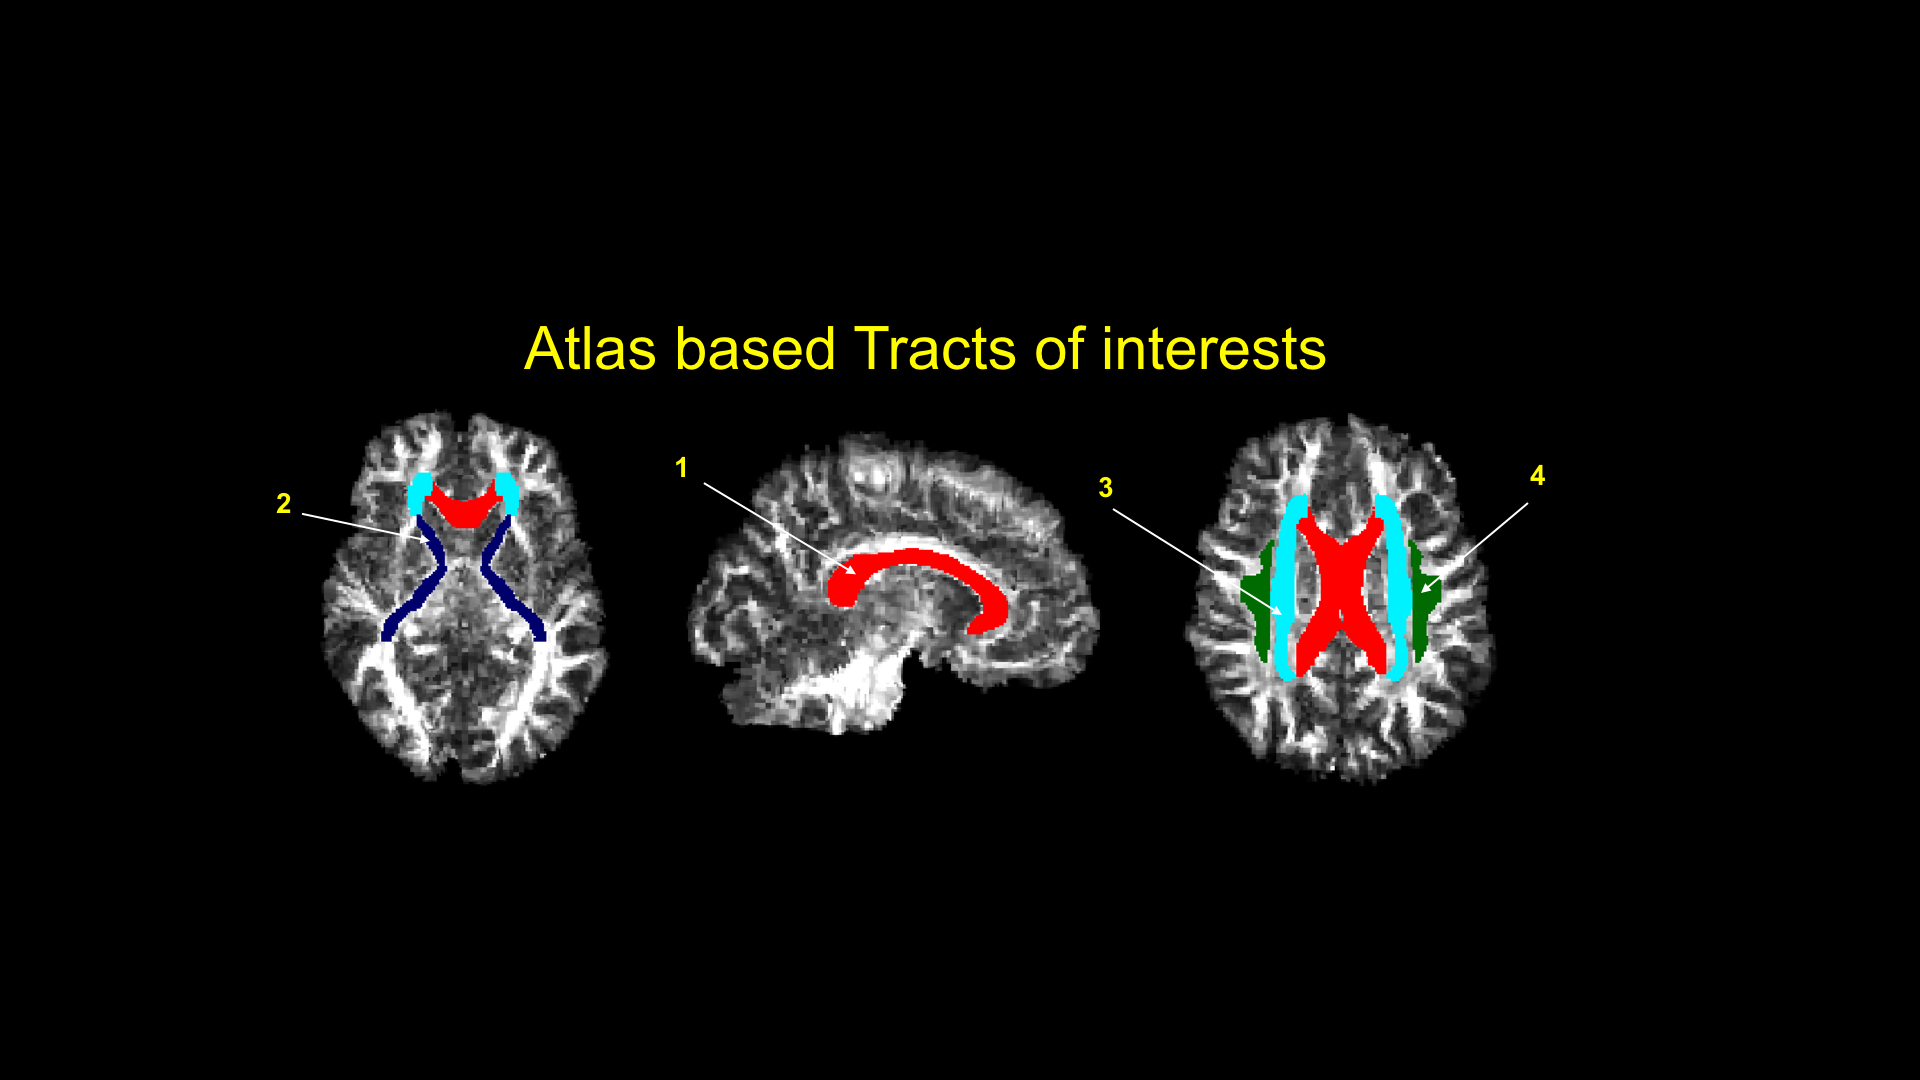
54 healthy individuals (age=69.91±3.31years) were scanned on a 3T whole-body scanner (MAGNETOM Prisma Fit, Siemens, 32-channel head coil) to compute diffusion tensor metrics as well as to estimate the MTsat-based myelin volume fraction (MVF). Acquisition were: 1) diffusion-weighted images (DWI, TE/TR=63/2200ms, 3 b-value shells: 300/1k/2k s/mm2, number of directions: 7/29/64, resolution=2.0x2.0x2.0mm3, TA=4.37min), 2) three T1-, PD- and MT-weighted spoiled gradient echo (TR/α = 18 ms/20° for T1w and 28 ms/6° for PDw and MTw scans, resolution:1.5x1.5x1.5mm3, total TA=8.86min). Processing. 1) DWIs were pre-processed using the Toolkit for Analysis in Diffusion MRI (TOAD) (http://unf-montreal.ca/toad), 2) following motion correction and eddy current distortion correction, data were denoised using an mp-pca method 6, 3) the diffusion tensor fraction anisotropy (FA) and radial diffusivity (RD) were calculated; the selection of metrics was based on previous studies which highlighted the relevance of those metrics for assessing white matter damage associated with arterial stiffness 5,7,8, 4) MTsat was computed from the T1- PD- MT-weighted volumes using the method described by 9, 4) a combined MT/histology dataset 10 was used as a ground truth to relate MTsat to the absolute MVF using a linear model: MVF = c x MTsat+b with b=0.0701 and c=5.8857, 5) then, data were aligned into the JHU-ICBM-FA template using the Ants registration tools (Figure 1) 11. ROI analysis was performed using the ICBM-DTI-81 WM atlas 12 and included 4 regions denoted vulnerable to arterial stiffness: the corpus callosum, the internal capsule, the corona radiata and the superior longitudinal fasciculus 5,7,8, 6) central artery stiffness was measured using the gold standard carotid-femoral pulse wave velocity measurement (cfPWV) following the Van Bortel protocol 13, 7) the difference between time in completing the trail making test B and A (TMTB-A) in seconds 14 was considered as a measure of cognitive flexibility and executive function, 8) finally the relationship between cfPWV and DTI metrics, as well as the relationship between DTI metrics and TMTB-A were assessed using Spearman’s rank correlation. Correction for multiple comparisons was performed using the false discovery rate procedure following Benjamini-Hochberg et al. 15.Results
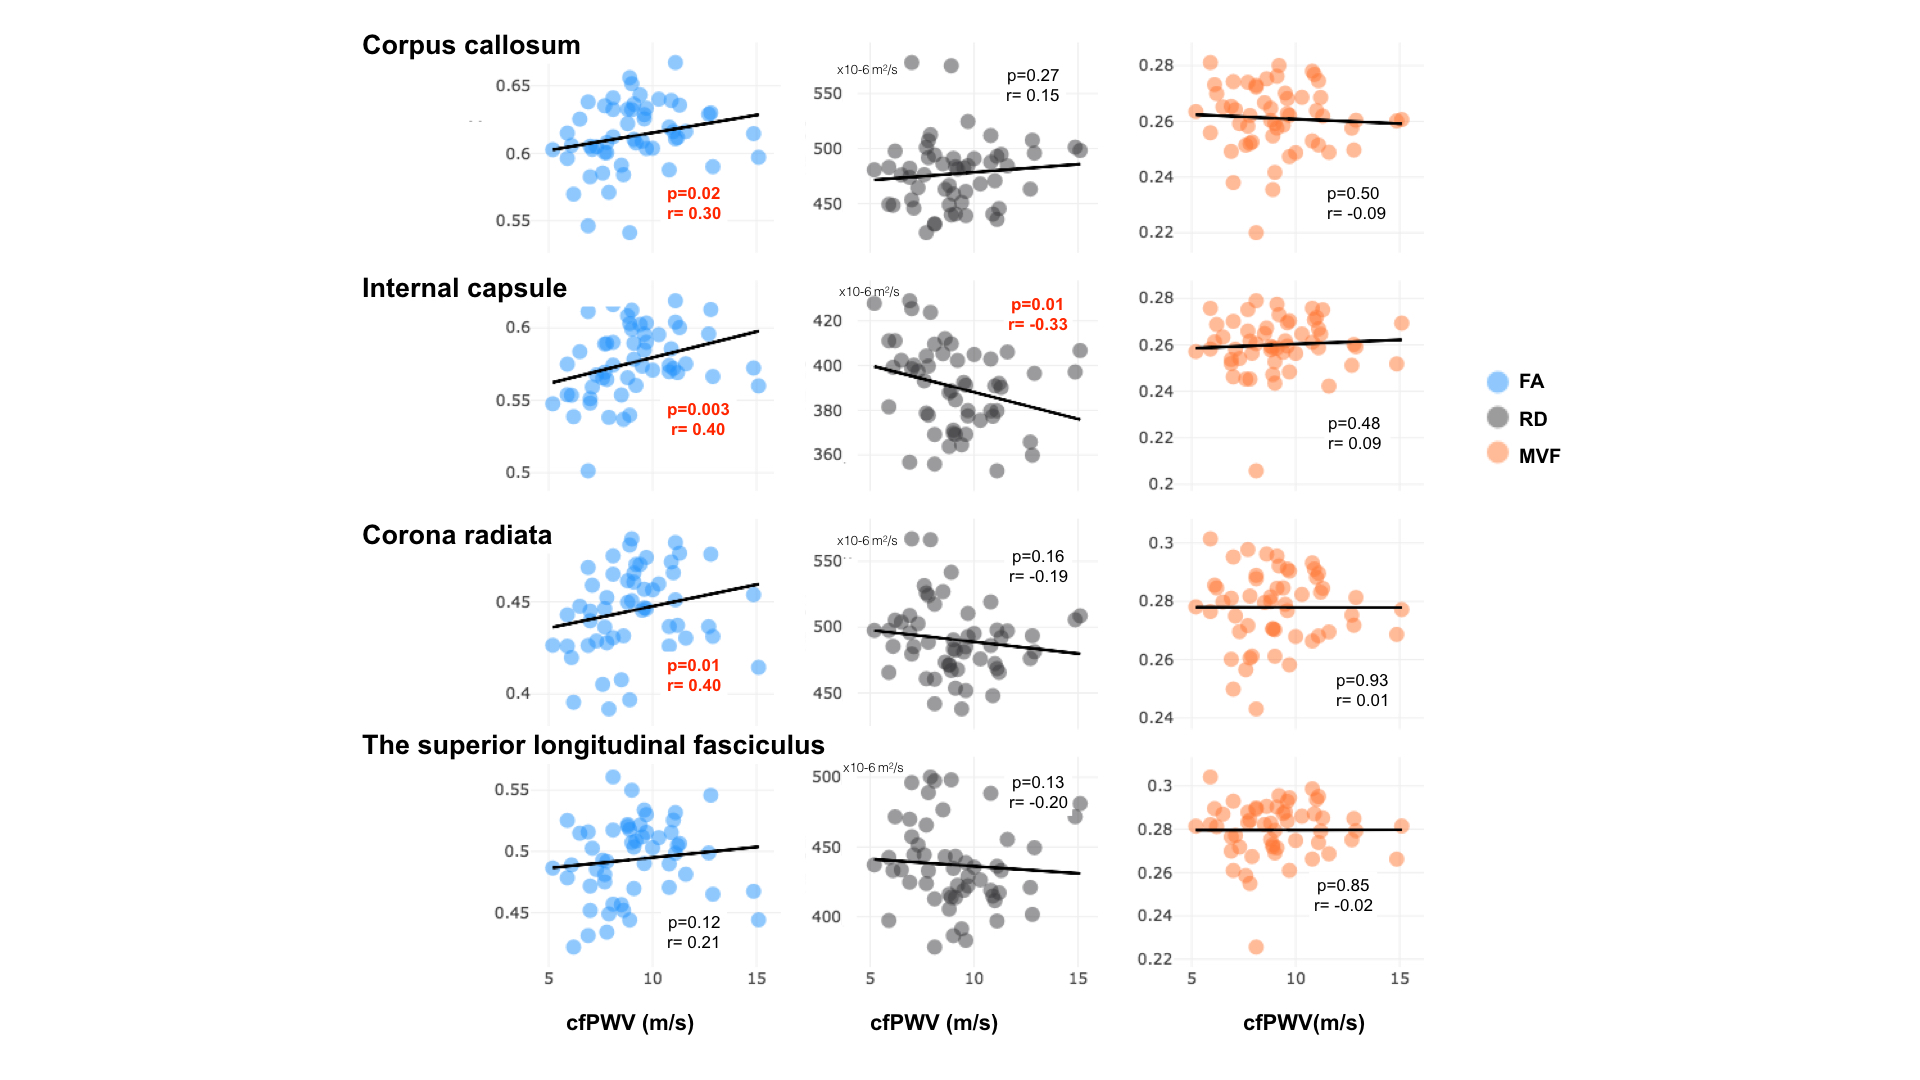
Figure 2 highlights that cfPWV was significantly associated with FA in the corpus callosum (rho=0.30, p=0.02), in the internal capsule (rho=0.40, p=0.003) and in the corona radiata (rho=0.40, p=0.01). In addition, cfPWV was significantly associated with RD in the internal capsule (rho=-0.33, p=0.01). In contrast, cfPWV was not associated with MVF in any of our regions of interest.
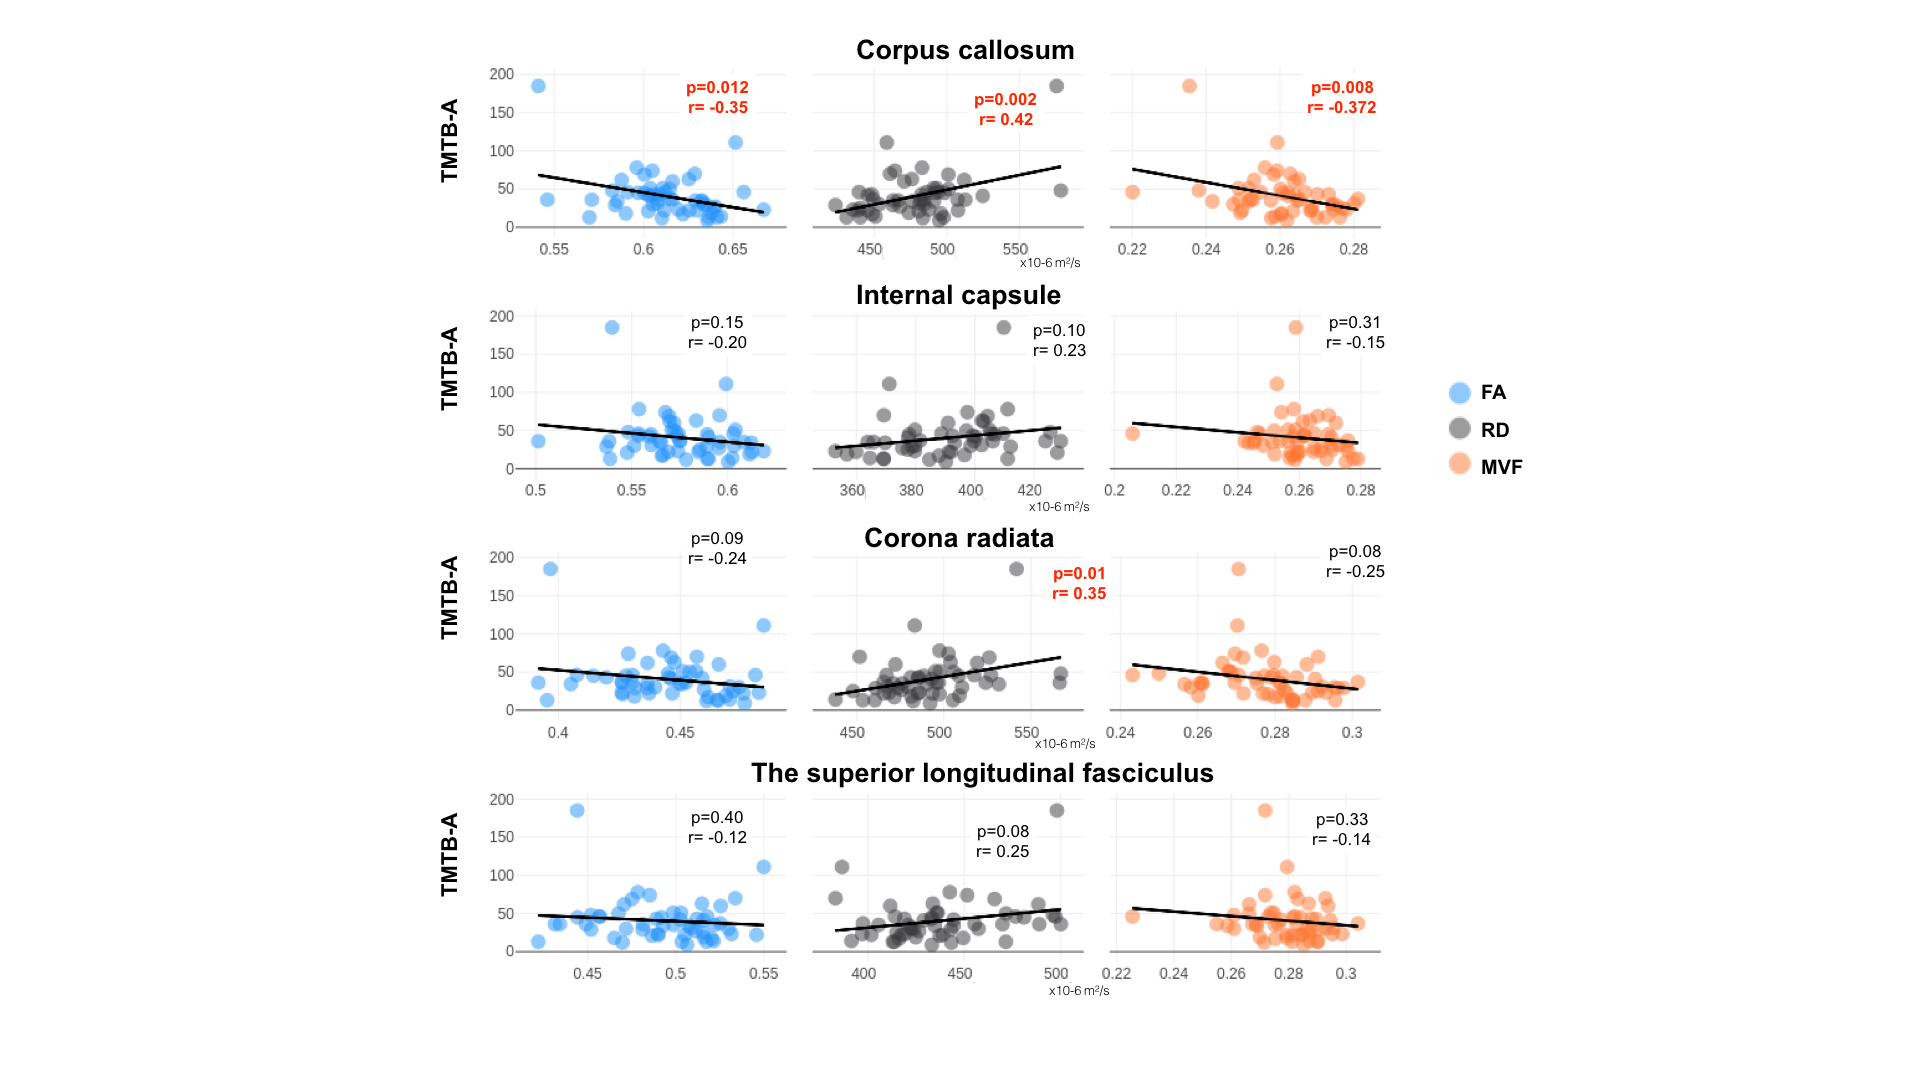
Figure 3 shows that TMTB-A was significantly associated with FA, RD and MVF in the corpus callosum (rho=-0.35, p=0.012; rho=0.43, p=0.003; rho=-0.37, p=0.008 respectively). A significant correlation between TMBT B-A and RD was also found in the corona radiata (rho=0.35, p=0.01).
Conclusion/Discussion
These findings suggest that arterial stiffness is associated with axon degeneration rather than demyelination. Findings from this study also show that improved executive function performance correlates with FA positively as well as with MVF and RD negatively. Future studies using more advanced diffusion models (e.g., NODDI, TEdDI) could potentially help better understanding the impact of arterial stiffness on axonal structure as well as determining the effect of arterial stiffness medication on white matter health.Acknowledgements
The authors would like to acknowledge all NeuroPoly Lab members (Polytechnique Montreal), including Dominique Eden, Charley Gros, Simon Levy and Tommy Boshkovski. Carollyn Hurst and André Cyr from the Functional Neuroimaging Unit (CRIUGM, Université de Montréal) are acknowledged for helping with data acquisitions. Marie-Christine Robitaille-Grou is acknowledged for help with statistics and Arnaud Boré is acknowledged for helping with the analysis of diffusion data.
References
1. Iulita, M. F., Noriega de la Colina, A. & Girouard, H. Arterial stiffness, cognitive impairment and dementia: real risk or confounding factor? J. Neurochem. (2017). doi:10.1111/jnc.14235
2. Mitchell, G. F. et al. Cross-Sectional Correlates of Increased Aortic Stiffness in the Community. Circulation 115, 2628–2636 (2007).
3. Rusanen, M. et al. Heart diseases and long-term risk of dementia and Alzheimer’s disease: a population-based CAIDE study. J. Alzheimers. Dis. 42, 183–191 (2014).
4. Longstreth, W. T., Jr et al. Clinical correlates of white matter findings on cranial magnetic resonance imaging of 3301 elderly people. The Cardiovascular Health Study. Stroke 27, 1274–1282 (1996).
5. Tarumi, T. et al. Central artery stiffness, baroreflex sensitivity, and brain white matter neuronal fiber integrity in older adults. Neuroimage 110, 162–170 (2015).
6. Manjón, J. V. et al. Diffusion weighted image denoising using overcomplete local PCA. PLoS One 8, e73021 (2013).
7. Maillard, P. et al. Aortic Stiffness, Increased White Matter Free Water, and Altered Microstructural Integrity: A Continuum of Injury. Stroke 48, 1567–1573 (2017).
8. Maillard, P. et al. Effects of Arterial Stiffness on Brain Integrity in Young Adults From the Framingham Heart Study. Stroke 47, 1030–1036 (2016).
9. Helms, G., Dathe, H., Kallenberg, K. & Dechent, P. High-resolution maps of magnetization transfer with inherent correction for RF inhomogeneity and T1 relaxation obtained from 3D FLASH MRI. Magn. Reson. Med. 60, 1396–1407 (2008).
10. Stikov, N. et al. In vivo histology of the myelin g-ratio with magnetic resonance imaging. Neuroimage 118, 397–405 (2015).
11. Avants, B. B. et al. A reproducible evaluation of ANTs similarity metric performance in brain image registration. Neuroimage 54, 2033–2044 (2011).
12. Mori, S. et al. Stereotaxic white matter atlas based on diffusion tensor imaging in an ICBM template. Neuroimage 40, 570–582 (2008).
13. Van Bortel, L. M. et al. Expert consensus document on the measurement of aortic stiffness in daily practice using carotid-femoral pulse wave velocity. J. Hypertens. 30, 445–448 (2012).
14. Koch, K. et al. Age-dependent visuomotor performance and white matter structure: a DTI study. Brain Struct. Funct. 218, 1075–1084 (2013).
15. Benjamini, Y. & Hochberg, Y. Controling the false discovery rate: a practical and. Parmigiani et al 39, (1995).
Figures