0334
Evaluation of standardized as well as study-specific and age-specific structural T1-weighted brain templates for use in studies on older adults1Biomedical Engineering, Illinois Institute of Technology, Chicago, IL, United States, 2Rush Alzheimer’s Disease Center, Rush University, Chicago, IL, United States
Synopsis
Atlas-based MRI investigations on older adults often utilize young adult standardized templates, such as those of the ICBM. Additionally, a thorough, quantitative assessment of how available standardized, study-specific and age-specific structural templates perform in studies on older adults has not yet been conducted. Here, a new standardized T1-weighted template was developed specifically for studies on older adults, and was compared to 25 other standardized, study-specific, and age-specific templates, in terms of image quality and inter-subject spatial normalization accuracy.
Introduction
Atlas-based MRI investigations on older adults often utilize young adult standardized templates, such as those of the ICBM. Additionally, a thorough, quantitative assessment of how available standardized, study-specific and age-specific structural templates perform in studies on older adults has not yet been conducted. The purpose of this work was to construct a new standardized T1-weighted template of the older adult brain and systematically compare its performance to that of 25 other standardized, study-specific, and age-specific templates, in terms of image quality and inter-subject spatial normalization accuracy.Methods
Development of the IIT-Aging Template:
T1-weighted brain MRI data from 222 non-demented older adults (65-95 age-range, male: female=1:1) participating in the Rush Memory and Aging Project1 (MAP) were collected on a 3T MRI scanner (1mm isotropic) and used in this work to construct a structural template of the older adult brain based on ANTs registration2,3,4 In the following, this template is referred to as the IIT-Aging template. Figure 1A shows a schematic representation of the template construction technique. To investigate the effect of the number of participants included in template construction on the performance of the template, additional templates were generated with different number of participants and the same distribution of age and sex.
Comparison to other Standardized and Study-Specific Templates:
IIT-Aging, along with 25 other standardized templates5-12,13 and one study specific template were compared in terms of the inter-subject spatial normalization accuracy achieved when used as references for normalization4 of T1-weighted data from 222 non-demented ADNI14 participants (65-95 age range, male: female=1:1). The data from these ADNI participants were used to construct the study specific template, denoted as ADNI_65-95, using the same template-building method as for IIT-Aging.
Comparison to Age-Specific Templates:
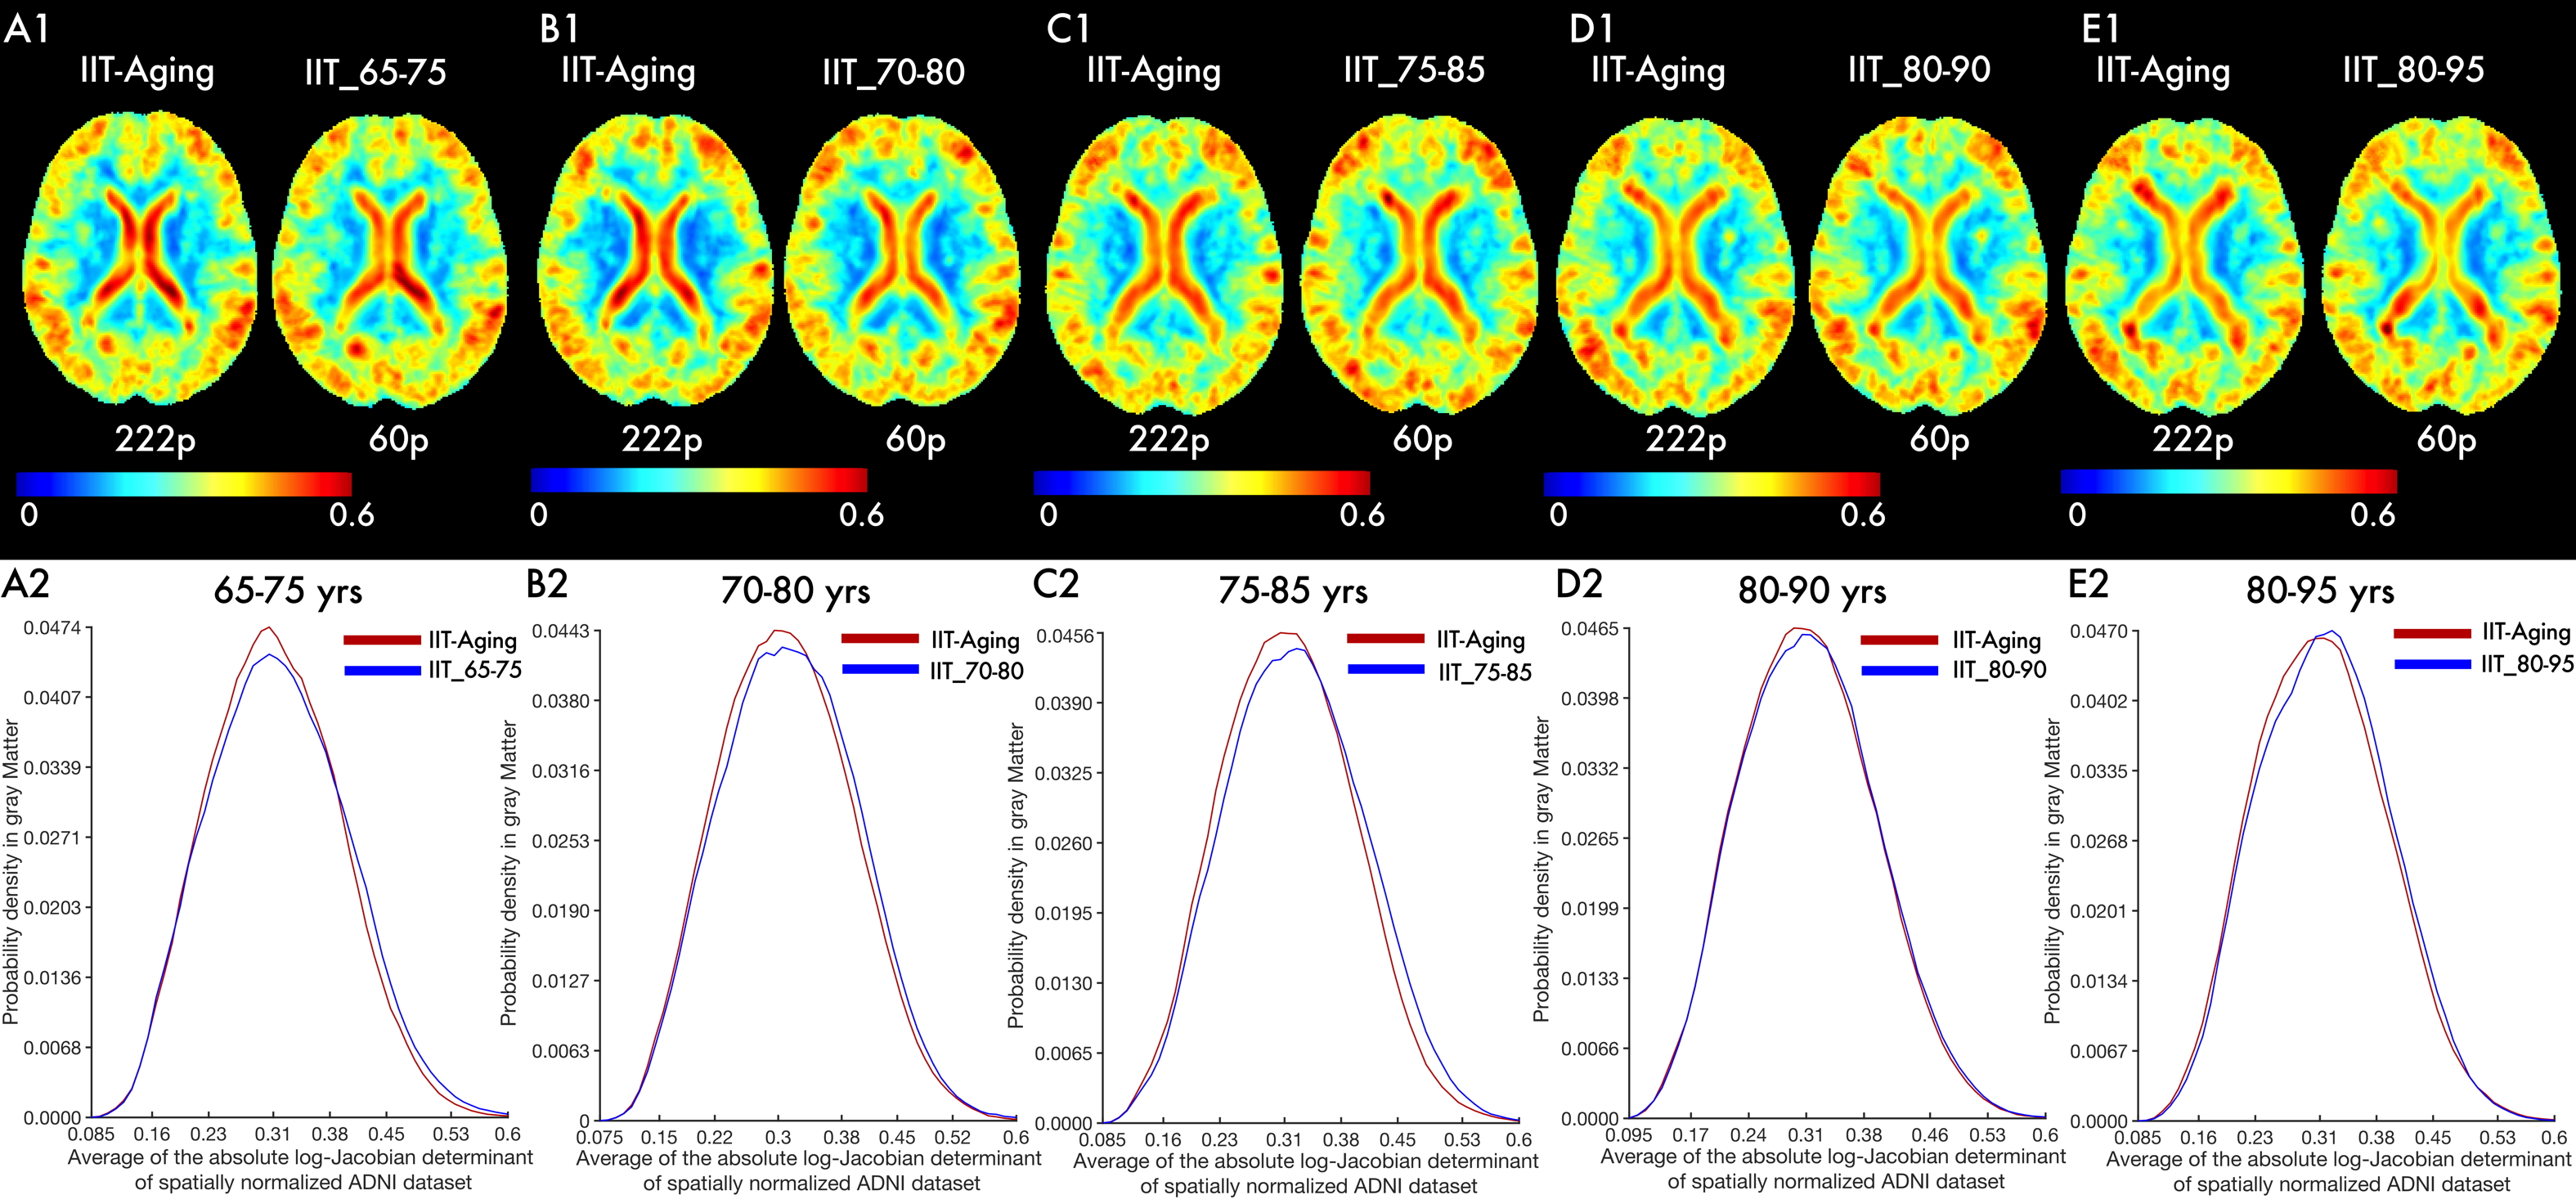
Five age-specific templates were constructed using data from 60 MAP participants each for the age-ranges: 65-75, 70-80, 75-85, 80-90, 80-95 years, while maintaining male:female=1:1. Each age-specific template was compared to IIT-Aging in terms of the inter-subject spatial normalization accuracy achieved when used as references for normalization of T1-weighted data from groups of 60 non-demented ADNI participants having the same age-range and sex-distribution as the age-specific template. All of the above templates were compared in terms of image sharpness by means of the normalized power-spectral density. In all comparisons, spatial normalization accuracy was assessed for each template by means of the average pairwise overlap of Freesurfer-generated15 regional gray matter labels (Generalized Tanimoto Coefficient) over all spatially normalized ADNI participants. The standard deviation and average of the absolute log-Jacobian determinant of deformations in the gray matter of ADNI participants were also computed.
Results and Discussion
Template performance increased gradually as the number of participants considered in the construction of the template increased, and plateaued after ~100 participants (Fig.1B,C,D). This demonstrates that the IIT-Aging template was constructed on a sufficiently high number of participants. The IIT-Aging template had high power at high spatial frequencies in the power spectra across all axes on average (Fig. 2A,B). This shows that the IIT-Aging template has high sharpness and contains high level of detail, which was also evident by visual inspection. Spatial normalization accuracy of ADNI data was higher when using the IIT-Aging compared to all other standardized templates. This finding has very important implications for template selection in studies of older adults. Only the study-specific ADNI_65-95 template resulted in slightly higher spatial normalization accuracy of ADNI data, by 1% in terms of the Generalized Tanimoto Coefficient (Fig.3A,B,C). This was due to the fact that the same data being normalized were included in the construction of the study-specific template, as well as the fact that template construction was done very carefully following the same strategy as that for IIT-Aging. If the approach for constructing the study-specific template is not as thoroughly optimized, or if there are limitations in the quality or the number of datasets used, the performance of the study-specific template could be far lower than what is shown here. The IIT-Aging, ADNI_65-95 and MCALT_1.5mm template required lower spatial deformation for spatially normalizing ADNI datasets compared to all other standardized templates (Fig.3D,E). Spatial normalization accuracy of ADNI data from certain age-groups (10 year age-range) was slightly higher (<1%) (Fig.4), and less deformation was required (Fig.5), when using the IIT-Aging template compared to the corresponding age-specific templates.Conclusion
The new IIT-Aging T1-weighted template exhibits high image quality and provides consistently higher spatial normalization accuracy for older adults of any age-range compared to other available standardized templates. A study-specific template may provide only a slight improvement, but its performance is heavily dependent on a number of study-specific factors that, if not carefully considered, could render it rather suboptimal.Acknowledgements
National Institute on Aging R01AG052200References
1. A Bennett D, A Schneider J, S Buchman A, et al. Overview and findings from the rush Memory and Aging Project. Current Alzheimer Research. 2012;9(6):646-63.
2. Avants BB, Yushkevich P, Pluta J, et al. The optimal template effect in hippocampus studies of diseased populations. Neuroimage. 2010;49(3):2457-66.
3. Avants BB, Tustison NJ, Song G, et al. A reproducible evaluation of ANTs similarity metric performance in brain image registration. Neuroimage. 2011;54(3):2033-44.
4. Avants BB, Epstein CL, Grossman M, et al. Symmetric diffeomorphic image registration with cross-correlation: evaluating automated labeling of elderly and neurodegenerative brain. Medical image analysis. 2008;12(1):26-41.
5. UNC-Adult, UNC-Elderly (https://www.nitrc.org/projects/unc_brain_atlas)
6. Ashburner J. A fast diffeomorphic image registration algorithm. Neuroimage. 2007;38(1):95-113.
7. Rohlfing T, Zahr NM, Sullivan EV, et al. The SRI24 multichannel atlas of normal adult human brain structure. Human brain mapping. 2010;31(5):798-819.
8. Fonov V, Evans AC, Botteron K, et al. Brain Development Cooperative Group. Unbiased average age-appropriate atlases for pediatric studies. Neuroimage. 2011;54(1):313-27.
9. Fonov VS, Evans AC, McKinstry RC, et al. Unbiased nonlinear average age-appropriate brain templates from birth to adulthood. NeuroImage. 2009(47):S102.
10. Holmes CJ, Hoge R, Collins L, et al. Enhancement of MR images using registration for signal averaging. Journal of computer assisted tomography. 1998;22(2):324-33.
11. LPBA40, ICBM452, ICBM305 (http://www.loni.usc.edu/resources/atlases)
12. Schwarz CG, Gunter JL, Ward CP, et al. THE MAYO CLINIC ADULT LIFE SPAN TEMPLATE: BETTER QUANTIFICATION ACROSS THE LIFE SPAN. Alzheimer's & Dementia: The Journal of the Alzheimer's Association. 2017;13(7):P93-4.
13. Tustison NJ, Cook PA, Klein A, et al. Large-scale evaluation of ANTs and FreeSurfer cortical thickness measurements. Neuroimage. 2014;99:166-79.
14. Weiner MW, Veitch DP, Aisen PS, et al. The Alzheimer's Disease Neuroimaging Initiative: a review of papers published since its inception. Alzheimers Dement. 2013;9(5):e111-94.
15. Fischl B. FreeSurfer. Neuroimage. 2012;62(2):774-81.
Figures