0333
The link between vascular stiffness and resting-state fMRI measures in healthy aging1Rotman Research Institute, Toronto, ON, Canada, 2Physiology, University of Toronto, Toronto, ON, Canada, 3Institute of Medical Science, University of Toronto, Toronto, ON, Canada, 4SickKids Hospital, Toronto, ON, Canada, 5Sunnybrook Research Institute, Toronto, ON, Canada, 6Bloorview Research Institute, Holland Bloorview Kids Rehabilitation Hospital, Toronto, ON, Canada
Synopsis
Arterial pulse-wave velocity (PWV) is an established measure of vascular stiffness which is an important risk factor in cardiovascular disease and brain dysfunction. It remains unclear, however, whether PWV variations across age is associated with changes in resting-state fMRI (rs-fMRI) measures, as the fMRI signal is a heavily vascular signal. In this study, we show that PWV has a significant impact on rs-fMRI signal fluctuation amplitude and functional connectivity. Moreover, PWV effects are distinct from those of age, and may not have neuronal underpinnings.
Introduction
Arterial stiffening is a common sign of normal aging. Arterial pulse-wave velocity (PWV) is an established measure of vascular stiffness, which is an important risk factor in cardiovascular disease and brain dysfunction. Most studies of age-related brain function use resting-state fMRI (rs-fMRI) as a marker of brain activity, without accounting for vascular changes. It is well documented, that both the amplitude of BOLD response 1 and the variance of resting-state BOLD signal decrease with increasing age 2. The same is true for functional connectivity measured in resting-state fMRI data 3. It is unclear, however, whether PWV is associated with different BOLD-based measures in healthy adults. The aim of our study was to investigate this relationship.Methods
We studied a healthy transgenerational cohort of 49 subjects (25 parents ages 44-67 (9 M/16 F) and 24 adult offspring ages 18-39 (7 M/17 F)). MRI data were acquired using a Philips Achieva 3.0T scanner. A high-resolution (1mm isotropic) T1 anatomical was acquired. rs-fMRI: data was acquired using a dual-echo pCASL sequence (TR/TE1/TE2 = 4 s/10 ms/30.7 ms, labeling duration = 1.5 s, 3.4x3.4x4.5 mm voxels). CBF: data was taken from the 1st TE of the dual-echo pCASL sequence. PWV: cardiac MRI data were acquired in the same scan session (flip angle = 10 degrees, TR = 4.9 ms, TE = 3.0 ms, temporal resolution interpolated to ~25 ms during reconstruction, slice thickness = 8 mm, field of view = 350 mm, matrix size = 240 × 240, 1.46 × 1.46 mm2 in-plane resolution, and Venc = 200 cm/s). First, an aortic localizer showing the “candy cane” view of the aorta was acquired, followed by a retrospectively ECG-gated phase-contrast scan to measure through-plane flow at two slice locations, one positioned through the aortic arch to quantify flow in the ascending and descending portions of the arch, and a second slice positioned in the abdominal aorta proximal to the bifurcation. Blood-pressure data were also collected on all subjects.
We preprocessed the BOLD (2nd echo) data as: motion correction, slice-timing correction, coregistration to anatomical images and spatial smoothing. The BOLD data also underwent aCompCor physiological noise removal 4. We generated BOLD variance maps from the preprocessed rs-fMRI data using MATLAB. To represent functional connectivity, we computed intrinsic connectivity contrast (ICC) maps for each participant 5,6. We also derived quantitative perfusion (CBF) using the 1st echo data and the ENABLE algorithm 7. Aortic PWV was calculated from phase-contrast data (TR/TE=4.9/3ms) using the software Segment 8. Finally, we generated group-level statistical maps relating PWV and the BOLD variance, corrected for multiple comparisons (FSL Randomise, 10,000 permutations, with TFCE). We repeated the same analysis for the CBF data.
Results
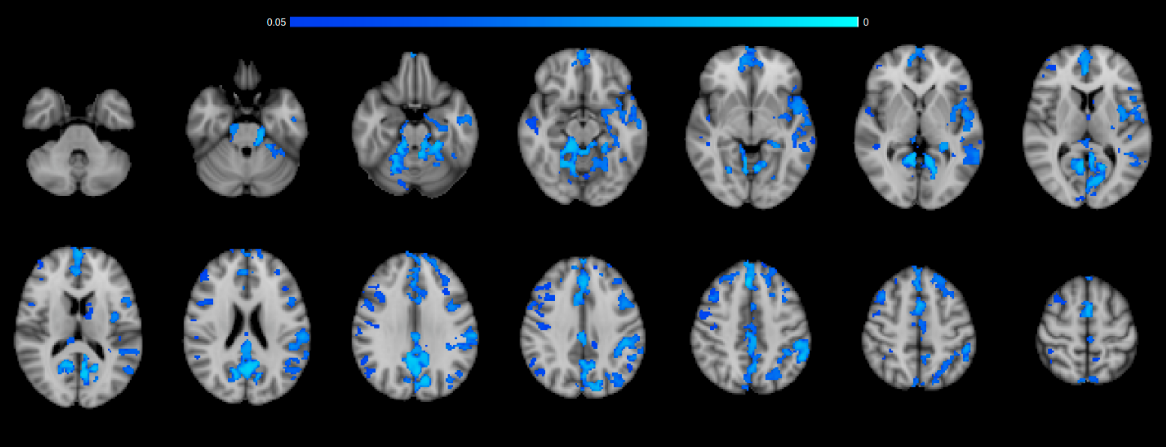
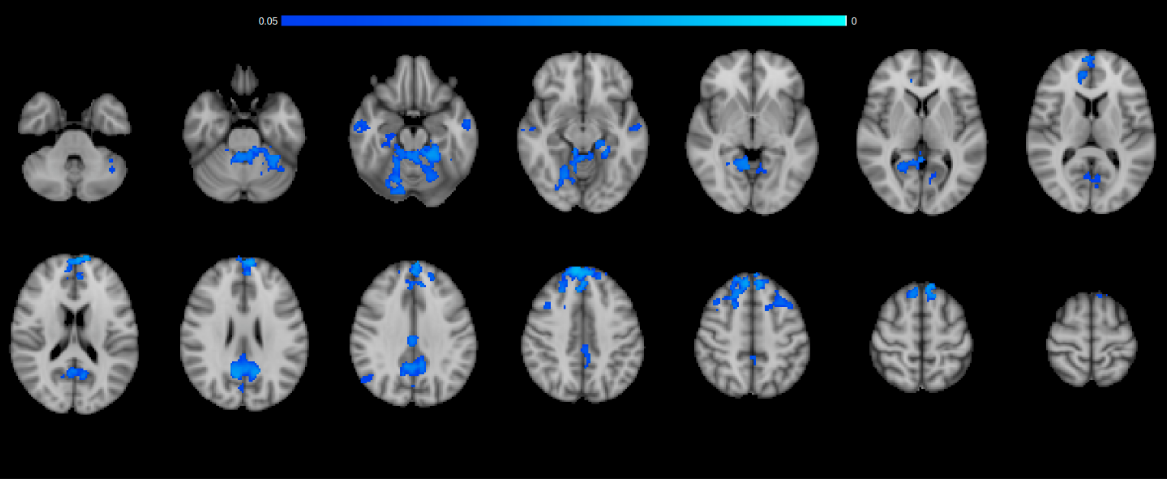
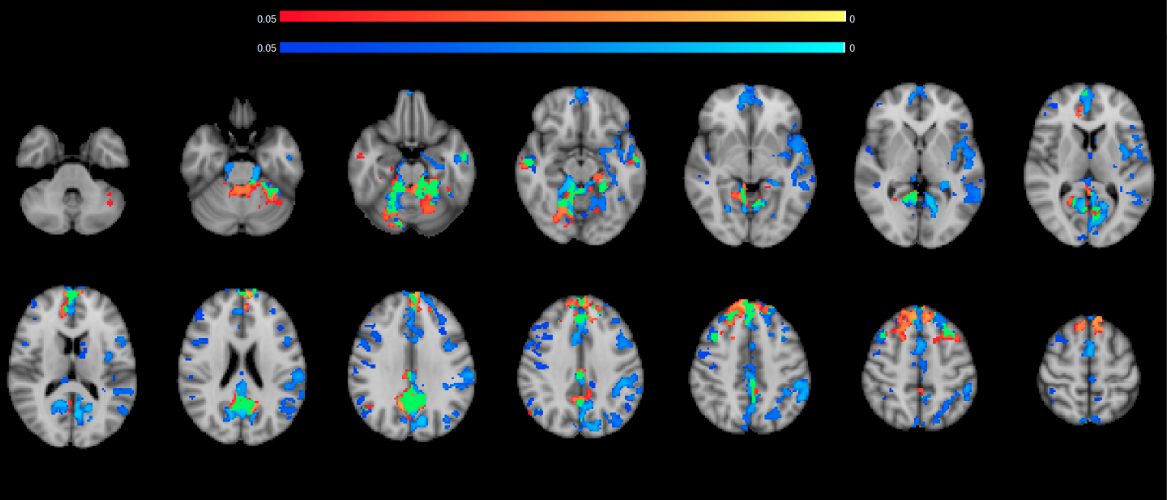
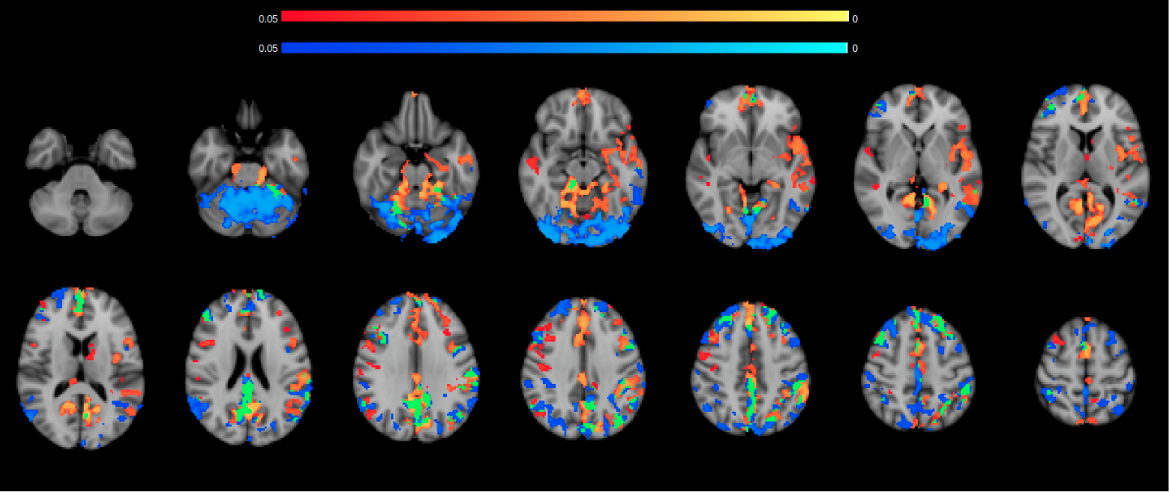
Higher pulse-wave velocity (PWV), as measured in the aorta, is associated with lower variance in the resting-state BOLD signal (Figure 1). This may be due to the deleterious effect of arterial stiffening on cerebrovascular reactivity. Higher PWV is also associated with lower BOLD-based resting-state functional connectivity (Figure 2). Regions showing lower connectivity are not the same as those showing lower BOLD variance with higher PWV (Figure 3). Moreover, regions showing PWV effects on BOLD signal fluctuations differ from those showing age effects (Figure 4). There was no detectable contribution from CBF signal variance and baseline quantitative CBF to the above findings. Lastly, there was no significant association between BOLD signal variance and systolic blood pressure.Discussion & Conclusions
The role of vascular stiffness as a major risk factor for age-related cognitive deficits has become well established 9–11. However, there has been very limited research into the relationship between vascular stiffness and imaging-based “functional” measures, particularly those obtained using rs-fMRI. In this study, in our healthy sample of young to middle-aged adults, we find that: (1) there is a significant negative association between PWV and rs-fMRI low-frequency BOLD fMRI fluctuation variance; (2) these associations are spatially distinct from the effect of age on BOLD-fluctuation variance (which are also negative); (3) PWV is negatively associated with resting-state functional connectivity; (4) all of these effects are most robustly observed in the medial-temporal, medial frontal and precuneus/posterior cingulate regions. Our findings echo previous findings of reduced BOLD task response 12 and reduced functional connectivity with higher arterial stiffness 13. These could be attributed to reduced vascular reactivity, and caution the interpretation of BOLD signal fluctuation.Acknowledgements
This research was funded by the Canadian Institutes for Health Research (CIHR) and by the Natural Sciences and Engineering Research Council of Canada (NSERC).References
1. Ances BM, Liang CL, Leontiev O, Perthen JE, Fleisher AS, Lansing AE, et al. Effects of aging on cerebral blood flow, oxygen metabolism, and blood oxygenation level dependent responses to visual stimulation. Hum Brain Mapp. 2009;30:1120–32.2.
2. Grady CL, Garrett DD. Understanding variability in the BOLD signal and why it matters for aging. Brain Imaging Behav. 2014 Jun;8(2):274–83.3.
3. Brier M, Thomas J, Wang L, Benzinger T, Morris J, Ances B. The effects of aging on whole-brain functional connectivity. Alzheimers Dement. 2013;9(4):P7.4.
4. Behzadi Y, Restom K, Liau J, Liu TT. A component based noise correction method (CompCor) for BOLD and perfusion based fMRI. Neuroimage. 2007;37(1):90–101.5.
5. Constable RT, Hara Y, Tokoglu F, Papademetris X. Intrinsic Connectivity Contrast: A Voxel Level Summary of Tissue Connectivity. Neuroimage. 2009;47:S186.6.
6. Martuzzi R, Ramani R, Qiu M, Shen X, Papademetris X, Todd Constable R. A whole-brain voxel based measure of intrinsic connectivity contrast reveals local changes in tissue connectivity with anesthetic without a priori assumptions on thresholds or regions of interest. Neuroimage. 2011;58(4):1044–50.7.
7. Shirzadi Z, Stefanovic B, Chappell MA, Ramirez J, Schwindt G, Masellis M, et al. Enhancement of automated blood flow estimates (ENABLE) from arterial spin-labeled MRI. J Magn Reson Imaging [Internet]. 2017 Jul 6; Available from: http://dx.doi.org/10.1002/jmri.258078.
8. Heiberg E, Sjögren J, Ugander M, Carlsson M, Engblom H, Arheden H. Design and validation of Segment--freely available software for cardiovascular image analysis. BMC Med Imaging. 2010 Jan 11;10:1.9.
9. Tsao CW, Seshadri S, Beiser AS, Westwood AJ, Decarli C, Au R, et al. Relations of arterial stiffness and endothelial function to brain aging in the community. Neurology. 2013 Sep 10;81(11):984–91.10.
10. Tarumi T, Gonzales MM, Fallow B, Nualnim N, Pyron M, Tanaka H, et al. Central artery stiffness, neuropsychological function, and cerebral perfusion in sedentary and endurance-trained middle-aged adults. J Hypertens. 2013 Dec;31(12):2400–9.11.
11. Scuteri AA, Brancati AMA, Gianni WW, Assisi AA, Volpe MM. Arterial stiffness is an independent risk factor for cognitive impairment in the elderly: a pilot study. J Hypertens. 2005;23:1211–6.12.
12. Steward KA, Pasha E, Goudarzi K, Elmenshawy A, Alkatan M, Villalpando A, et al. Midlife Arterial Stiffness and Brain Activation During Working Memory Task. TOHYPERJ. 2014 Jan 24;6(1):3–9.13.
13. Guevara E, Sadekova N, Girouard H, Lesage F. Optical imaging of resting-state functional connectivity in a novel arterial stiffness model. Biomed Opt Express. 2013 Oct 4;4(11):2332–46.
Figures