0331
Characteristic Normal Ageing Patterns of White Matter Tracts in 610 Cambridge Centre for Ageing and Neuroscience (Cam-CAN) Healthy Participants1Institute of Medical Device and Imaging, National Taiwan University College of Medicine, Taipei, Taiwan, 2AcroViz Technology, Inc., Taipei, Taiwan, 3Molecular Imaging Center, National Taiwan University, Taipei, Taiwan
Synopsis
Previous studies did not clearly characterize normal ageing patterns of white matter tracts across lifespan. Here, we performed tract-specific automatic analysis over the whole brain to measure the diffusion indices on 610 healthy participants recruited from Cam-CAN. We used quadratic or linear models to plot the curves of diffusion indices against age, and calculated the average values and slopes of the curves in 10 subsystems classified from 76 major tracts. Our study characterized different ageing patterns corresponding to different subsystems.
Introduction
Ageing is a major risk factor for common neurodegenerative disease, and so comprehensive assessment of the human brain structures across lifespan is important for understanding normal aging1. Several studies on brain aging suggest that diffusion tensor imaging (DTI) can help us advance our knowledge of the brain2. However, previous papers only studied a few major white matter tracts, and the problem of uneven age distribution of the population often occurred. For these reasons, the past findings have been inconsistent in characterizing the trajectory of age effects3. Here, we used whole-brain tract-specific automatic analysis of DTI to investigate the microstructural properties of 10 subsystems classified from 76 white matter tracts. We performed analysis on participants recruited from the Cambridge Centre for Ageing and Neuroscience (Cam-CAN) databank whose age distributed uniformly across lifespan.Methods
Participants:
649 healthy participants were recruited from Cam-CAN. After screening, usable data were obtained from 610 people: age range=18-88 years; mean=53.99 years; SD=18.34 years; female=309 and male=301.
MRI data acquisition:
The MRI data were acquired on a 3T MRI system (TIM Trio, Siemens, Erlangen) with a 32-channel phased array coil. For Cam-CAN protocol3, T1-weighted imaging utilized a 3D magnetization-prepared rapid gradient echo (MPRAGE) pulse sequence. The imaging parameters of MPRAGE were TR/TE/TI= 2250/2.99/900ms, flip angle=9°, FOV=256×240×192mm3, and spatial resolution=1×1×1mm3. DTI utilized a pulsed gradient twice-refocused spin-echo diffusion echo planar imaging sequence. Two-shell DTI acquisition scheme used 30 diffusion-encoding gradients directed to each shell; the b-values of the two shells were 1000 and 2000 s/mm2. Three images acquired at b-value=0 served as the baseline images. The imaging parameters of DTI were TR/TE=9100/104ms, FOV=192×192mm2, matrix size=96×96, and slice thickness=2mm.
Data analysis:
From DTI data, we reconstructed five diffusion indices, i.e. generalized fractional anisotropy (GFA), fractional anisotropy (FA), mean diffusivity (MD), axial diffusivity (AD), and radial diffusivity (RD). We used tract-based automatic analysis (TBAA) to obtain a 2D connectogram for each DTI dataset, which provided diffusion index profiles of 76 white matter tract bundles4. We also used TBAA to sample the tissue probability maps, and corrected the probability of partial volume effects of the cerebrospinal fluid (PVECSF). The quadratic or linear model was built to plot the curve patterns and calculate the average values across lifespan (AV) and slopes of the five diffusion indices and the probability of PVECSF. The curve patterns and resulting metrics were compared in 10 subsystems classified from the 76 white matter tracts (Table 1)(Figure 1).
Results
The limbic system (AFLimbic) and cortical-cortical (AFCortical) association fiber system had similar curve patterns in GFA and FA, but the former had higher AV and steeper slopes in MD, AD, RD, and the probability of PVECSF. For the projection fiber system, the corticospinal tract (PFCST) had the highest AV and flat slopes in GFA and FA accompanied with the lowest AV and flat slope in RD. There were slight differences in AV and slopes between the frontal-striatum (PFFS) and thalamic radiation (PFTR) projection fibers. Notably, a trend of the slopes from steep to flat was found in frontal (CFFrontal), parietal (CFParietal), occipital (CFOccipital), and temporal (CFTemporal) callosal fiber system in GFA and FA. As to the anterior and posterior commissures (CFCom), the unique positive slopes in GFA and FA were noted (Table 2)(Figure 2).Discussion
The decrease of GFA and FA, and increase of MD, AD, and RD are a reflection of the microstructural integrity changes in loss of myelin, axonal fibers, and increase in extracellular space2. Most of white matter tract bundles had the similar curve patterns that the integrity declined across lifespan. In the PFCST, however, GFA and FA had relatively higher values and flatter slopes, indicating slower degradation. In the AFLimbic, MD, AD, RD and PVECSF increased in tandem. The finding implies strong effects of PVECSF on AFLimbic, consistent with previous studies5. Moreover, our results were the first to uncover the process of sequential decline in CFFrontal, CFParietal, CFOccipital, and CFTemporal, which was opposite to the posterior-to-anterior shift in aging hypothesis in functional neuroimaging studies6. In addition, we found the unique positive slopes of GFA and FA in CFCom, suggesting maintained integrity of the anterior and posterior commissures. In summary, GFA and FA were suitable to represent different types of curve patterns. A limitation of the study was the imperfect correction of PVECSF, but the GFA and FA were almost unaffected and stable, implying that our observations were still valid.Conclusion
Our study revealed the characteristic normal ageing patterns of microstructural properties in 10 subsystems. The information may be helpful in identifying accelerated ageing in neurodegenerative disease.Acknowledgements
All data were provided by Cam-CAN, subject to a data transfer agreement. We thank the Cam-CAN team (http://www.cam-can.org/), which was crucial in recruiting participants, developing the protocol, and overseeing data management.References
- Cox SR, et al. Ageing and brain white matter structure in 3,513 UK Biobank participants. Nat Commun. 2016;7:13629.
- Moseley M. Diffusion tensor imaging and aging - a review. NMR Biomed. 2002;15(7-8): 553-560.
- Shafto MA, et al. The Cambridge Centre for Ageing and Neuroscience (Cam-CAN) study protocol: a cross-sectional, lifespan, multidisciplinary examination of healthy cognitive ageing. BMC Neurol. 2014;14:204.
- Chen, Yu-Jen, et al. Automatic whole brain tract-based analysis using predefined tracts in a diffusion spectrum imaging template and an accurate registration strategy. Human brain mapp. 2015;36(9):3441-3458.
- Luis Concha L, et al. Diffusion tensor tractography of the Limbic System. AJNR Am J Neuroradiol. 2005;26(9):2267-2274.
- Davis SW, et al. Que PASA? The posterior-anterior shift in aging. Cereb Cortex. 2008;18(5):1201-1209.
Figures
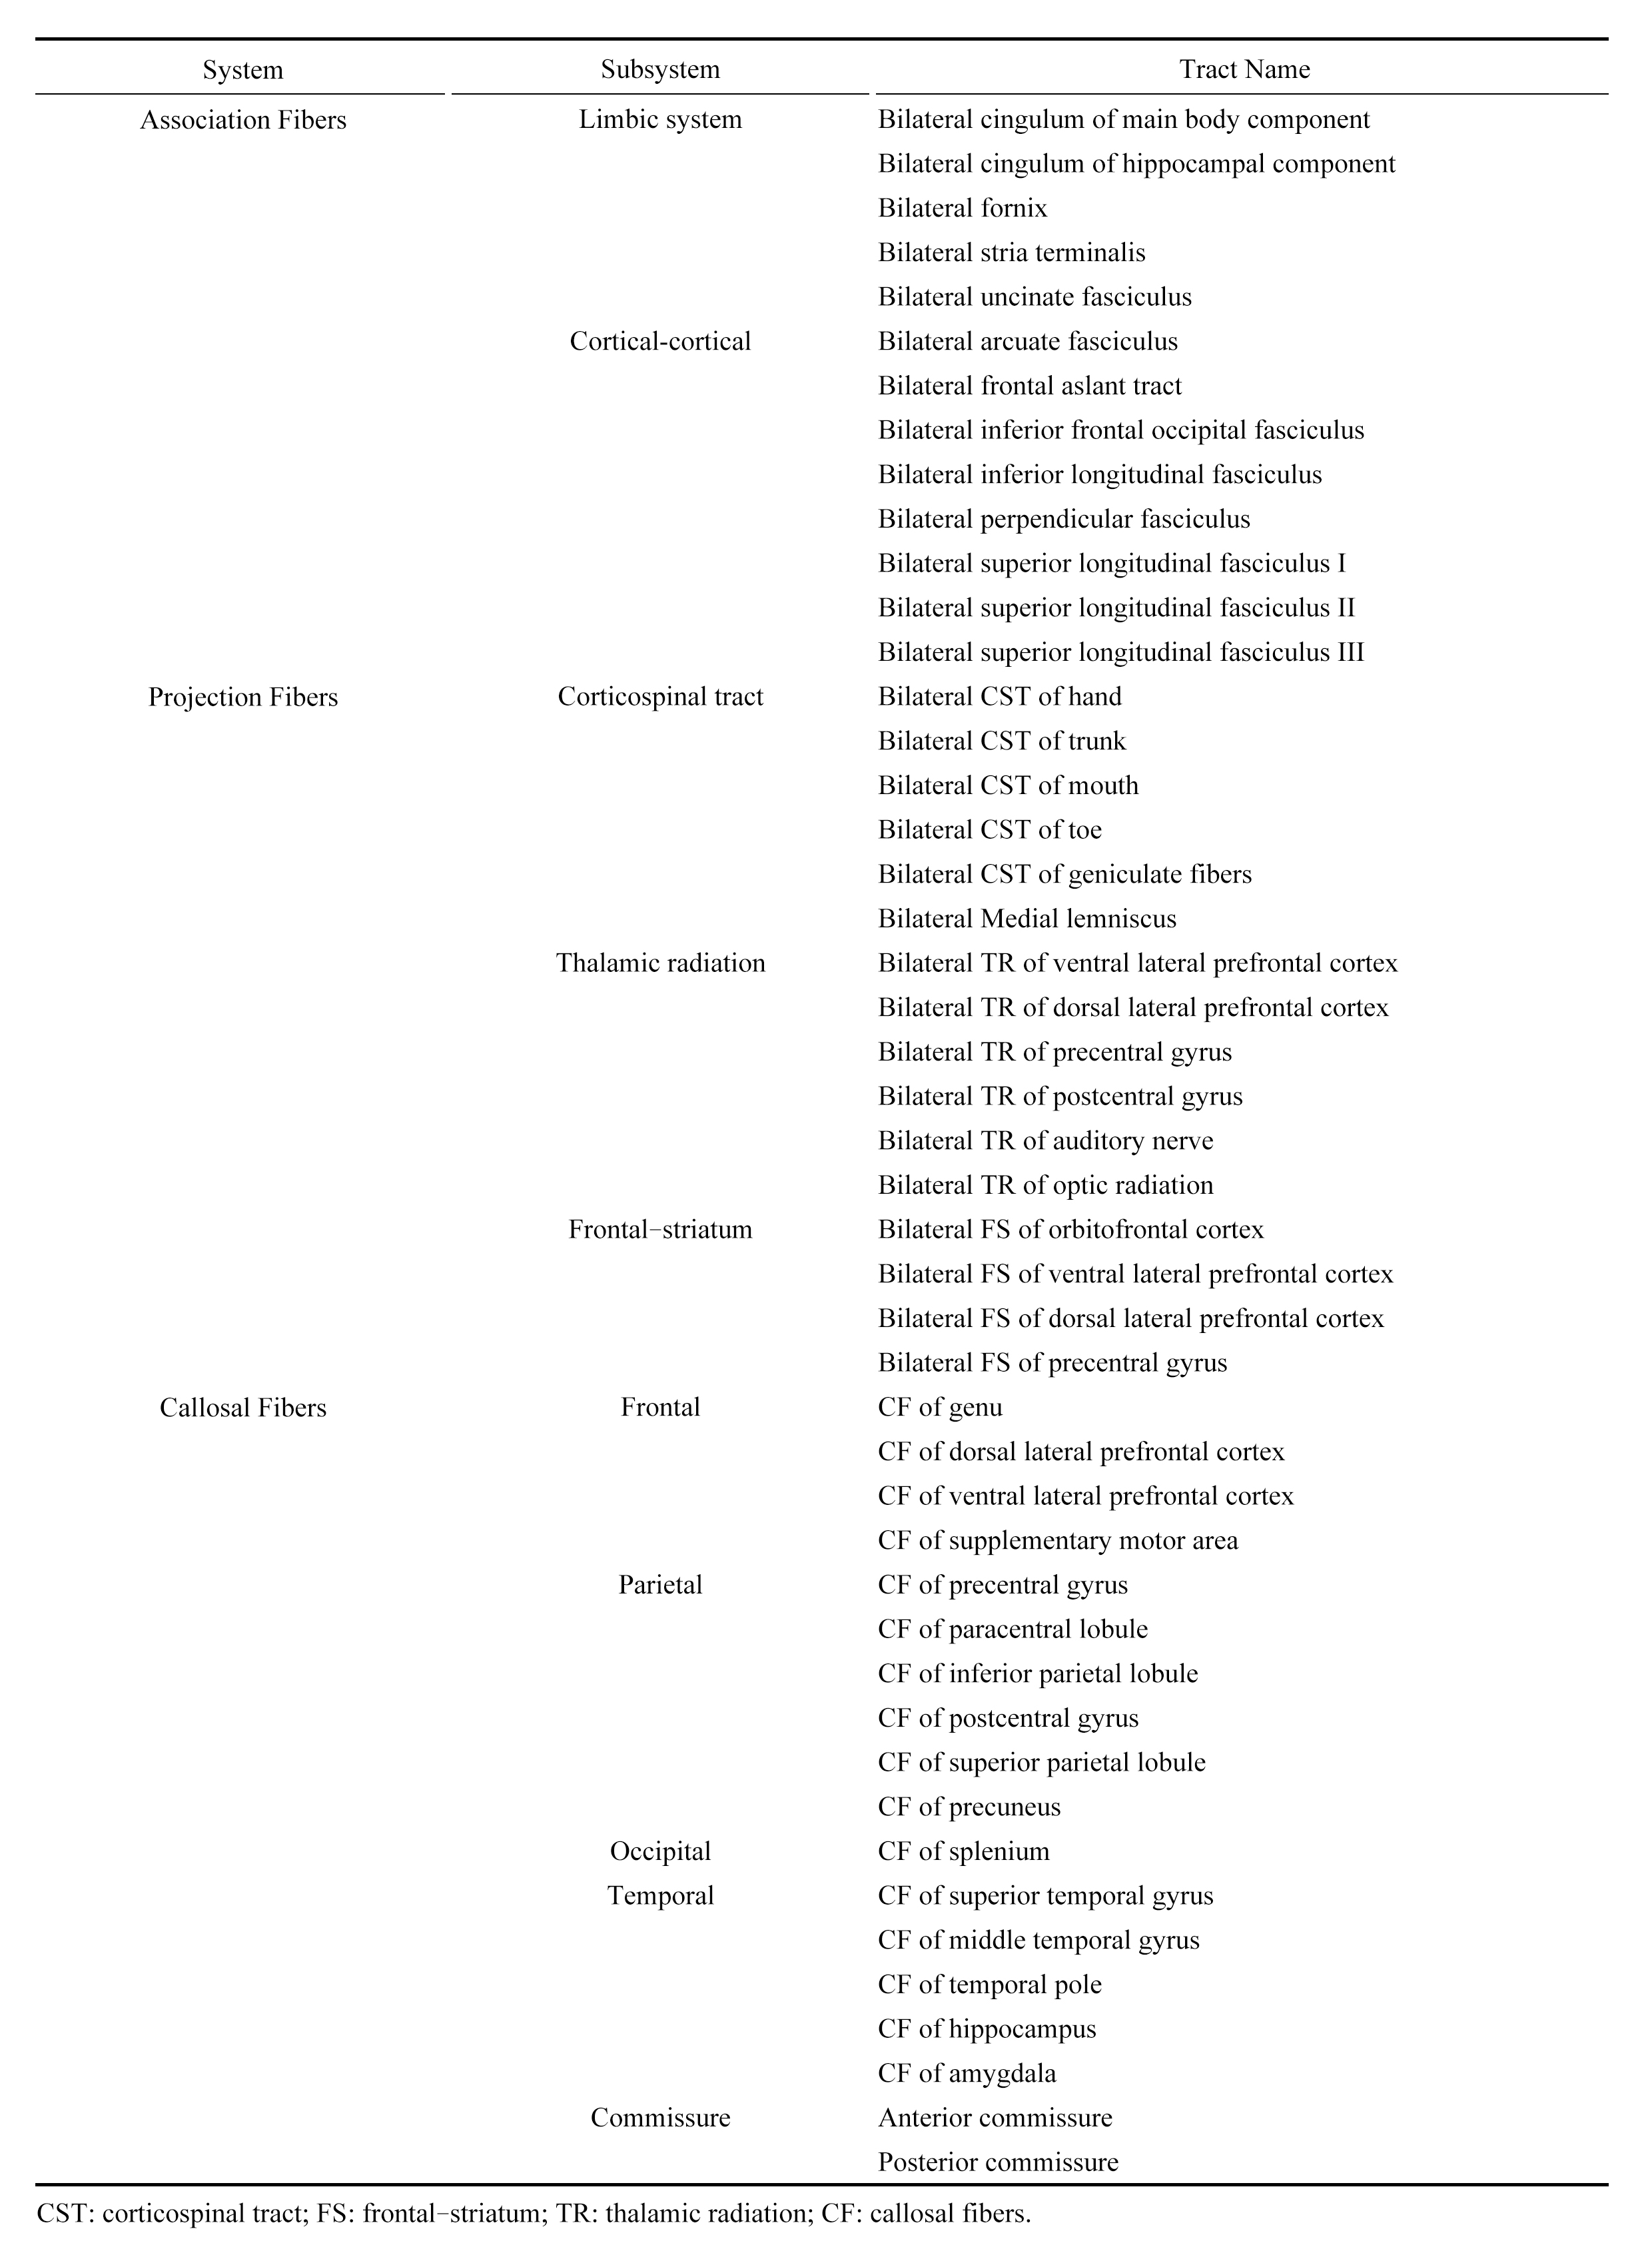
Table1.
List of 10 subsystems classified from 76 major white matter tracts.
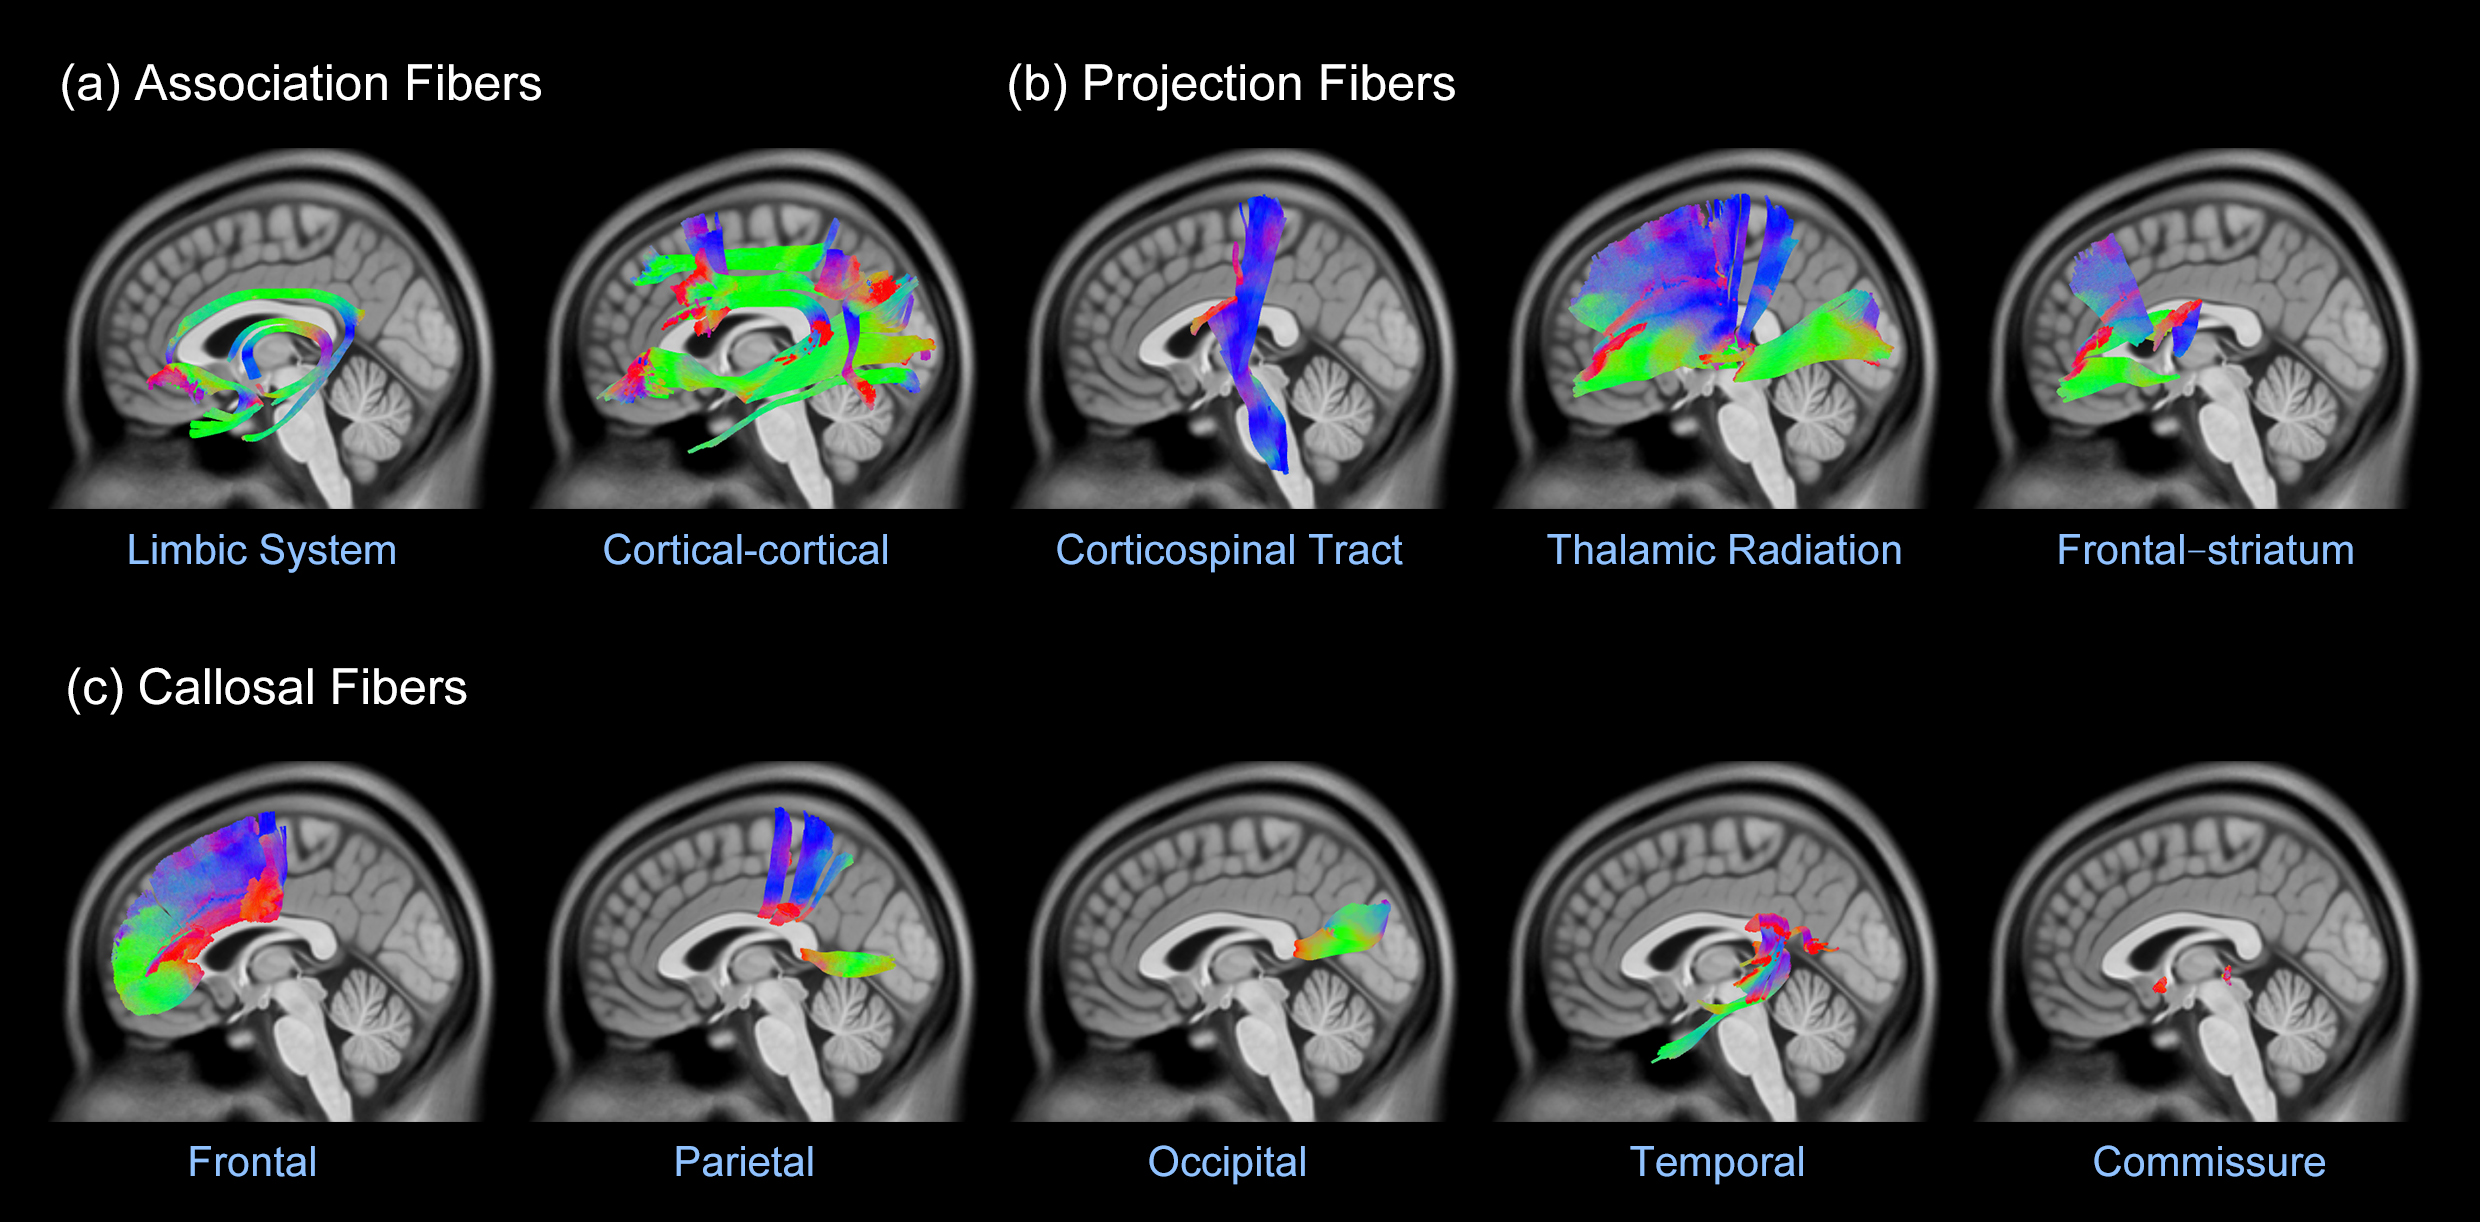
Figure 1.
The 76 major white matter tracts were categorized into 10 subsystems according to anatomical definitions.
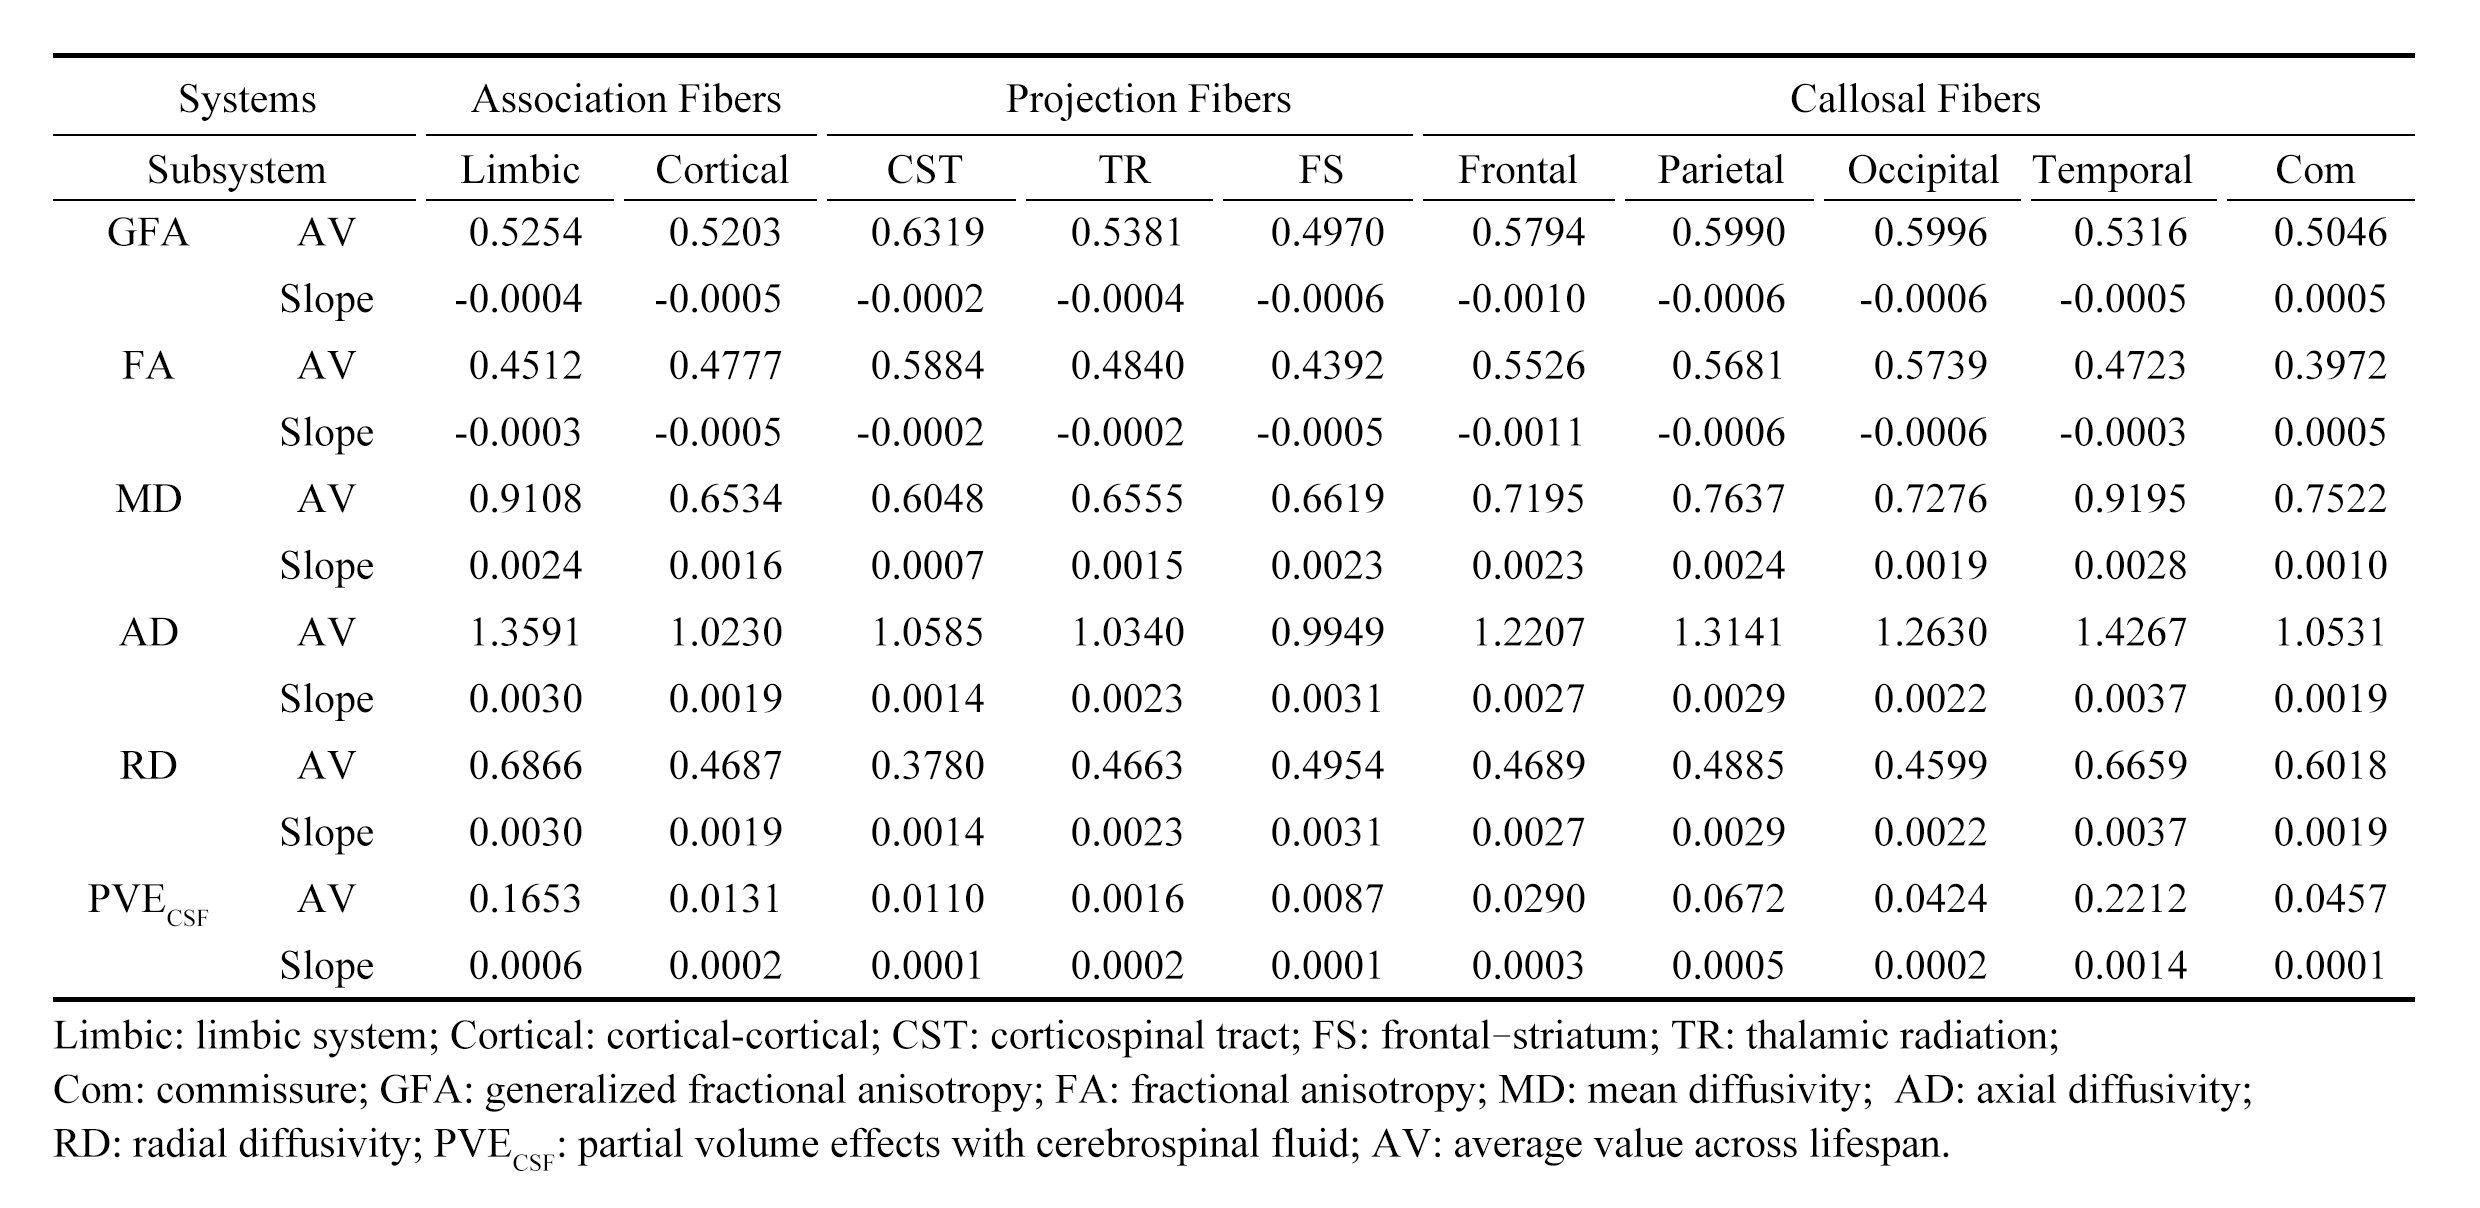
Table2.
The average value across lifespan (AV) and slope of diffusion indices and probability of partial volume effects with cerebrospinal fluid in 10 subsystems.
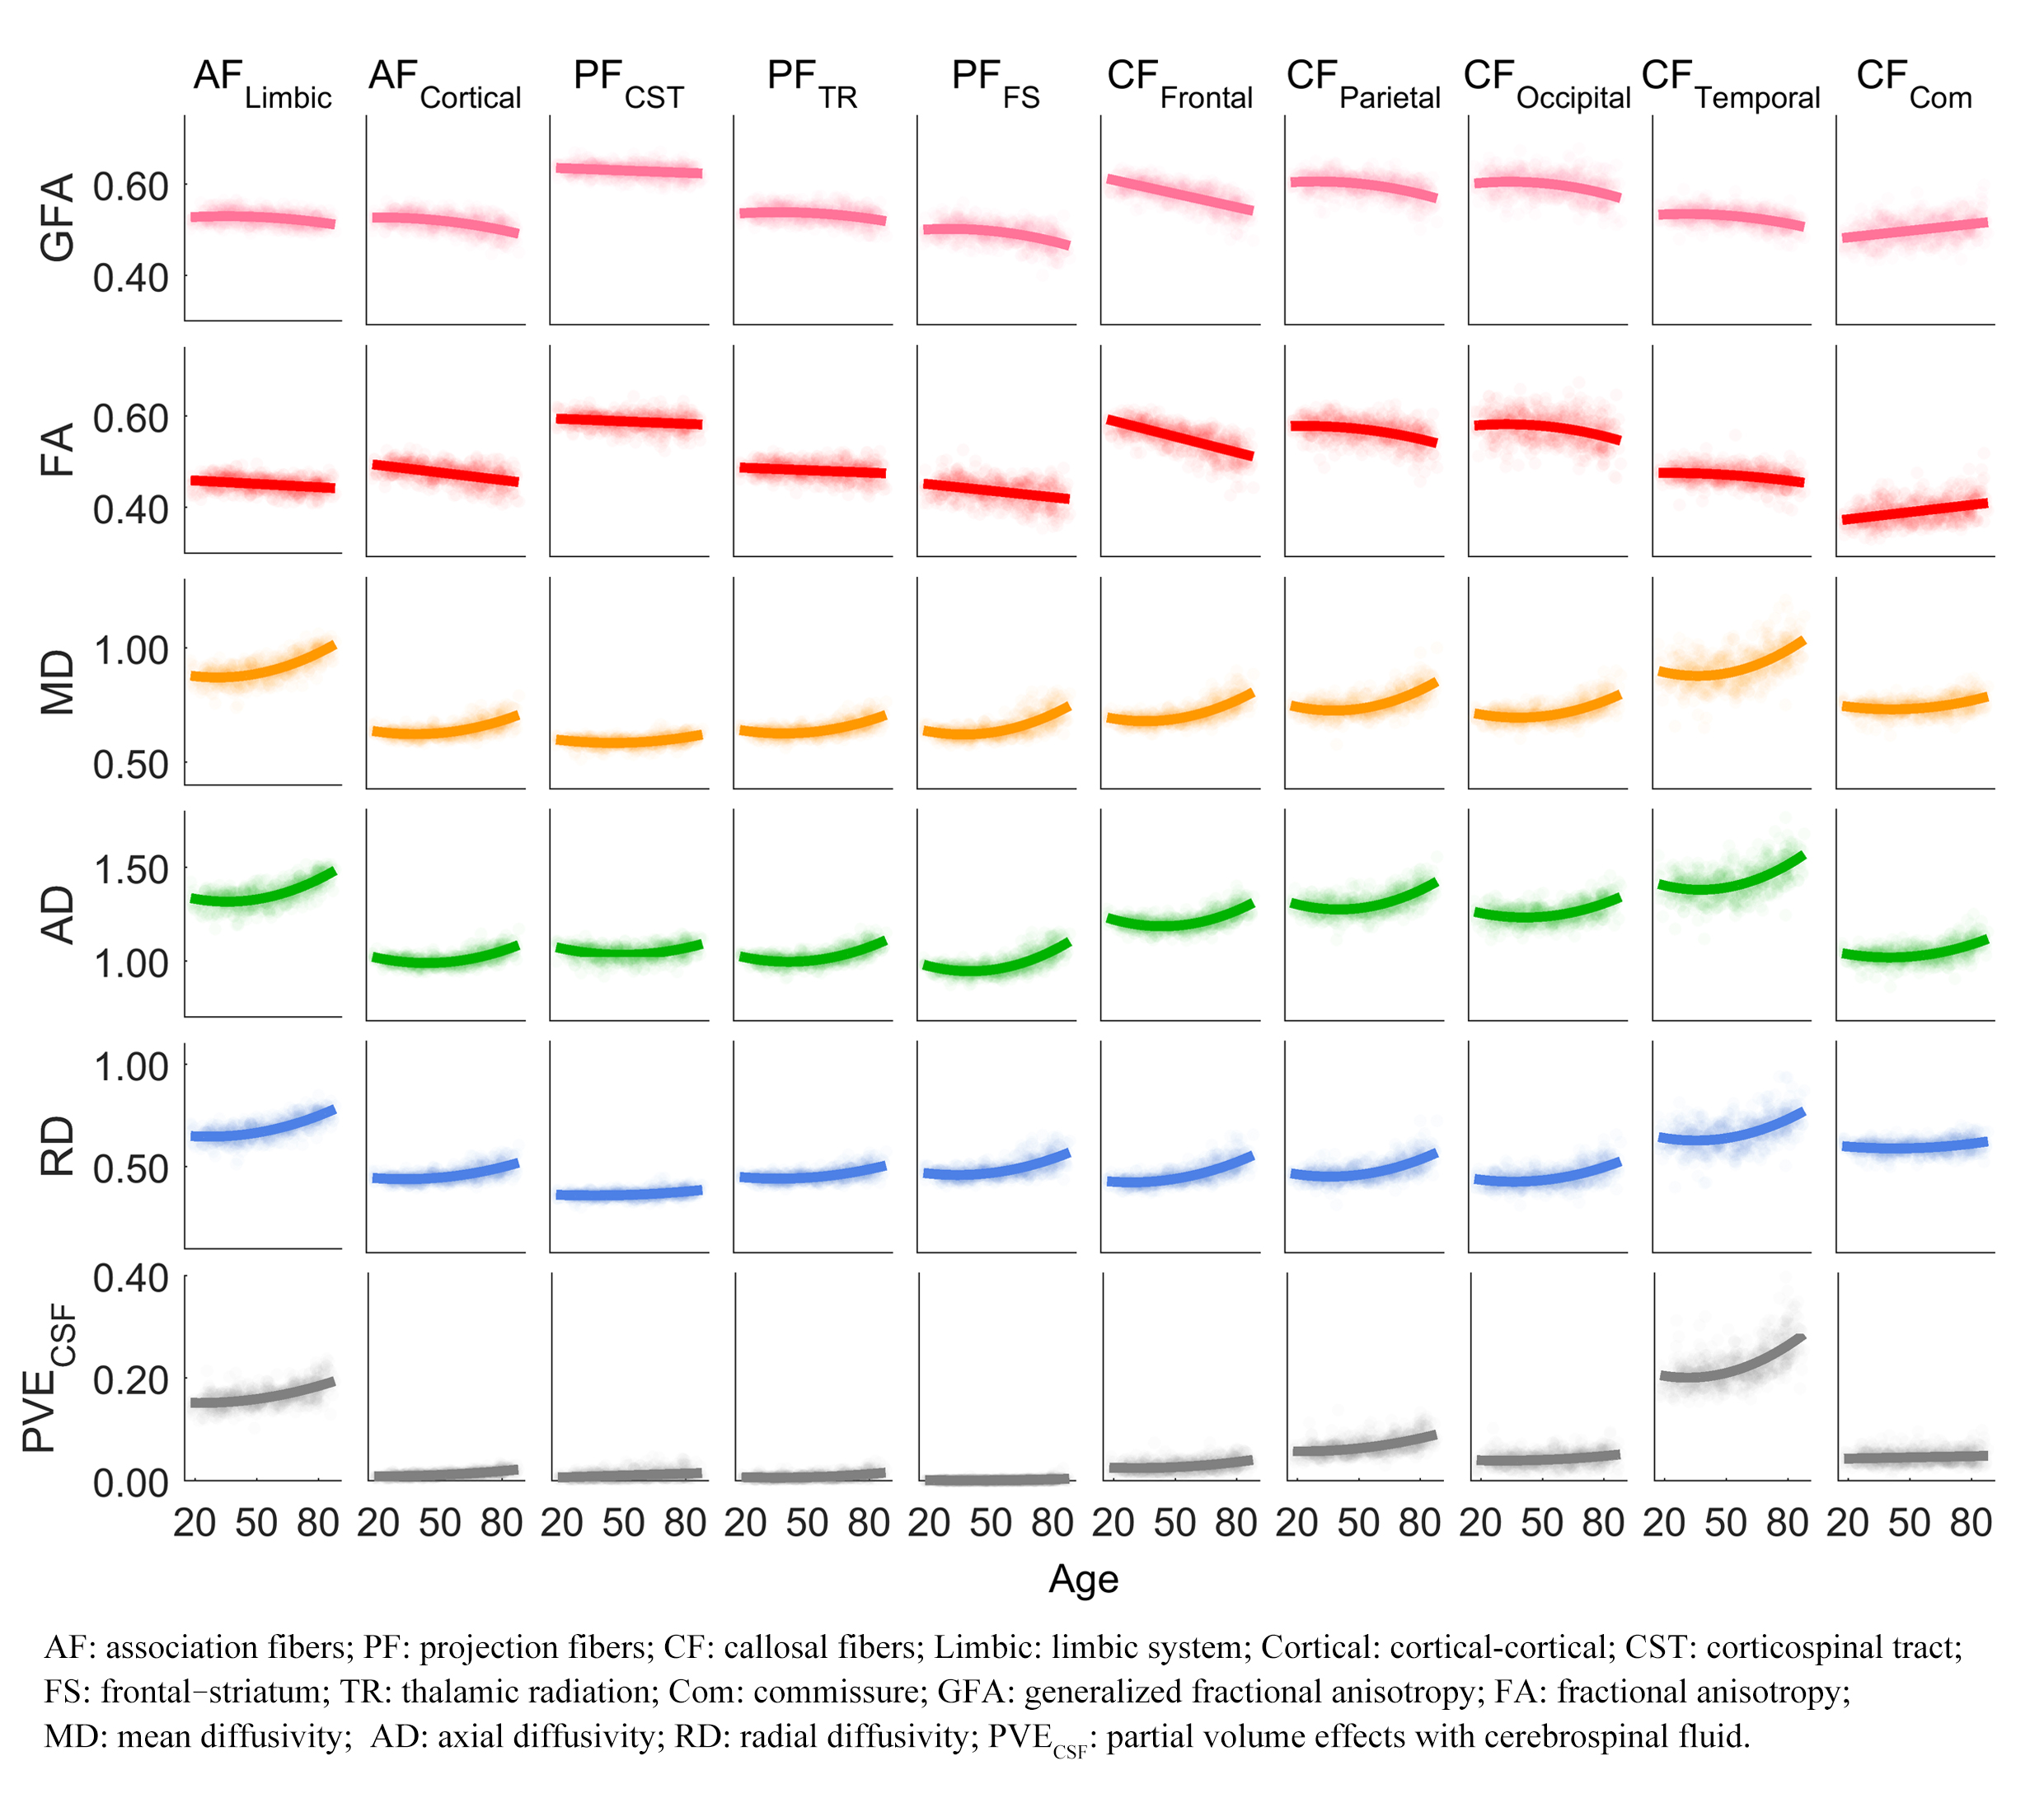
Figure 2.
The curve patterns of diffusion indices and probability of partial volume effects with cerebrospinal fluid in 10 subsystems.