0329
Differential developmental trajectory of magnetic susceptibility in healthy rhesus macaque brain1Kungming istitute of zoology, Chinese Academy of Sciences, Kunming, China, 2Shanghai United Imaging Healthcare, Shanghai, China, 3UIH American Inc., Houston, Armenia, 4Shanghai Research Center for Brain Science and Brain-Inspired Intelligence, Shanghai, China
Synopsis
Myelination and iron deposition in the deep brain nuclei evolve both spatially and temporally. In this study, we quantitatively evaluated the change of iron content along with age in primate brains using quantitative susceptibility mapping (QSM). All the brain images were acquired from 23 healthy rhesus macaque monkeys (23+/-7.85 y, ranged 2 ~ 29 y) with a 3D five-echo GRE sequence. After analyzing susceptibility maps and R2* maps of the ROIs (including putamen, globus pallidus, caudate nucleus, thalamus, dentate nucleus, red nucleus, substantia nigra), susceptibility in most of the ROIs correlated with the growth of age significantly.
Synopsis
Myelination and iron deposition in the deep brain nuclei evolve both spatially and temporally. In this study, we quantitatively evaluated the change of iron content along with age in primate brains using quantitative susceptibility mapping (QSM). All the brain images were acquired from 23 healthy rhesus macaque monkeys (23+/-7.85 STD y/o, ranged 2 ~ 29 y/o) with a 3D five-echo GRE sequence. After analyzing susceptibility maps and R2* maps of the ROIs (including putamen, globus pallidus, caudate nucleus, thalamus, dentate nucleus, red nucleus, substantia nigra), susceptibility in most of the ROIs correlated with the growth of age significantly.introduction
Methods
Animal model: 23 healthy monkeys (macaca mulatta: 23+/-7.85y, ranged 2~29y,M/F:18/6) were used in this study. All animal experimental procedures in this study were approved by the Institutional Animal Care and Use Committee (IACUC) of Kunming Institute of Zoology Chinese Academy of Sciences and performed according to the local laboratory guide of animal care.
Data acquisition: All MRI experiments were performed on a UIH uMR770 3T clinical scanner (Shanghai United Imaging Healthcare, Shanghai, China). The brain images were acquired from all subjects with a 3D five-echo GRE sequence. Other parameters are as follows: FOV=100×80 mm2, in-plane resolution =0.694×0.694 mm2, 2x parallel imaging acceleration, TR=39ms, TE1=4.8ms, echo spacing=6.7ms, FA=150.
QSM analysis: On the base of a preconditioned conjugate gradient method2, we propose adding an additional regularization term for dynamic streaking artifact estimation and removal. During each iteration, an intermediate QSM solution χiter is obtained and used as input for subsequent iteration. With χiter, the corresponding local field map, Φiter, can be generated using the forward dipole function D, i.e.ϕiter=F-1{D∙F{χiter}}.Thus the regularization term describing the streaking artifacts can be formulated as ‖F-1D'FΔΦ‖2^2, where D’ is a partial version of the dipole kernel D by thresholding, and ΔΦ is the difference between Φiter and the original local field map ϕ. The complete regularization QSM solvers thus were: [argmin]χ ‖F-1DFχ-Φ‖2^2+α‖P∇χ‖1+‖F-1D'FΔΦ‖2^2 Where F and F-1 are Fourier transform operators, P is an a priori weighting mask, and ∇χ is the local difference map of the susceptibility distribution.
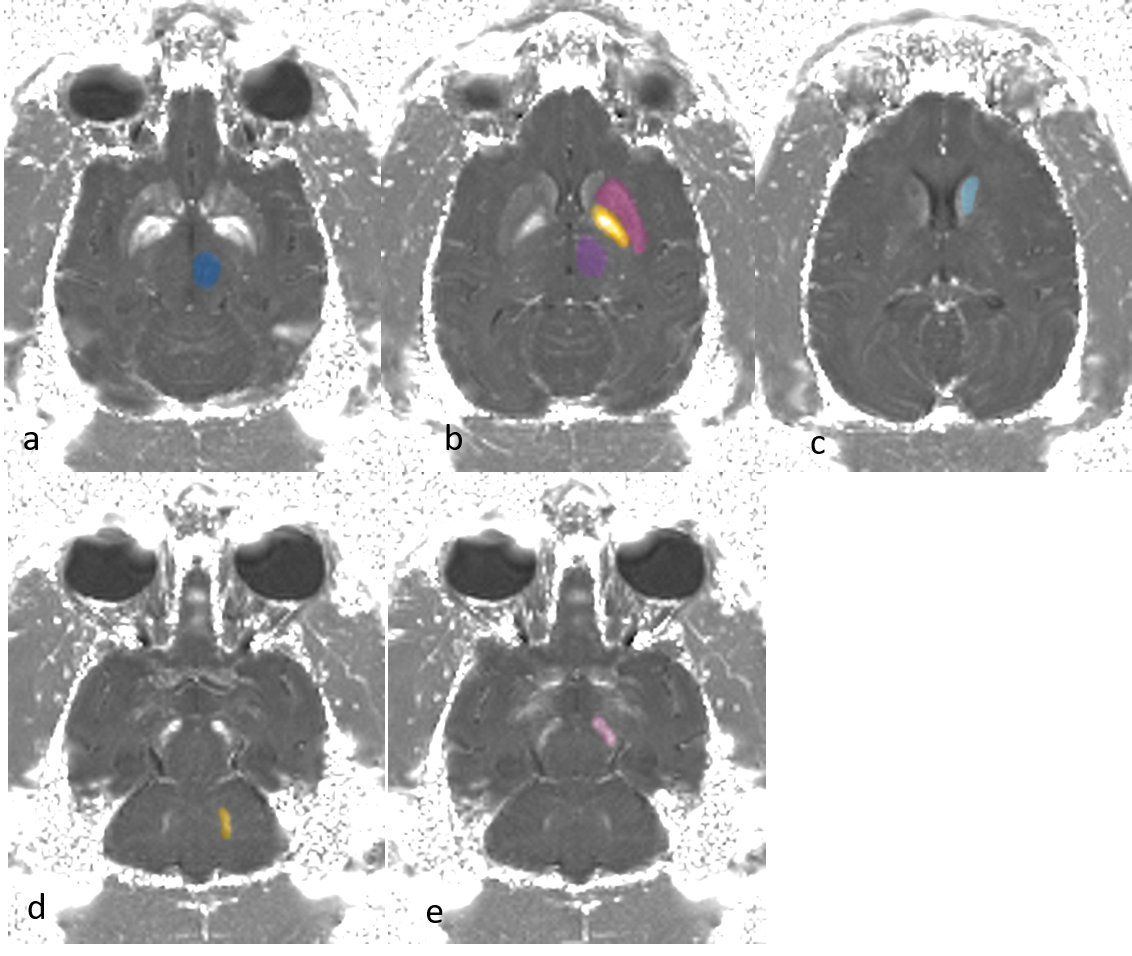
ROI selection: Brain parenchyma regions of interest (ROI) were drawn on final susceptibility using ImageJ, who was blind to subject information. Specifically, the ROIs for iron-rich nuclei were selected with joint reference to corresponding R2* maps, excluding subcortical white-matter fiber bundles. Fig.1 shows the representative images such as encompassing putamen (Put), globus pallidus (GP), caudate nucleus (Cau), thalamus (Thal), dentate nucleus (DN), red nucleus (RN), substantia nigra (SN) (illustrated in Fig. 1a ~ Fig. 1e).
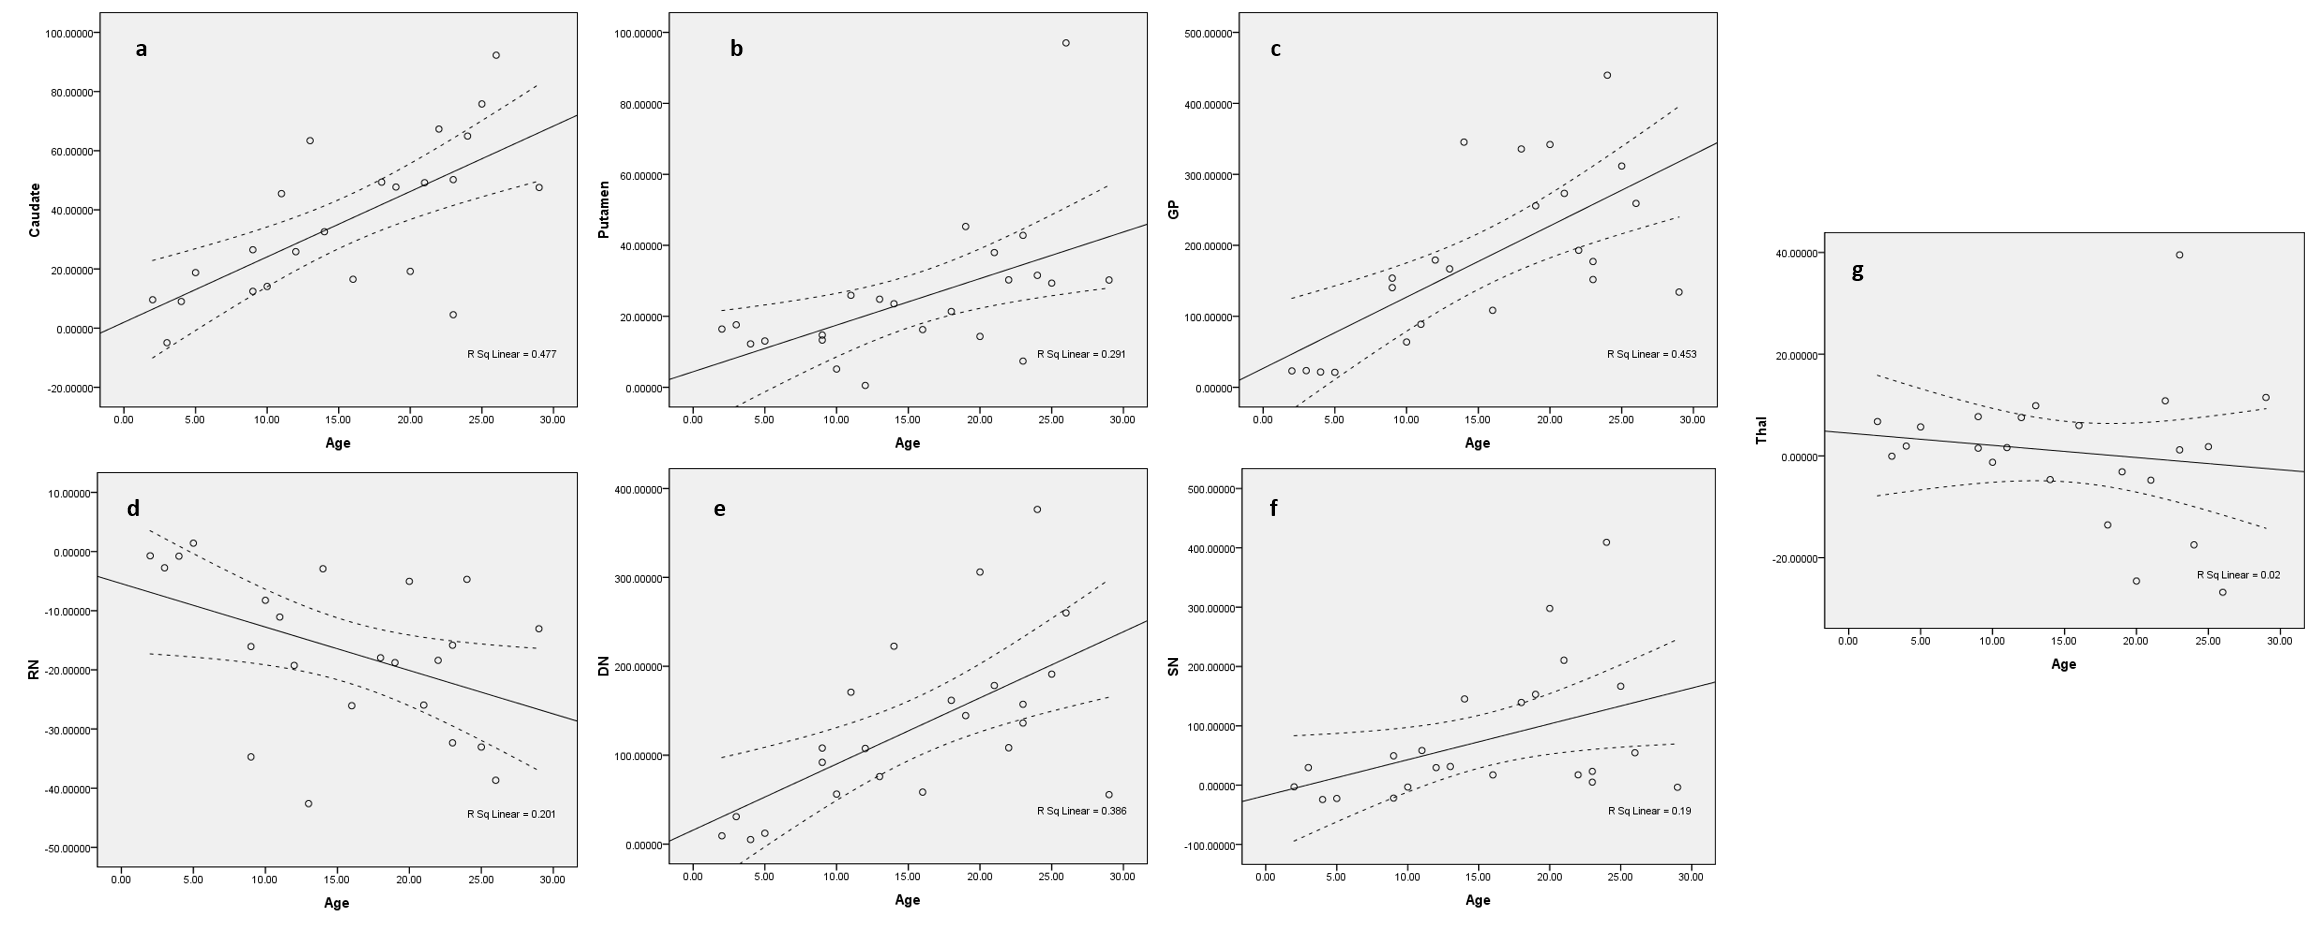
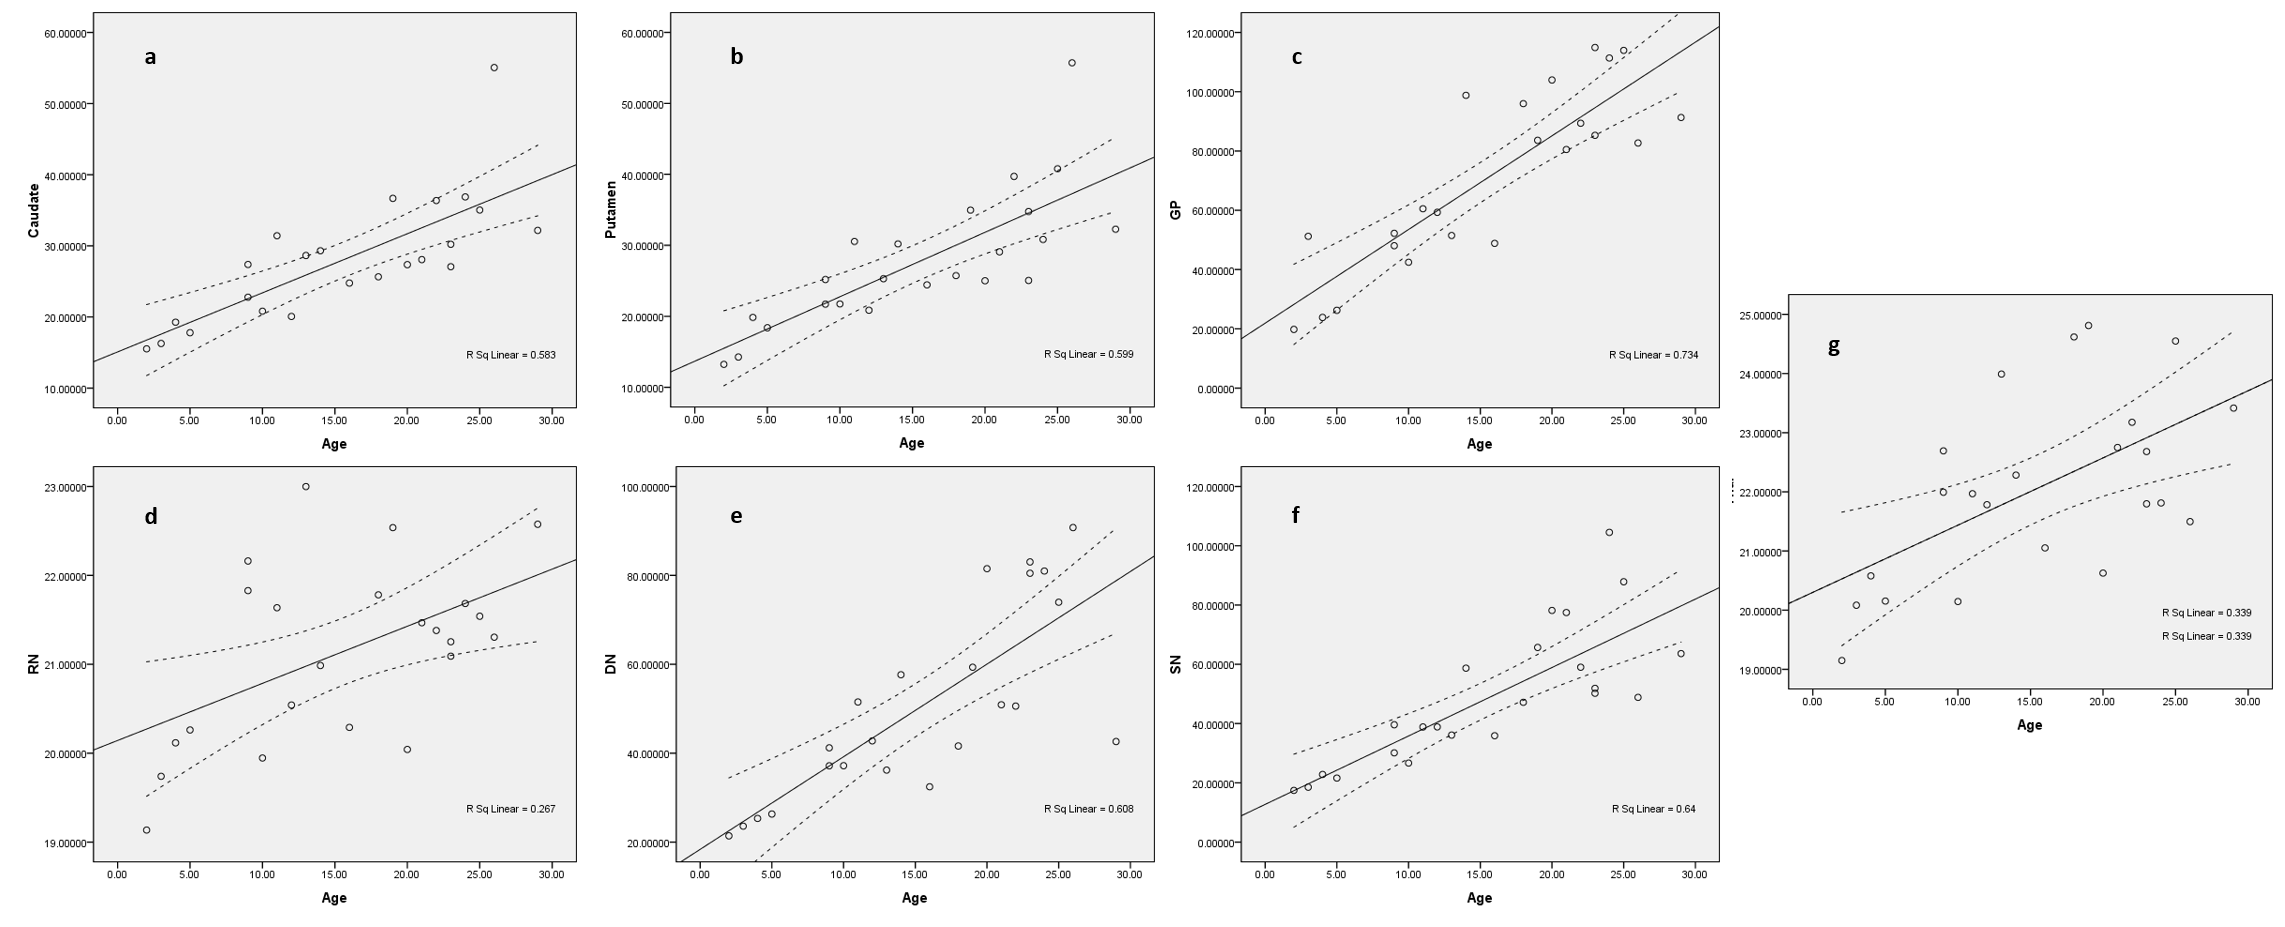
Statistical analysis: Although a previous study3 found that the accumulation of iron followed an exponential growth pattern in human brain, there is no prior knowledge about primates brains. In this study, Pearson correlation coefficients were calculated to assess the correlation between χ/R2* and age. Furthermore, susceptibility values of these nuclei were fitted with the linear model (shown in Fig. 3 & 4). All analysis were conducted in SPSS (v.16.0, Chicago, IL, USA) and reported significance with 95% confidence intervals.
Results
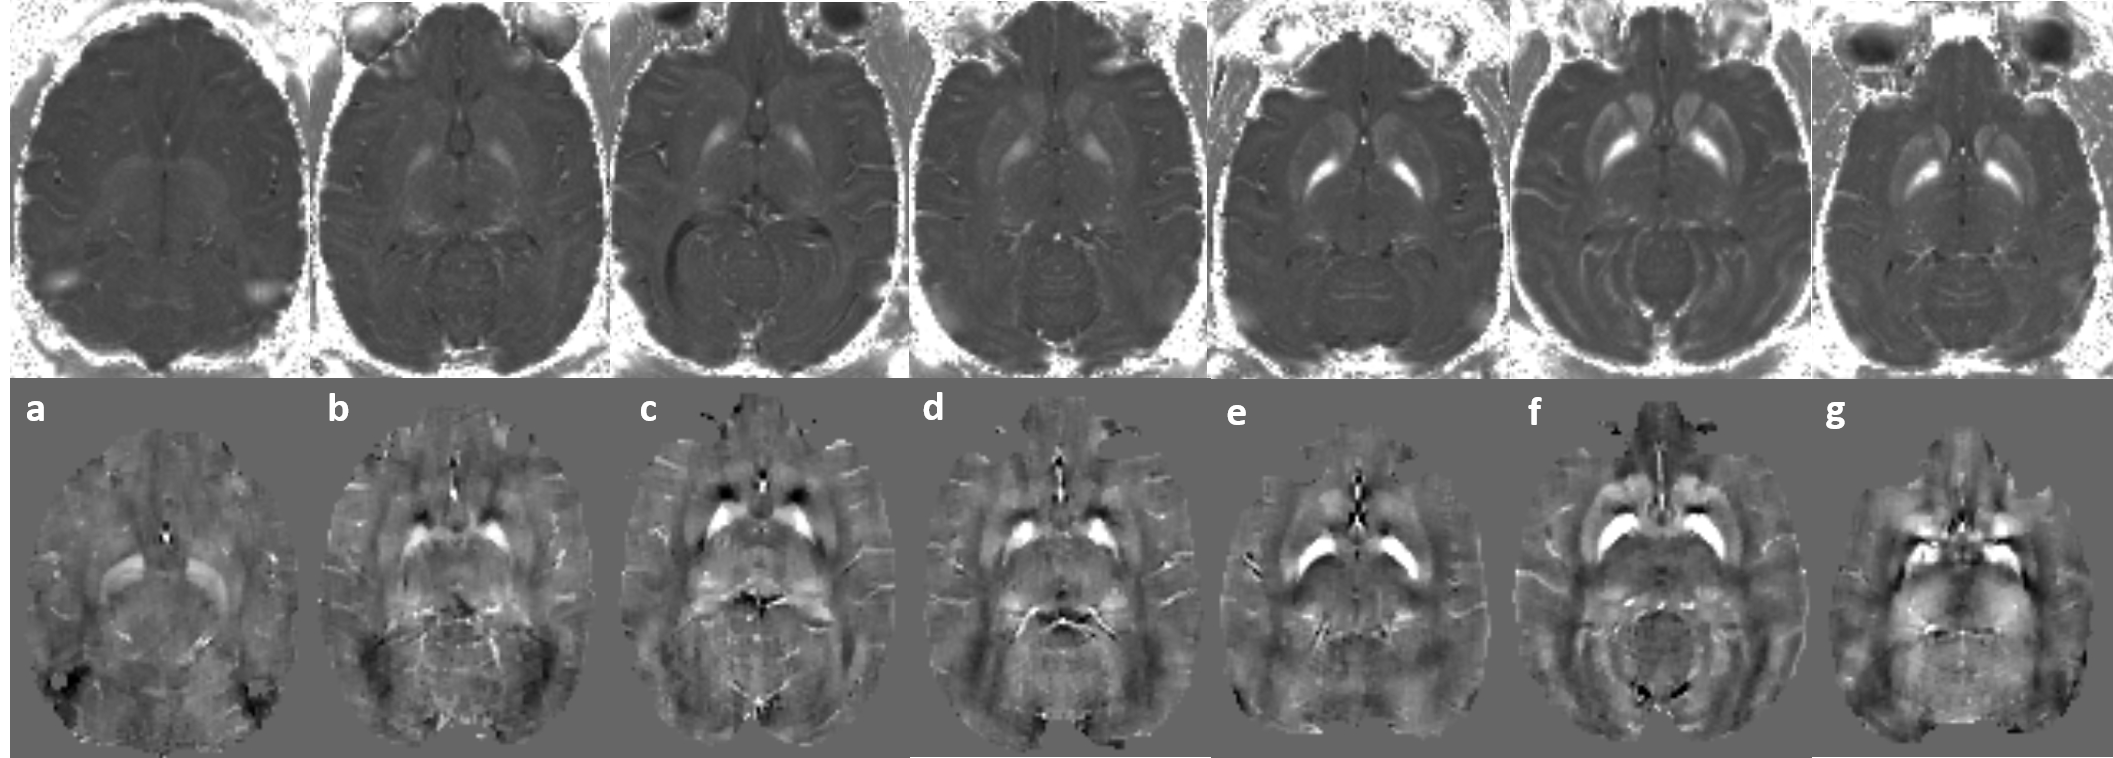
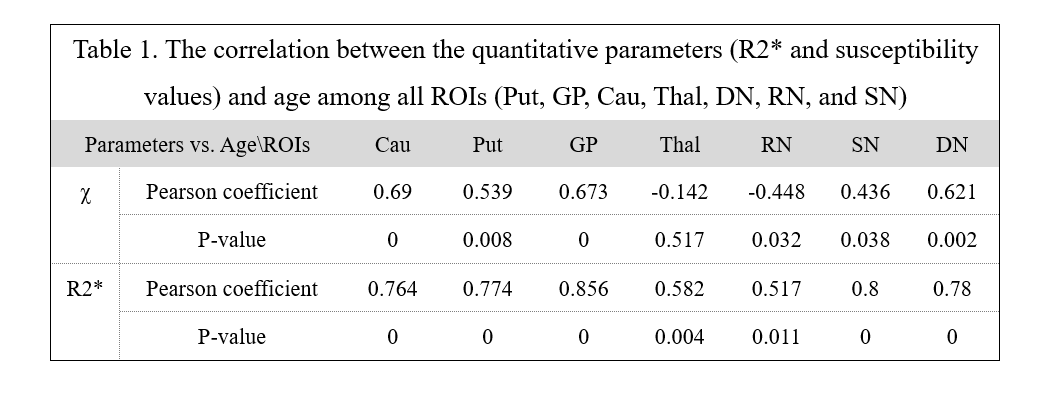
Fig.2 displays the representative contrasts derived from R2* and susceptibility at different ages. The general susceptibility changes from χ and R2* maps in several deep brain nuclei regions (Put, GP, Cau, Thal, Pul, DN, RN and SN) were showed in Fig.3 a~e and Fig.4a~e, respectively. As shown in Table.1, the correlation of χ,R2* and age in different ROIs were: Put (P= 0.539 and 0.774, respectively), GP (P= 0.673 and 0.856), Cau (P= 0.69 and 0.764), Thal (P= -0.142 and 0.582), DN (P= 0.621 and 0.78), RN (P= -0.448 and 0.517) and SN (P= 0.436 and 0.8), respectively.Discussion
For all the deep brain nuclei of the rhesus macaque brains, the results confirmed that there are statistically significant positive correlations between age and R2* values. Meanwhile, for all nuclei, except Thal and RN, the changes of χ values over the lifespan display a monotonic increase that are consistent with R2* result.Conclusion
This study assessed the correlation between iron content and age in healthy rhesus macaque brains using QSM method, providing a pilot information on normality for advanced animal disease models. Meanwhile, our results could serve as the control basis for further Clinical studies by using QSM for iron content quantification.Acknowledgements
No acknowledgement found.References
1. Li W, Wu B, Batrachenko A, et al. Differential developmental trajectories of magnetic susceptibility in human brain gray and white matter over the lifespan. Human Brain Mapping 2014;35(6):2698-2713.
2.Bilgic B, Fan AP, Polimeni JR, et al. Fast quantitative susceptibility mapping with L1-regularization and automatic parameter selection. Magnetic Resonance in Medicine Official Journal of the Society of Magnetic Resonance in Medicine 2014;72(5):1444-1459.
3.Hallgren B, Sourander P. THE EFFECT OF AGE ON THE NON‐HAEMIN IRON IN THE HUMAN BRAIN. Journal of Neurochemistry 2010;3(1):41-51.
Figures