0328
Age-related whole-brain structural changes in relation to cardiovascular risks1Department of Radiology, Beijing Hospital, National Center of Gerontology, Beijing, China, 2ImageTech Laboratory, Simon Fraser University, Surrey, BC, Canada, 3Department of Diagnostic Imaging, Tianjin Medical University General Hospital, Tianjin, China, 4Health Sciences and Innovation, Surrey Memorial Hospital, Fraser Health Authority, Surrey, BC, Canada
Synopsis
We investigated the relationship between structural brain health with age and cardiovascular risks across the adult life course. A score of the Brain Atrophy and Lesion Index (BALI), which assesses and integrates multiple changes commonly seen on MRI in the aging brain, was generated for each subject from evaluation of T2-weighted MRI. Our data showed that the accumulation of MRI detectable deficits in the brain became evident even in younger adults. Cardiovascular risks strongly affected the whole-brain structural health, in addition to the effect of age.
Introduction
Age-related structural brain changes are found common on MRI. Some changes (e.g., atrophy and lacunes) are known to increase the risk for clinical consequences, whereas others, typically of a smaller scale (e.g., microbleeds, microinfarcts, and trace of white matter hyperintensities) receive less attention. Such MRI detectable changes with even small effects can add up to have major impacts on brain function. The Brain Atrophy and Lesion Index (BALI) has been developed to summarize several common structural changes in the brain. The BALI has been validated in multiple independent datasets on subjects aged 55+ years, who were either with cognitively normal aging or mild cognitive decline and dementia. By late adulthood, people with minimum deficits that BALI counts, though rare, are associated with the best age-adjusted cognitive function. Multiple structural brain deficits have been linked to a history of cerebrovascular disease and biomarker. Given that deficits accumulate with age, we hypothesized that age-related common brain structural changes are likely to be detectable at younger ages and are associated with cardiovascular risks. Despite extensive evaluation of age-related brain structural changes, this proposition has not been evaluated using a summary quantitative score. In this study, we investigated MRI detectable age-related changes in the whole brain using BALI and determined the relationships between BALI and the cardiovascular risks in adults over a wide age range.Methods
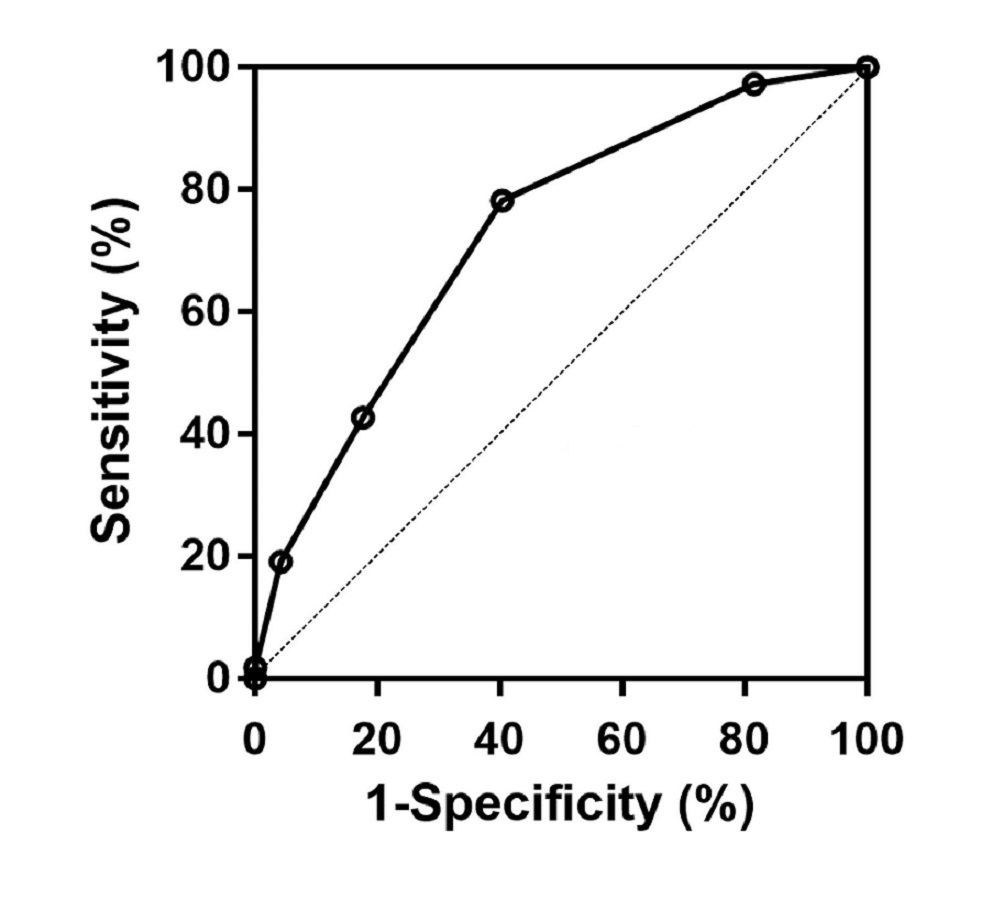
We accessed the data from a general health evaluation of 239 subjects (72% men; 25-80 years of age), whose annual health assessment included a routine anatomical MRI examination. A BALI score was generated for each subject from evaluation of T2-weighted MRI. Brain changes were included in seven categories: gray matter lesions and subcortical dilated perivascular spaces, periventricular and white matter lesions, lesions in the basal ganglia and surrounding areas, lesions in the infratentorial compartment, global atrophy, and other findings. Differences in the BALI total score and categorical subscores were examined for age and the level of cardiovascular risk factors (CVRF). Multivariable linear regression was used to evaluate the relationship between continuous variables, and Logistic regression was to estimate odds ratios. Receiver operating characteristic (ROC) analysis was used to test the accumulation of the CVRF in classifying people using the median BALI score.Results
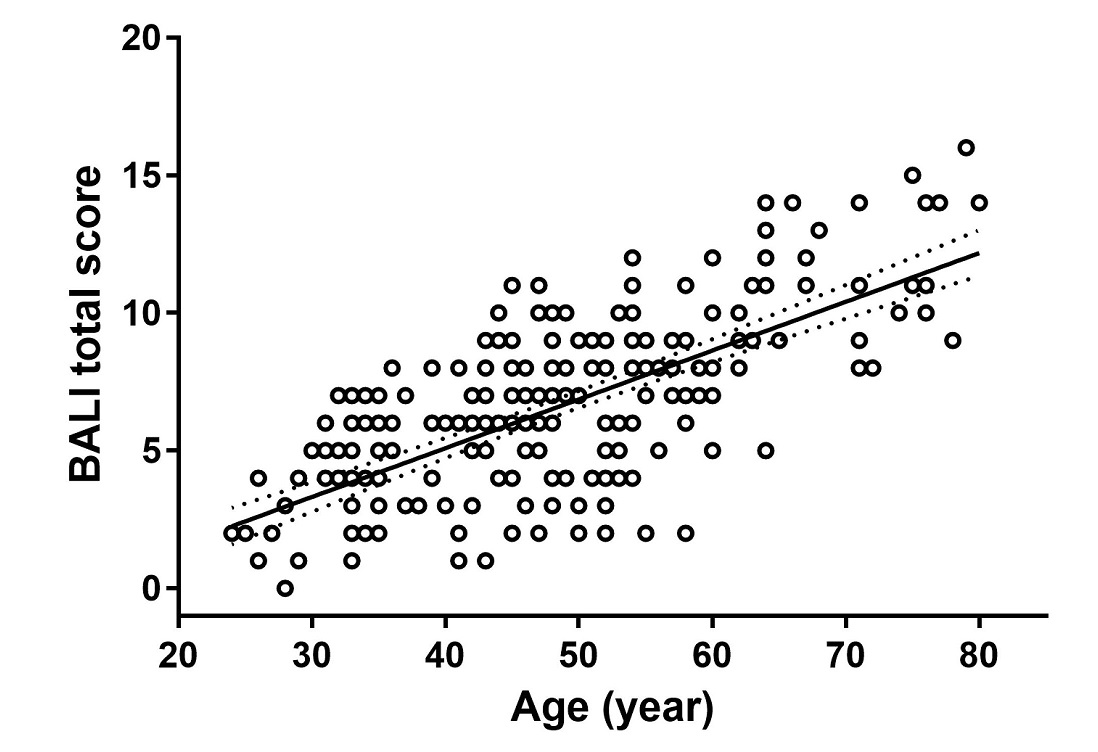
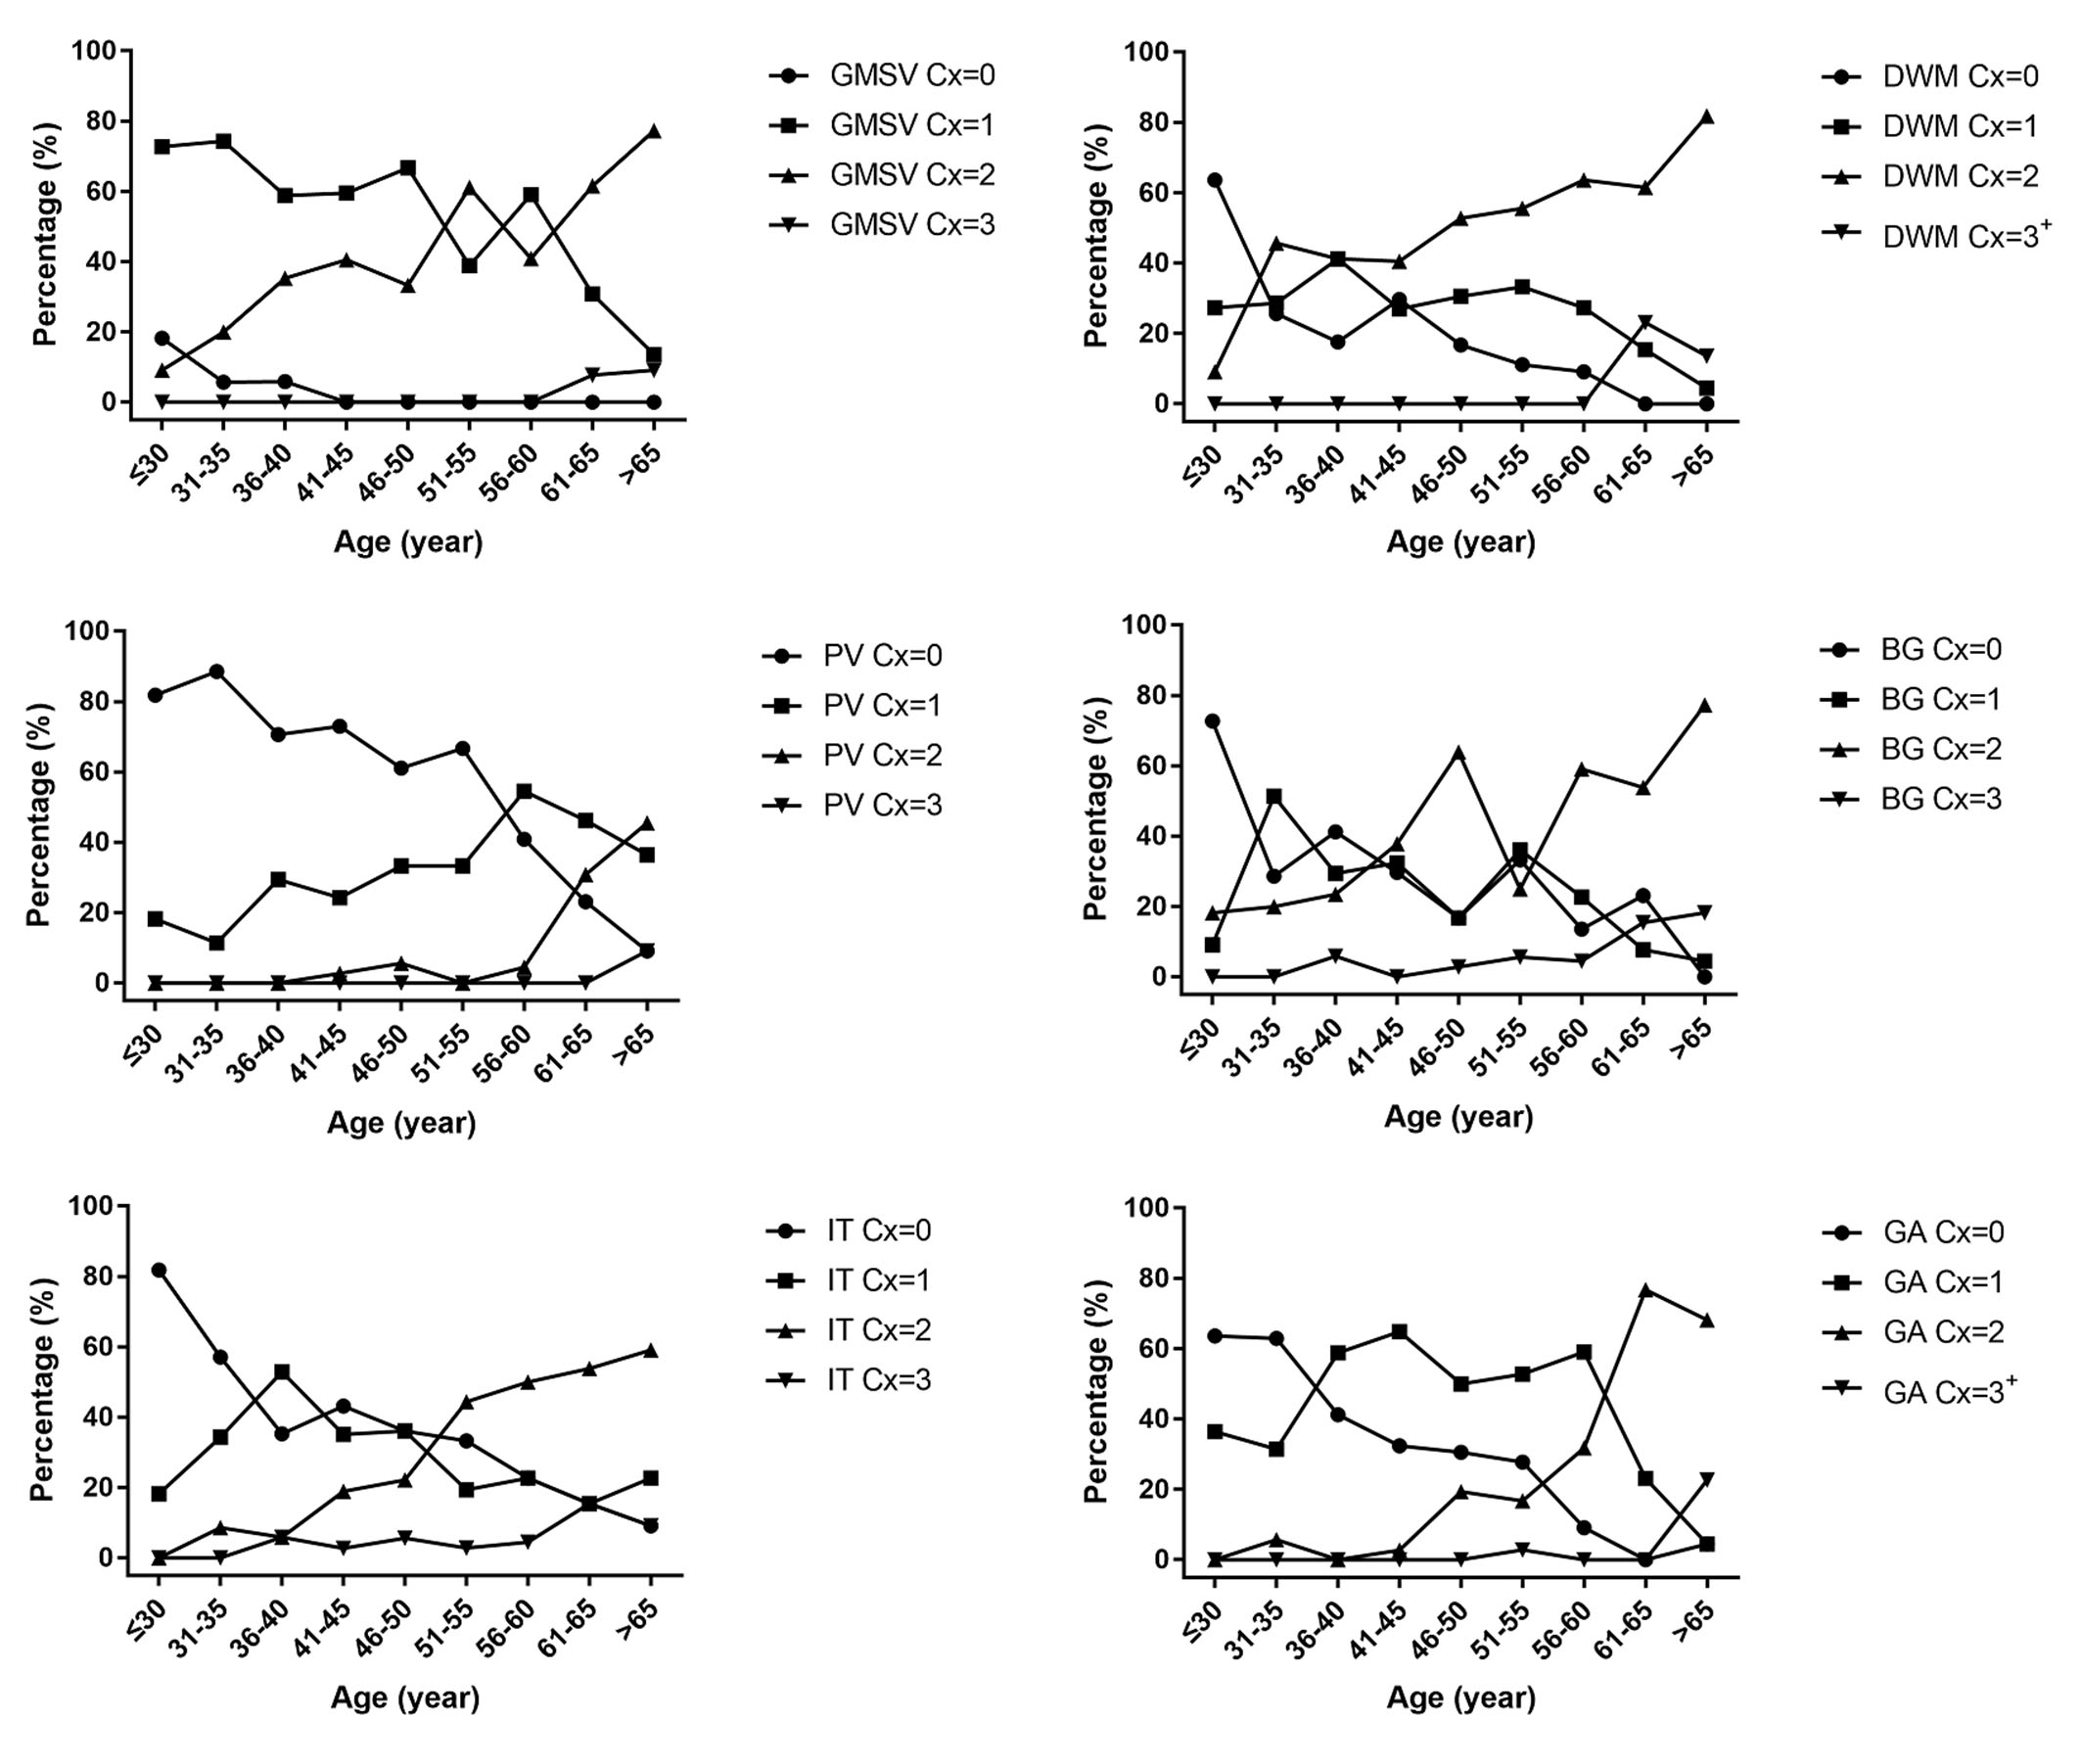
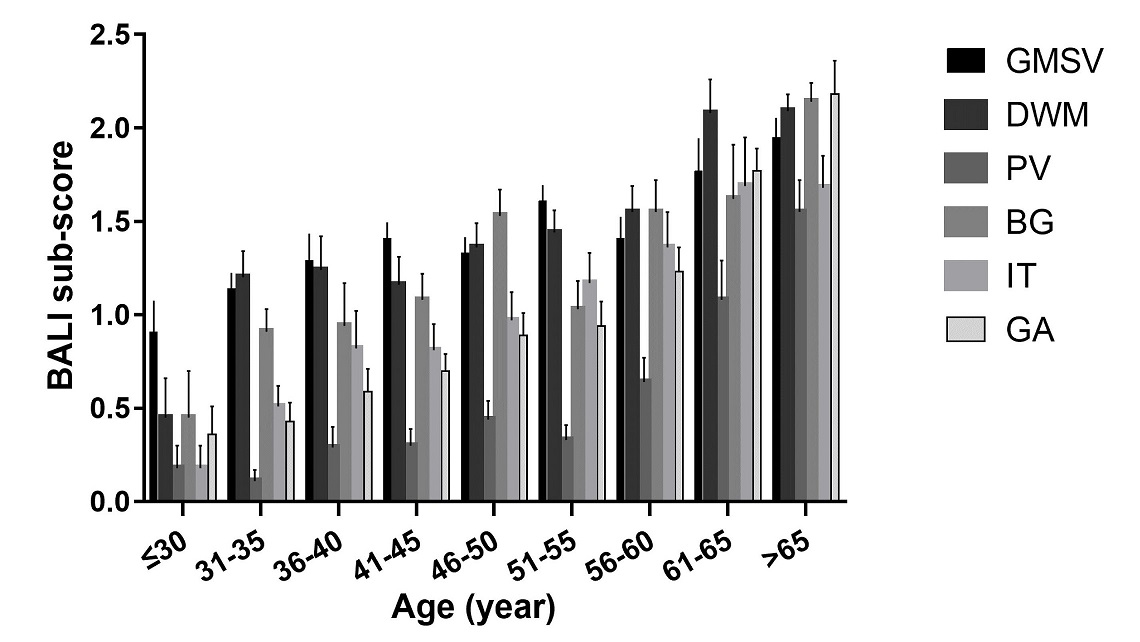
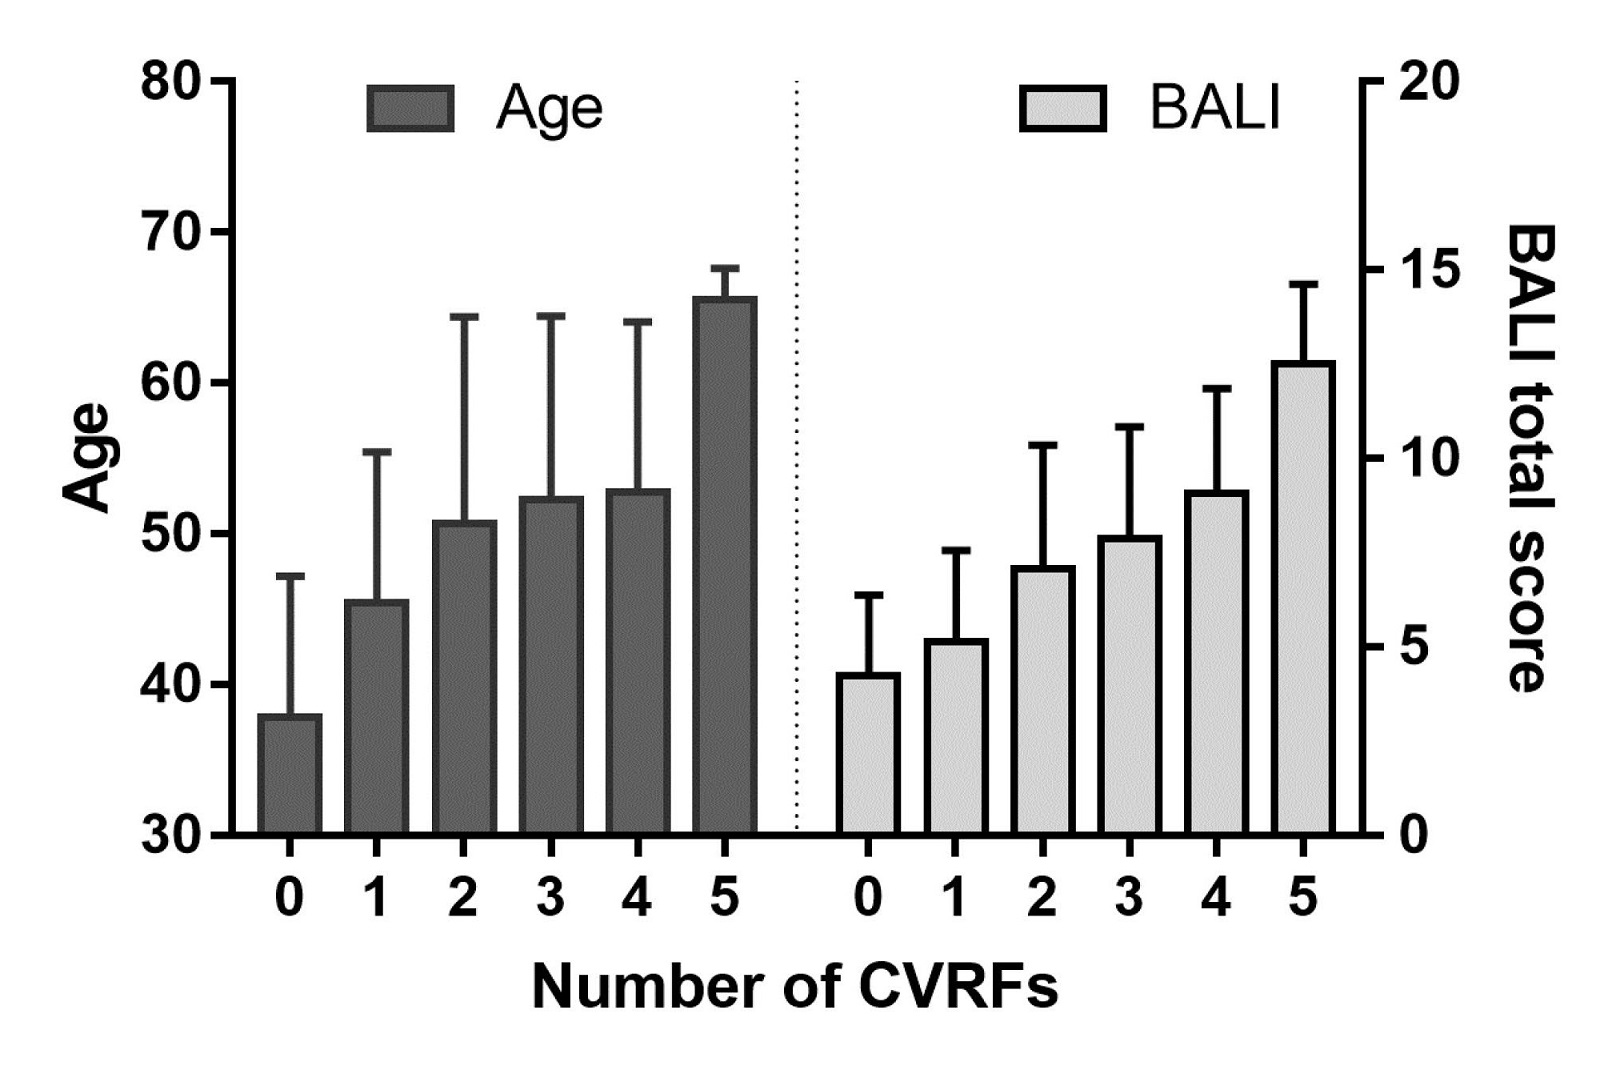
Nearly 90% of the participants had at least one of the CVRF. The mean CVRF scores increased with age (r=0.36; 95% confidence intervals: 0.23-0.48). The BALI total score was closely related to age (r=0.69, p<0.001; Fig 1), and so were the categorical subscores (r’s= 0.41-0.61, p<0.001; Figs 2,3); each differed by the number of CVRF (t-test: 4.16-14.83, Chi2: 6.9-43.9, p’s<0.050; Fig 4). Multivariate analyses adjusted for age and sex suggested a strong impact of the CVRF on the BALI score (for each additional CVRF, odds ratio OR=1.72, 95% CI=1.23-2.39). A higher CVRF level increased the risk of having a higher BALI score, with an AUC=0.73 (95% CI = 0.66-0.79; Fig 5).Discussion
We reported a clear relationship between structural brain health with age and cardiovascular risks across adult lifecourse. In contrast to traditional MRI assessments that mostly focus on understanding one specific type of problem at one time, the BALI takes an holistic evaluation of the brain as a complex functioning system, by assessing and integrating several changes commonly seen in both supratentorial and infratentorial white matter and small vessels. This undertaking is a response to the pressing demand in better understanding the brain as a complex system: multiple factors can contribute heterogeneously to brain structural health. By also studying younger subjects, our research extends the findings of the whole brain structural health changes across the adult life course, demonstrating that accumulation of the structural deficits in the brain begins in young adulthood. Also interestingly, our data showed that different problems in the brain appeared in varied age-associated change patterns. Small vessel problems were already quite prevalent in younger adults, and global atrophy become more common and more marked with age especially in the face of a higher number of CVRFs, whereas periventricular deficits maintained relatively stable until older adulthood. Our data also suggested that the aggregation of the CVRF affected brain structural health. While older subjects tend to accumulate more cardiovascular risk factors on average, the effecting of age on brain structural health did not appear to be age per se, but also the CVRF and their interplay.Conclusions
The accumulation of MRI detectable deficits in the brain can be evident even in younger adults. Cardiovascular risks strongly affect the whole-brain structural health, in addition to the effect of age.Acknowledgements
This research was partly supported by Capital’s Funds for Health Improvement and Research of China (2014-4-4052). Additional funding for data analysis was from Canadian Institutes of Health Research (CSE-125739) and Surrey Hospital & Outpatient Centre Foundation (2015-030). The authors acknowledge Drs. Fu C, Shen Z, Rockwood K, Black SE, and Siu W, for assists with study execution and critical discussions.
References
1.Anstey, KJ., and Dixon, RA. (2014). Applying a cumulative deficit model of frailty to dementia: progress and future challenges. Alzheimers Res Ther. 6, 84.
2.Bjerke, M., Jonsson, M., Nordlund, A., Eckerström, C., Blennow, K., Zetterberg, H., et al. (2014). Cerebrovascular Biomarker Profile Is Related to White Matter Disease and Ventricular Dilation in a LADIS Substudy. Dement Geriatr Cogn Dis Extra. 4, 385-94.
3.Cai, Z., Wang, C., He, W., Tu, H., Tang, Z., Xiao, M., et al. (2015). Cerebral small vessel disease and Alzheimer’s disease. Clin Interv Aging. 10, 1695–1704.
4.Chen, W., Song, X., Zhang, Y.; and Alzheimer's Disease Neuroimaging Initiative. (2011). Assessment of the Virchow-Robin Spaces in Alzheimer disease, mild cognitive impairment, and normal aging, using high-field MR imaging. AJNR Am J Neuroradiol. 32, 1490-1495.
5.Cox, S.R., Ritchie, S.J., Tucker-Drob, E.M., Liewald, D.C., Hagenaars, S.P., Davies, G., et al. (2016). Ageing and brain white matter structure in 3513 UK Biobank participants. Nat Commun. 7, 13629.
6.DeBeer, M.H., and Scheltens, P. (2016). Cognitive decline in patients with chronic hydrocephalus and normal aging: “Growing into deficits”. Dement Geriatr Cogn Dis Extra. 6, 500-507.
7.Fazekas, F., Chawluk, J.B., Alavi, A., Hurtig, H.I.,and Zimmerman, R.A. (1987). MR signal abnormalities at 1.5T in Alzheimer’s dementia and normal aging. AJR Am J Roentgenol. 149, 351-356.
8.Guo, H., Song, X., Schmidt, M. H., Vandorpe, R., Yang, Z., LeBlanc, E., et al. (2014). Evaluation of whole brain health in aging and Alzheimer’s disease: a standard procedure for scoring an MRI-based brain atrophy and lesion index. J Alzheimers Dis. 42, 691–703.
9.Guo, H., Song, X., Vandorpe, R., Zhang, Y., Chen, W., Zhang, N., et al. (2014). Evaluation of common structural brain changes in aging and Alzheimer disease with the use of an MRI-based brain atrophy and lesion index: a comparison between T1WI and T2WI at 1.5T and 3T. AJNR Am J Neuroradiol. 35, 504–512.
10.Guo, H., Siu, W., D’Arcy, R.C., Black, B. E., Grajauskas, L. A., Singh, S., et al. (2017). MRI assessment of whole-brain structural changes in aging. Clin Interv Aging. 12, 1251-1270.
11.Hilal, S., Sikking, E., Shaik, M.A., Chan, Q.L., vanVeluw, S.J., Vrooman, H., et al. (2016). Cortical cerebral microinfarcts on 3T MRI: a novel marker of cerebrovascular disease. Neurology. 87, 1583-1590.
12.Hogstrom, L.J., Westlye, L.T., Walhovd, K.B., and Fjell, A.M. (2013). The structure of the cerebral cortex across adult life: age-related patterns of surface area, thickness, and gyrification. Cereb Cortex. 23, 2521-2530.
13.Luchsinger, J.A., Reitz, C., Honig, L.S., Tang, M.X., Shea, S., and Mayeux, R. (2005) Aggregation of vascular risk factors and risk of incident Alzheimer disease. Neurology. 65, 545-51.
14.Mitnitski, A., Song, X., and Rockwood, K. (2007). Improvement and decline in health status from late middle age: modeling age-related changes in deficit accumulation. Exp Gerontol. 42, 1109-1115.
15.Mitnitski, A., Song, X., and Rockwood, K. (2013). Assessing biological aging: the origin of deficit accumulation. Biogerontology. 14, 709-717.
16.Rostrup, E., Gouw, A.A., Vrenken, H., van Straaten, E.C., Ropele, S., Pantoni, L., et al. (2012). The spatial distribution of age-related white matter changes as a function of vascular risk factors--results from the LADIS study. Neuroimage.60, 1597-607.
17.Scheltens, P., Barkhof, F., Leys, D., Pruvo, J.P., Nauta, J.J., Vermersch, P., et al. (1993). A semiquantative rating scale for the assessment of signal hyperintensities on magnetic resonance imaging. J Neurol Sci. 114, 7-12.
18.Searle, S.D., and Rockwood, K. (2015). Frailty and the risk of cognitive impairment. Alzheimers Res Ther. 7, 54.
19.Smith, E.E., and Beaudin, A.E. (2018). New insights into cerebral small vessel disease and vascular cognitive impairment from MRI. Curr Opin Neurol. 31, 36-43.
20.Song, X., Mitnitski, A., and Rockwood, K. (2011). Nontraditonal risk factors combine to predict Alzheimer disease and dementia. Neurology. 77, 227-234.
21.Song, X., Mitnistski, A., Zhang, N., Chen, W., Rockwood, K., and Alzheimer’s Disease Neuroimaging initiative. (2013). Dynamics of brain structure and cognitive function in the Alzheimer’s disease neuroimaging initiative. J Neurol Neurosurg Psychiatry. 84, 71-78.
22.Song, X., Mitnitski, A., and Rockwood, K. (2014). Age-related deficit accumulation and the risk of late-life dementia. Alzheimers Res Ther. 6, 54.
23.Zhang, N., Song, X., Zhang, Y., Chen, W., D’Arcy, R. C., Darvesh, S., et al. (2011). An MRI brain atrophy and lesion index to assess the progression of structural changes in Alzheimer’s disease, mild cognitive impairment, and normal aging: a follow-up study. J Alzheimers Dis. 26, 359–367.
24.Zhang, N., Song, X., Zhang, Y., and Alzheimer’s Disease Neuroimaging initiative. (2012). Combining structural brain changes improves the prediction of Alzheimer’s disease and mild cognitive impairment. Dement Geriatr Cogn Disord. 33, 318-326.
Figures