0325
Concurrent mapping of electric currents and neurophysiological changes during Transcranial Direct Current Stimulation (tDCS)1USC Stevens Neuroimaging and Informatics Institute, Los Angeles, CA, United States, 2UCLA Neurology, Los Angeles, CA, United States
Synopsis
Transcranial Direct Current Stimulation(tDCS) is a non-invasive neuromodulation technique that uses milliampere currents (applied at the scalp) to modulate cortical excitability. Although tDCS has been shown to improve clinical symptoms in depression, stroke rehabilitation and pain, the exact mechanism of tDCS is not yet fully understood. To help advance the study of tDCS mechanisms, we developed a novel technique that, for the first time, enables concurrent mapping of (i) the applied electric current and (ii) the neurophysiological changes induced in-vivo. In this work, we demonstrate the feasibility as well as reliability of this novel technique through phantom and in-vivo experiments.
Introduction
Transcranial direct current stimulation (tDCS) is a non-invasive neuromodulation technique that modulates cortical excitability by delivering milliampere currents at the scalp. tDCS has been shown to improve clinical symptoms (e.g. in depression, pain and stroke) as well as enhance cognition in healthy subjects[1]. However, the exact mechanism of tDCS is not yet fully understood, and efforts have been hampered in part by an inability to map the tDCS electric currents in conjunction with the brain’s response. Addressing this need, we developed a novel technique that enables concurrent mapping of (i) the tDCS electric current and (ii) the ensuing neurophysiological changes in-vivo.
Methods
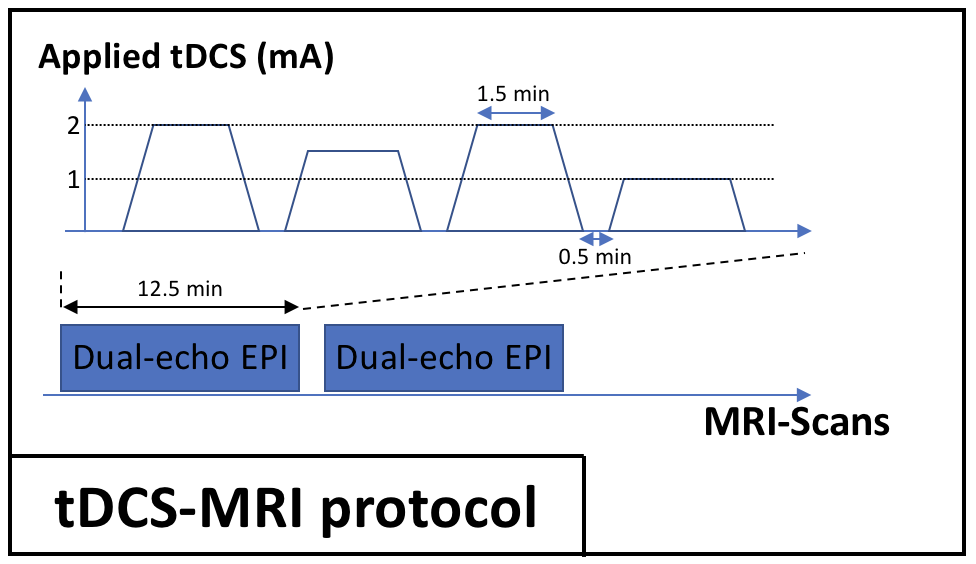
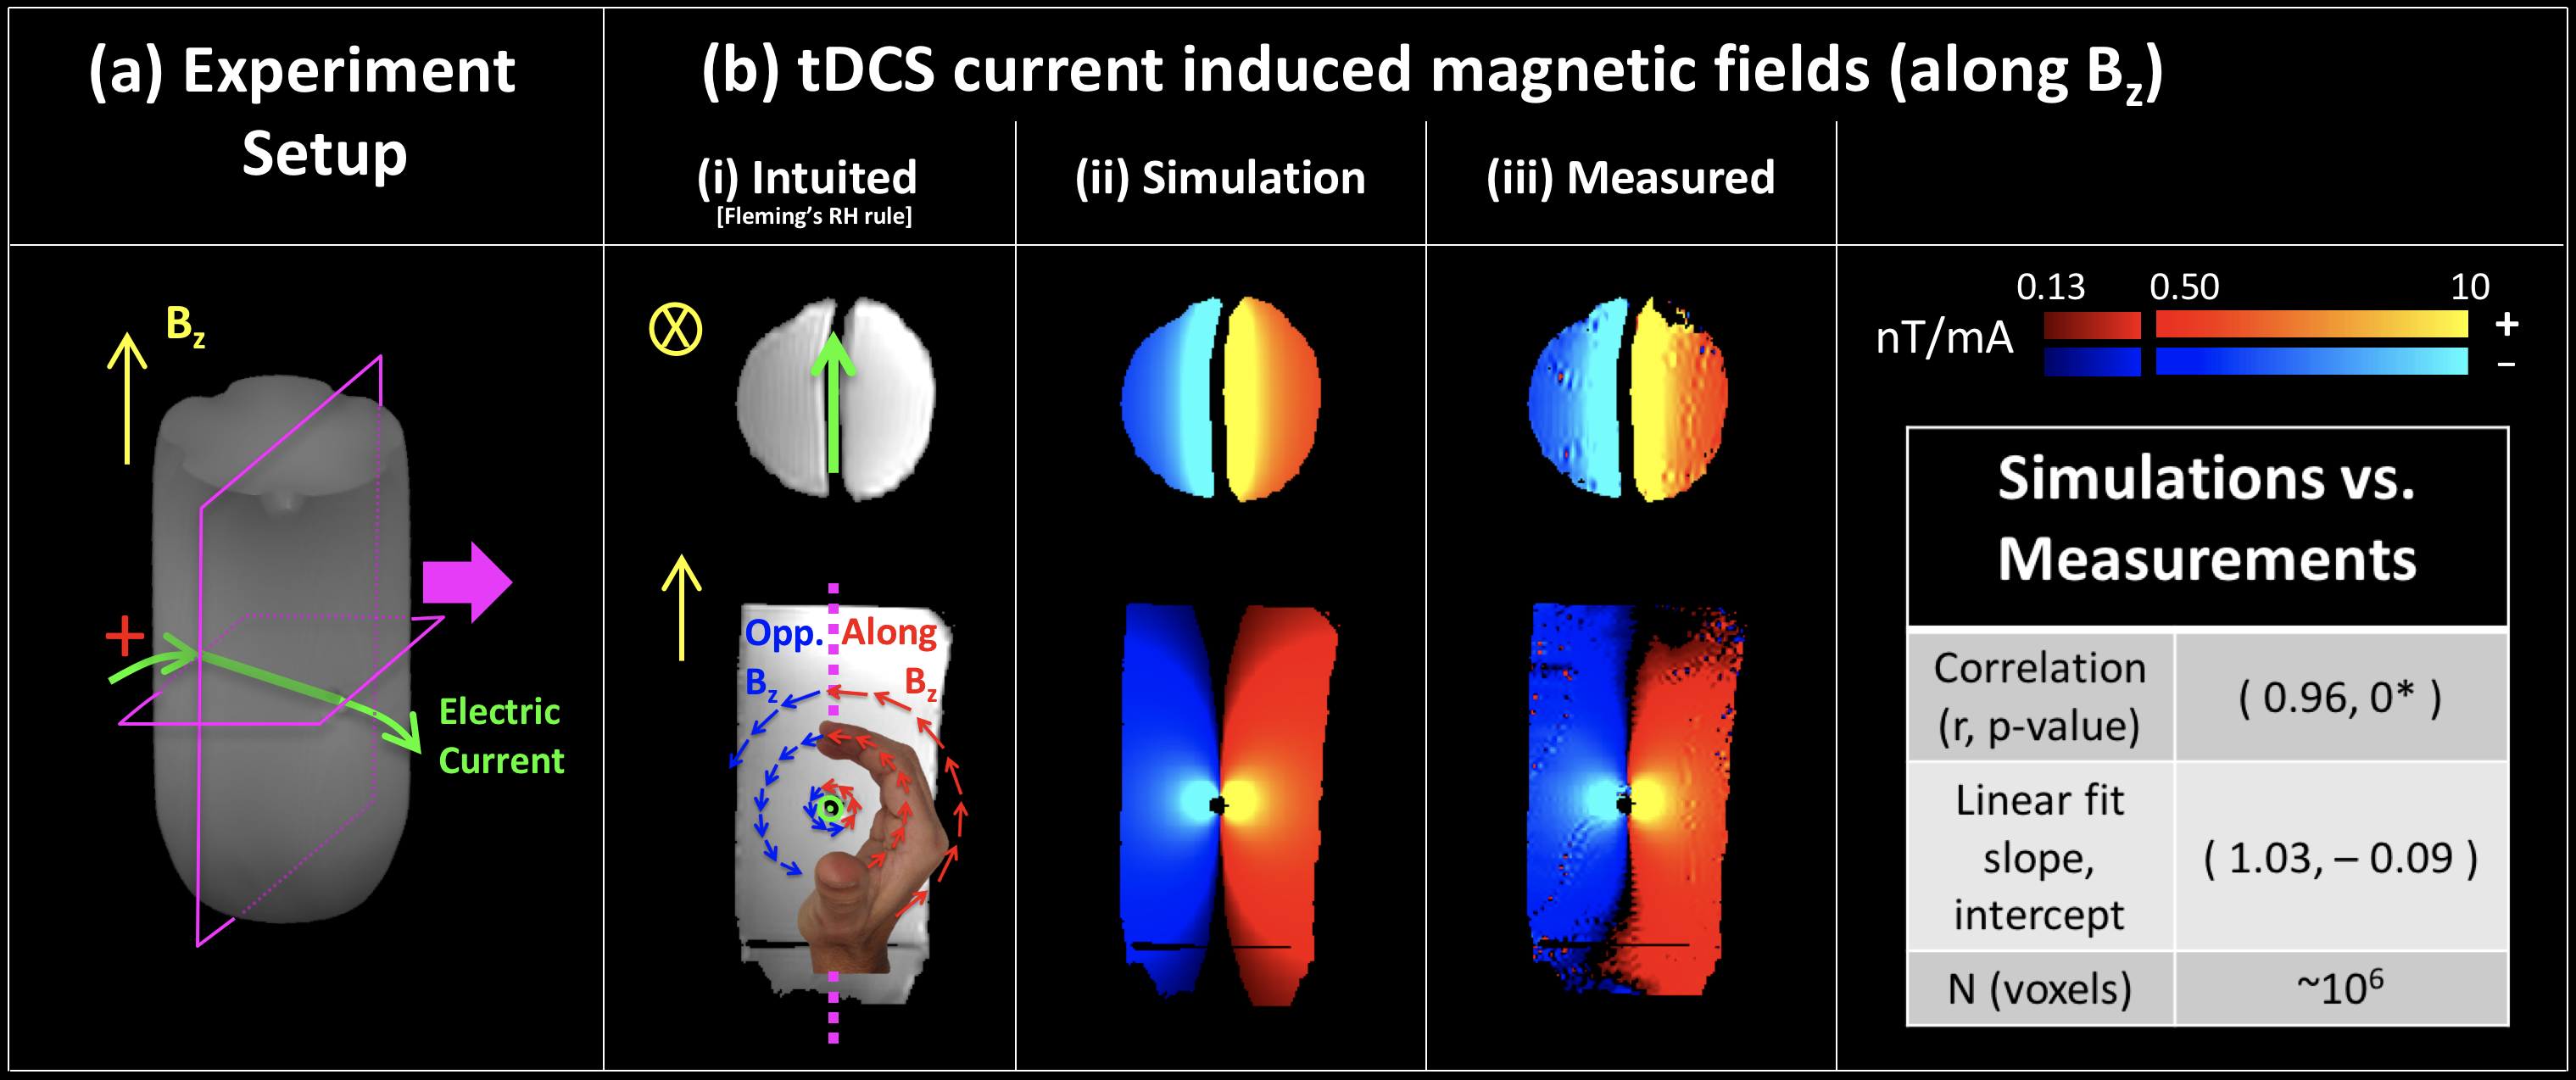
Each experimental session consisted of two dual-echo EPI scans wherein different tDCS current strengths were applied in a block design (See Fig. 1 for the protocol and scan parameters). The 2nd TE of the sequence was chosen as 26 msec. to encode BOLD contrast in the magnitude while the tDCS current induced magnetic fields (along Bz) were encoded in the phase. Although the BOLD contrast under such conditions is well-established[2], the magnetic field measurements are novel and required validation. Consequently, field measurements were first evaluated in a specially designed phantom where the applied current was constrained to follow a predetermined path. Such a design enabled an accurate calculation of the current induced magnetic field using the Biot-Savart law.
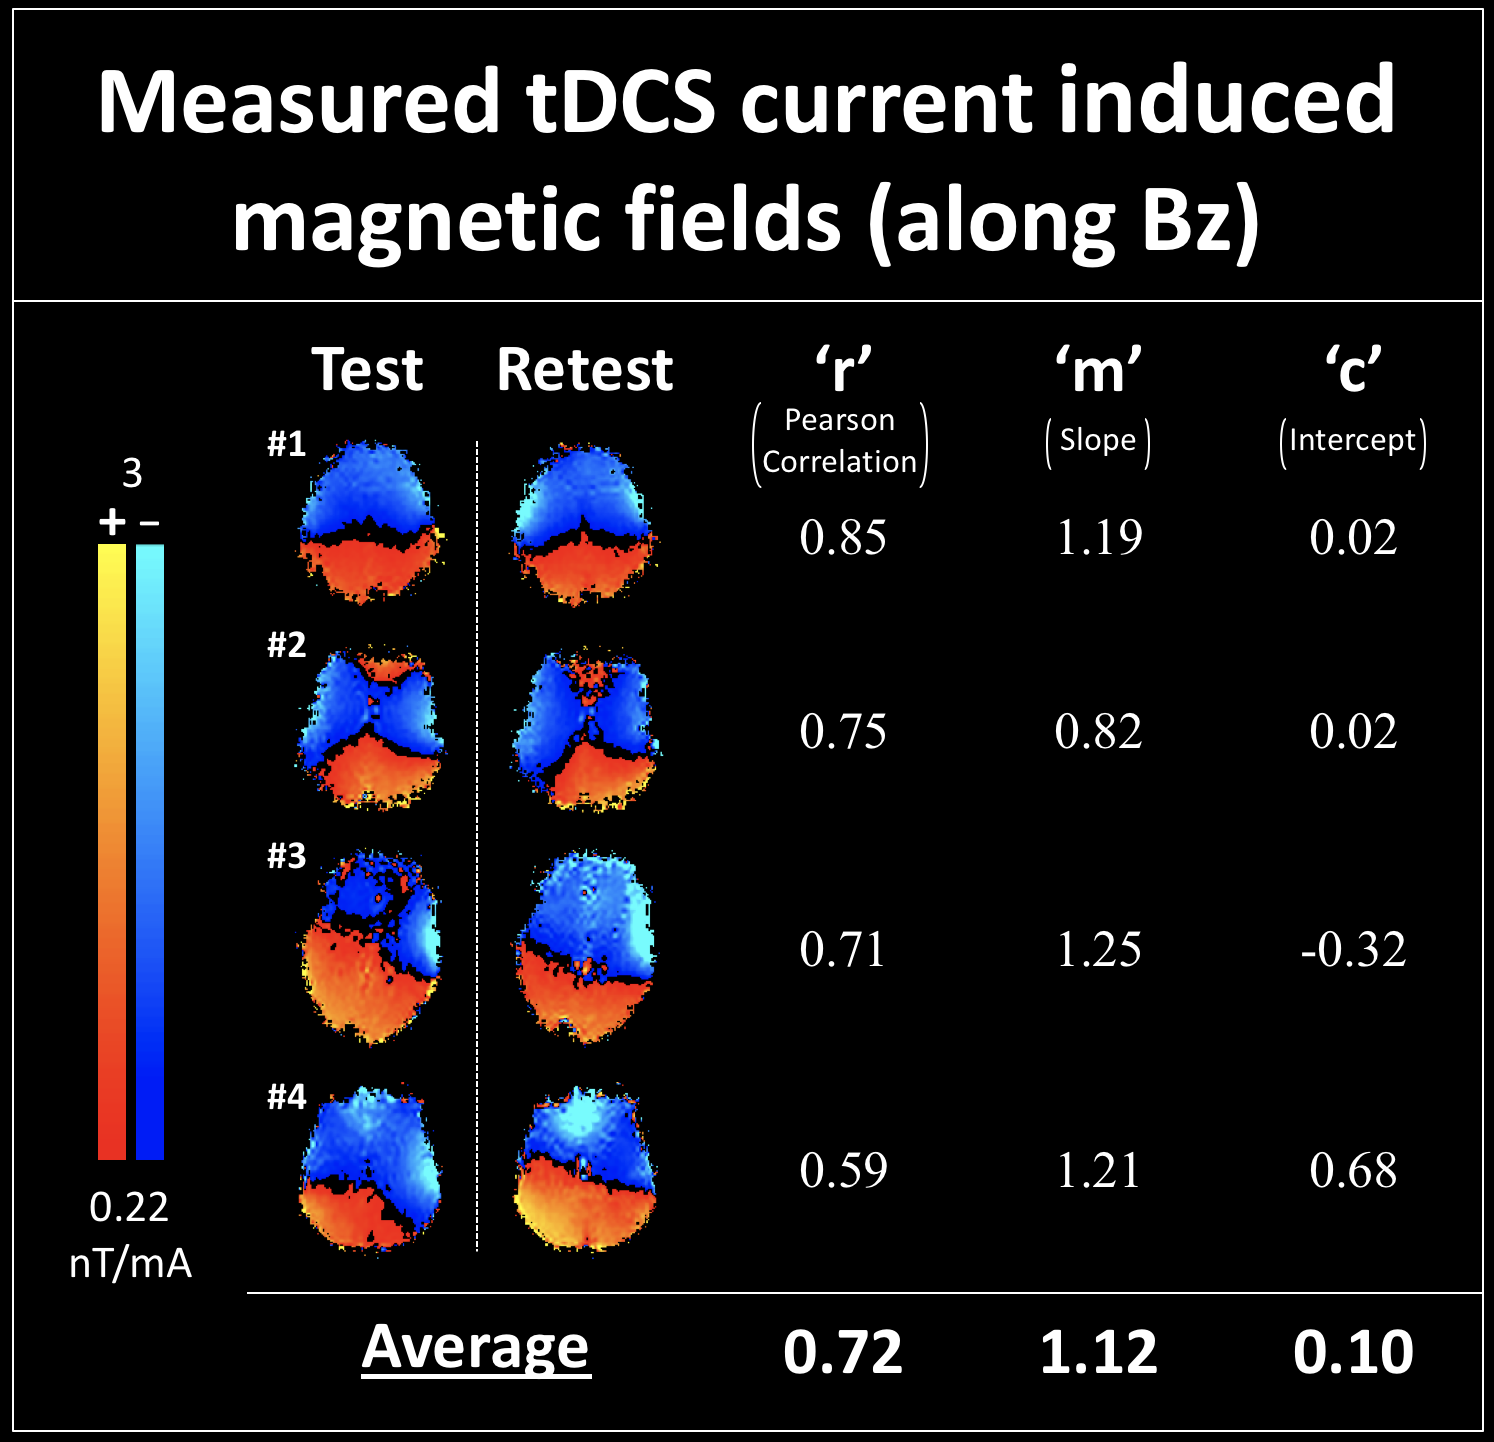
Next, measurements were performed in four subjects (3M). Here, experimental data was acquired from two identical back-to-back sessions in a test-retest paradigm. tDCS was delivered using a bilateral montage targeting the motor cortices (5x7cm electrodes, Anode/Cathode on C4/C3). Phase data was unwrapped using the region growth algorithm. Both phase and magnitude data were realigned to the first volume to correct for motion. Measured magnetic fields were modeled using a general linear model with the applied current as predictor. The slope of this fit can be interpreted as the magnetic field induced (along Bz) per milliampere tDCS.
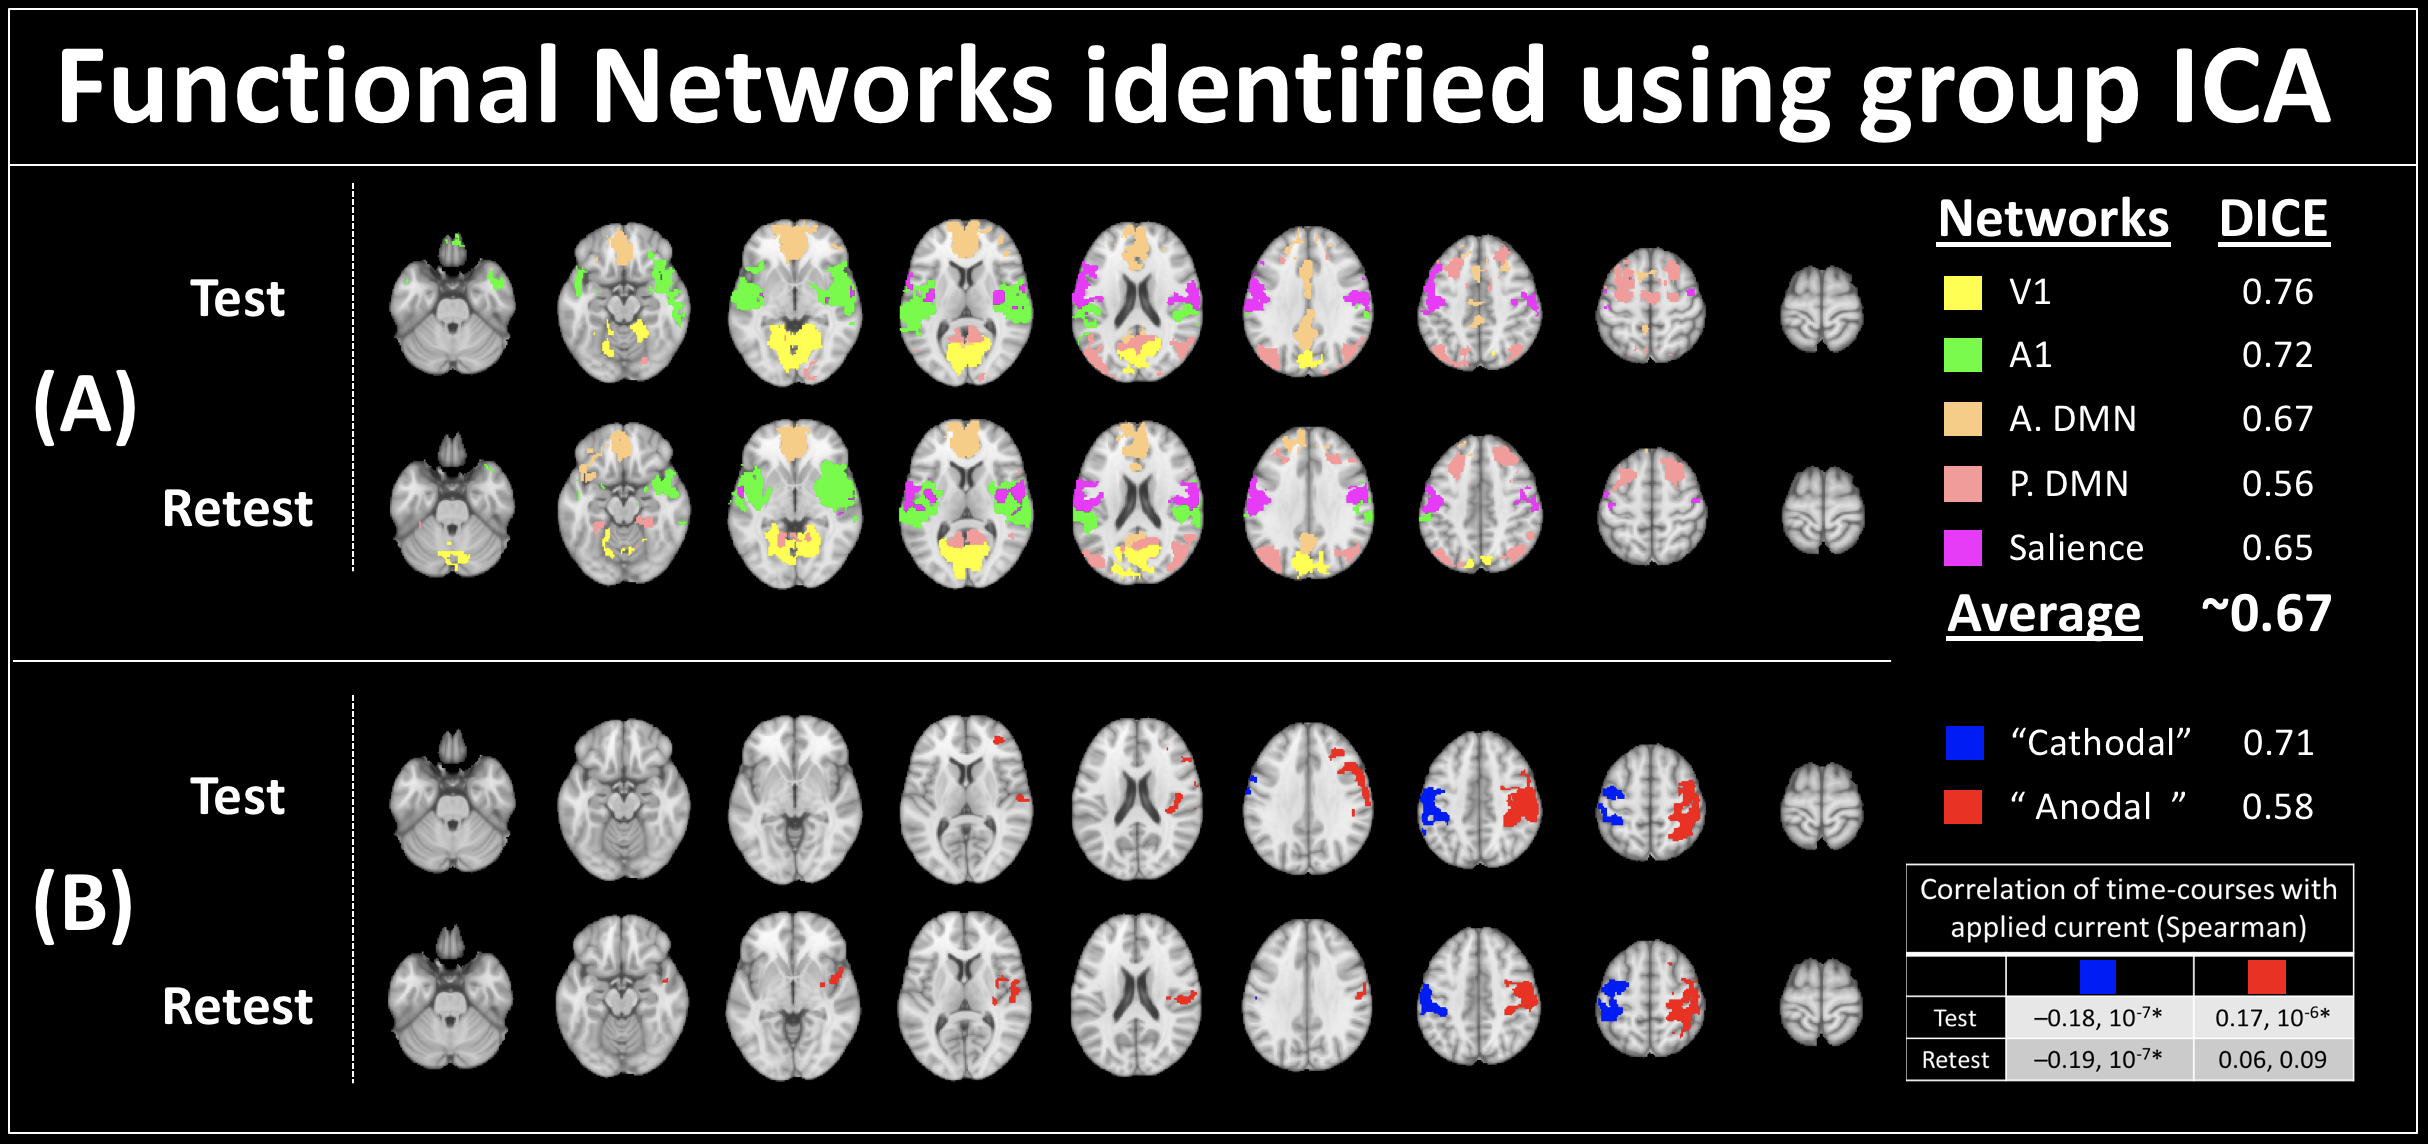
For the BOLD data, a group ICA (50 components, GIFT Toolbox[3]) was performed on the test and retest sessions separately to delineate functional networks. The reproducibility of networks was assessed using the DICE coefficient. Additionally, networks correlating with the applied tDCS-current were identified.
Results
Fig 2. shows the results from the phantom experiment. Measured fields were found to be in excellent agreement with simulations, with a correlation coefficient of 0.96, an almost unity-slope (1.03) and zero-intercept (-0.09 nT). In-vivo field measurements were observed to be fairly reliable, with an average correlation of 0.72 between the test and retest sessions (Fig. 3). Moreover, a linear fit revealed close to unity-slope and zero-intercept estimates between test and retest measurements (Average {slope,intercept} across subjects = {1.12, 0.10 nT}).
In the BOLD dataset, group-ICA identified typical brain networks with an average DICE coefficient of 0.67 between test and retest sessions (see Fig 4.A). The analysis also identified a singular region underneath each electrode (DICE coefficients = 0.58|Anode, 0.71|Cathode). For these ICA components, the mean time-courses were found to correlate with the applied tDCS-current, with a positive correlation for the region under the anode and a negative correlation for the one under the cathode(Spearman(r,p) = {(0.17,10-6)Test, (0.06,0.09)Retest}Anode, {(-0.18,10-7)Test, (-0.19,10-7)Retest}Cathode). Note that the group-ICA’s were run separately on the test and retest sessions.
Discussion
In this work, we demonstrate a novel technique that enables concurrent mapping of the tDCS current induced magnetic field (along Bz) and BOLD contrast. We evaluated the proposed technique first by performing magnetic field measurements in a phantom. The near-unity slope and almost-zero intercept observed (1.03, -0.09 respectively) between measurements and simulations demonstrate that the technique is accurate and unbiased. Additionally, high correlations (0.72) between consecutive measurements in-vivo (test-retest experiments) indicate the feasibility and reliability of magnetic field measurements in typical tDCS settings.
The reliability of BOLD measurements is suggested by the fairly high DICE coefficients of the brain networks detected (~0.67 on average). Notably, the ICA analysis revealed spatial components positively correlated with the applied current under the excitatory electrode (Anode). A similar negatively correlated component was detected under the inhibitory electrode (Cathode). All but one of these correlations were significant (and the remaining was trending towards significance, p~0.09). Although imaging artifacts cannot be ruled out at this stage[4], these preliminary results are consistent with the effects of tDCS reported in literature[5].
Conclusion
In this work, we demonstrate a novel technique that enables concurrent mapping of (a) the tDCS electric current and (b) the ensuing neurophysiological changes in-vivo, opening a new avenue to understand the mechanism of tDCS and improve its therapeutic potential.
Acknowledgements
No acknowledgement found.References
[1]: "Battery powered thought: Enhancement of attention, learning, and memory in healthy adults using transcranial direct current stimulation", Coffman BA. et al., Neuroimage. 2014 Jan 15;85 Pt 3:895-908
[2]: "Developmental trajectories of cerebral blood flow and oxidative metabolism at baseline and during working memory tasks", Jog MA., Neuroimage. 2016 Jul 1;134:587-596
[3]: “A review of group ICA for fMRI data and ICA for joint inference of imaging, genetic, and ERP data”, Calhoun VD. et al., Neuroimage. 2009 Mar;45(1 Suppl):S163-72
[4]: “Imaging artifacts induced by electrical stimulation during conventional fMRI of the brain”, Antal A. et al., Neuroimage. 2014 Jan 15;85 Pt 3:1040-7
[5]: “Excitability changes induced in the human motor cortex by weak transcranial direct current stimulation”, Nitsche MA. et al., J Physiol. 2000 Sep 15;527 Pt 3:633-9
Figures