0323
Free lunch may not exist, but free contrast does: Calculation of Susceptibility weighted Imaging contrast from data obtained for MR Elastography1Philips Healthcare, Bengaluru, India, 2Indian Institute of Technology, Madras, India
Synopsis
In typical phase contrast based MR imaging studies like MR Elastography, the phase of interest is extracted from the data and is used in downstream processing to calculate the relevant clinical parameters of interest. While the background phase is typically discarded, we explored the feasibility of obtaining other relevant contrast like SWI contrast from this background phase. This indeed provides useful independent information and we provide evidence on a phantom and in-vivo human experiments. For example, SWI contrast obtained from MRE data of the brain improves the visualization of diamagnetic choroid plexus and paramagnetic internal cerebral veins.
Introduction
MR Elastography1,2, a phase contrast based MR imaging technique, is rapidly gaining world-wide clinical acceptance for the assessment of hepatic fibrosis and is being actively investigated for other anatomies including brain. Typically, external vibrations are induced in the tissue of interest and the propagation of these mechanical waves are encoded into the phase of MR images with motion encoding gradients (MEG). The motion-dependent phase is then extracted from the background phase and is used for the calculation of the mechanical parameters of interest. The background phase that is typically discarded has rich information about the tissue property of like magnetic susceptibility - especially when gradient echo based sequences are used. We hypothesize that this phase data can be used for calculation of other contrasts of clinical relevance. In this exploratory work, we investigated the feasibility of calculating susceptibility weighted imaging3 contrast from MRE data.Methods
Theory
With the typical gradient echo MRE implementation, a two-point4 encoding is performed with MEGs of opposite polarities. The phase of these two images, in addition to the displacement dependent phase, will also include information from the background that is dependent on magnetic field heterogeneity, tissue heterogeneity etc.
The signal in these images can be represented as S1 and S2:
S1=M1 e(iθ1) where θ1 = θb+θm1 and S2 = M2 e(iθ2) where θ2 = θb + θm2
where M1 and M2 are the corresponding magnitude, θ1 and θ2 are the phases, θb is the background phase, θm1 and θm2 are the displacement dependent phases, which, when everything else can be considered equal, would simply have equal values but with opposite signs (θm1= - θm2=θm).
Extraction of the motion dependent phase is done using
angle(SMRE)=angle(S1*conj(S2 ))=angle(M1M2 ei(θ1 - θ2 ) ) = angle(M1M2 ei(2θm) )
This information is then used in the subsequent post-processing steps to calculate the mechanical properties of the tissues1.
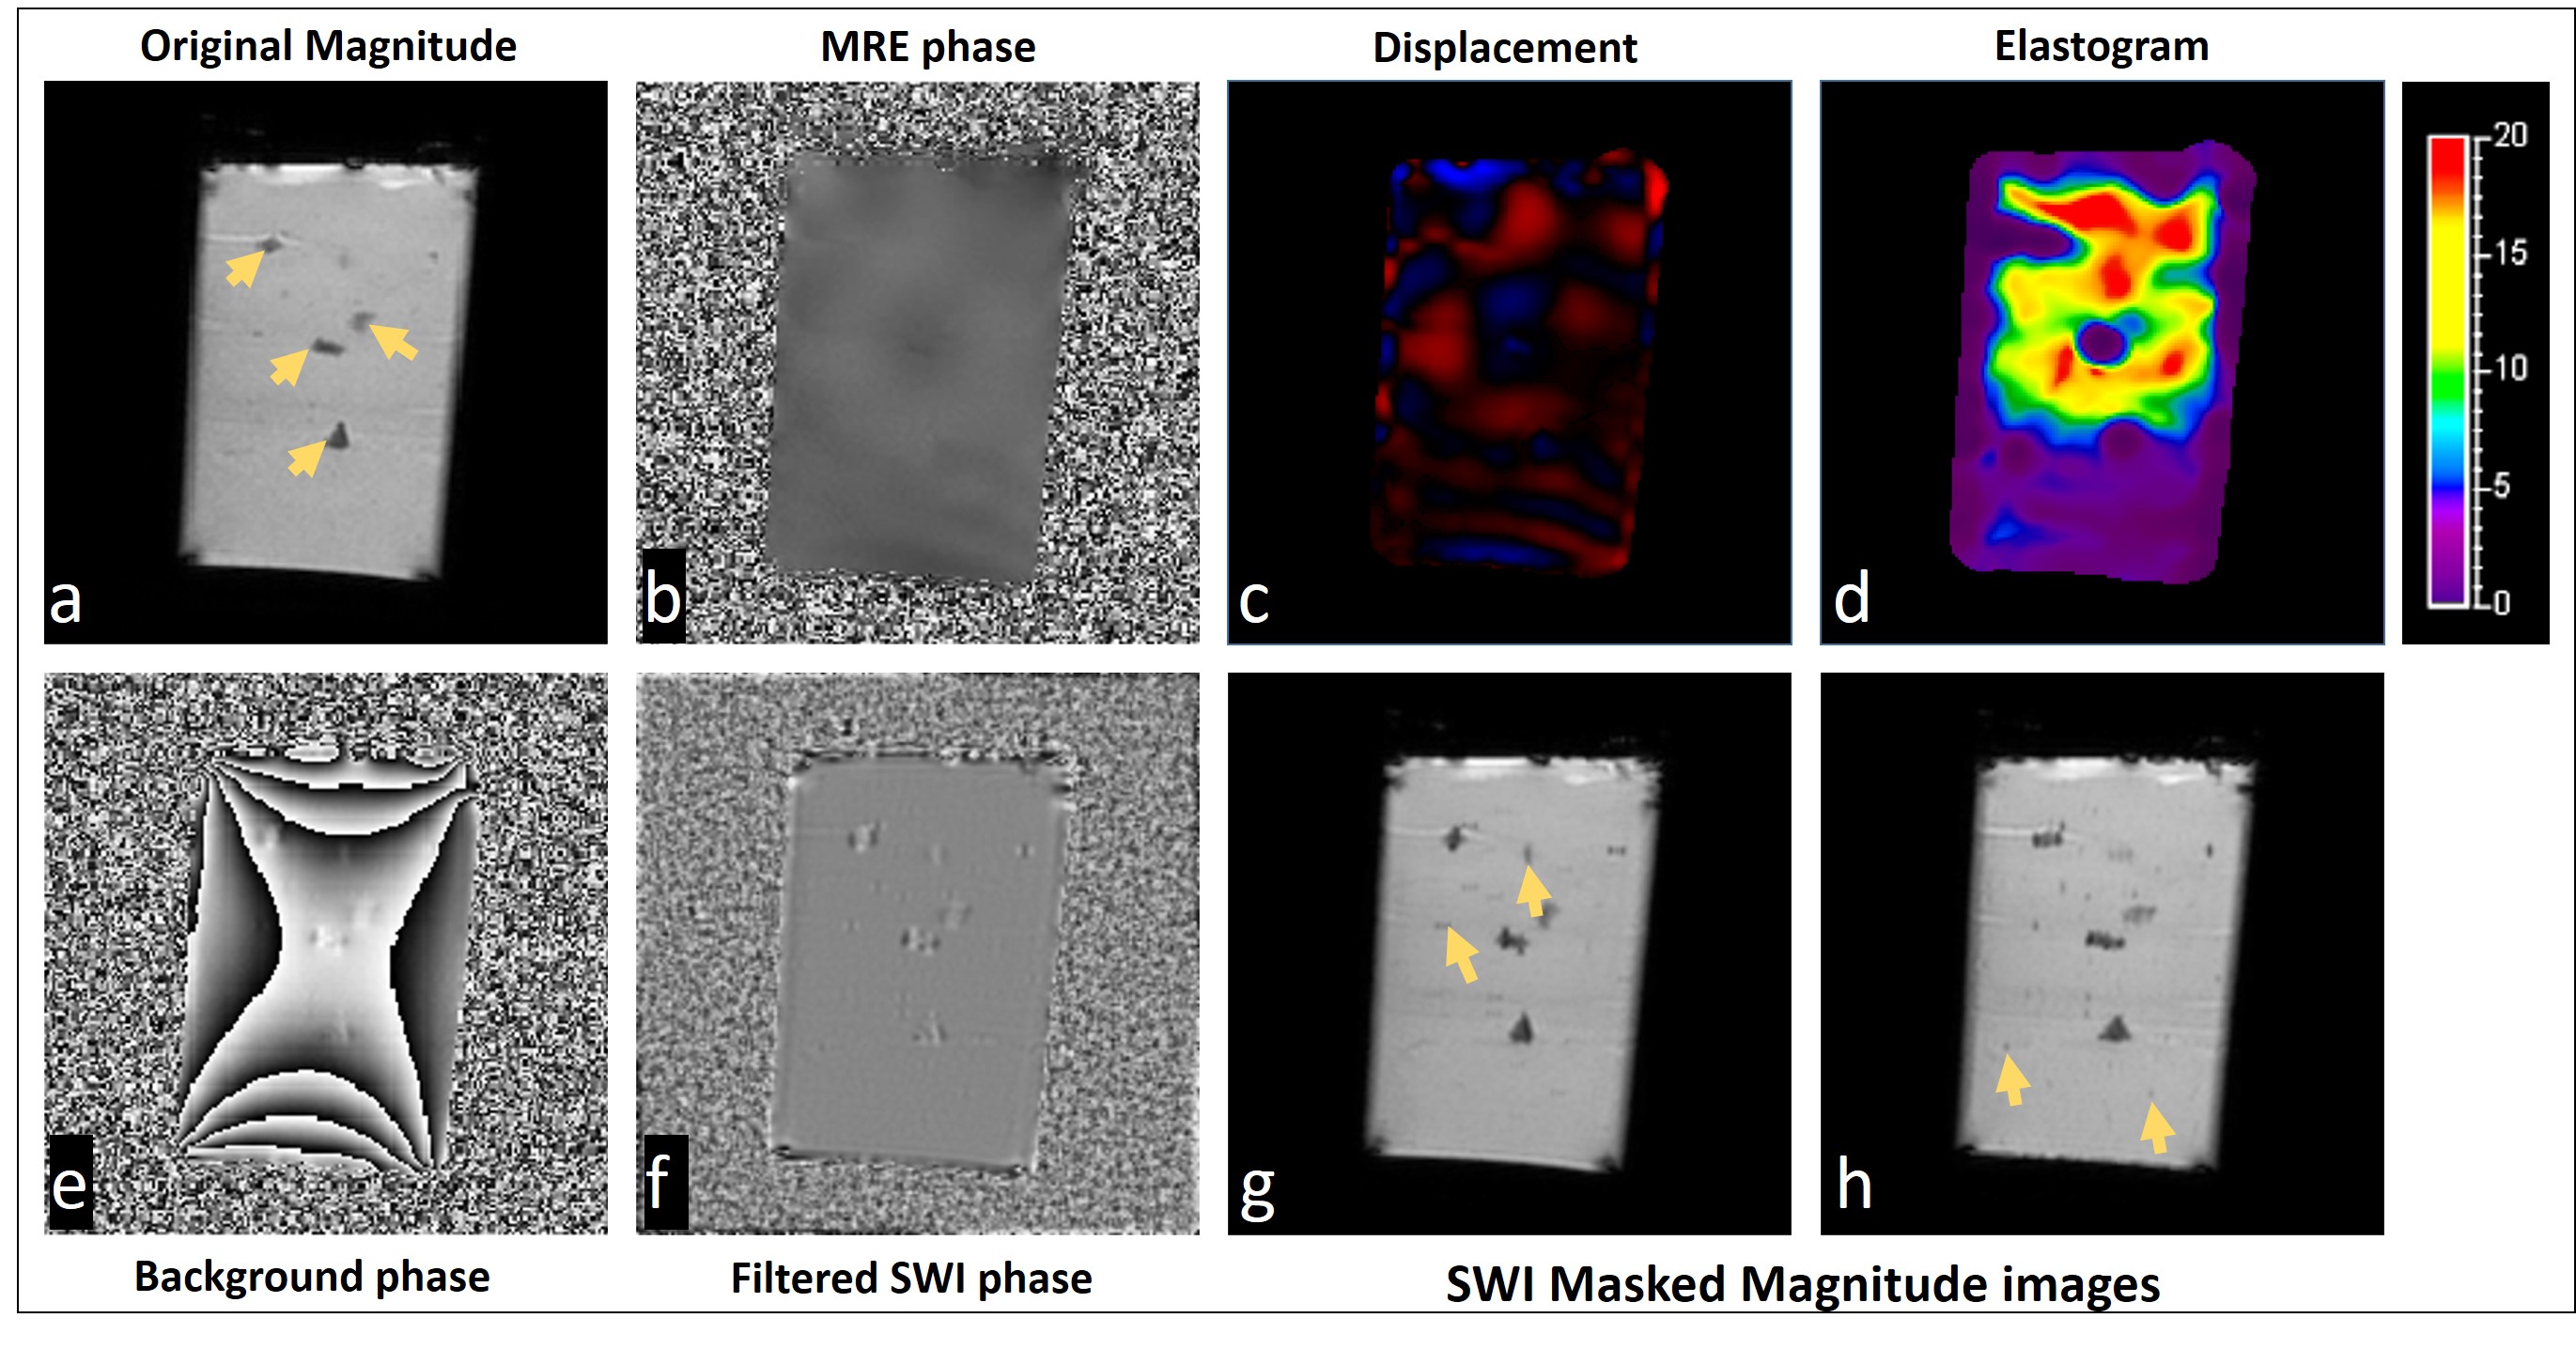
The background phase and SWI magnitude can be calculated from the same MRE source data as below:
angle(Sswi) =angle(S1*S2 )=angle(M1 M2 ei(θ1+θ2))=angle(M1M2 ei(θb))
abs(Sswi) = √(M1M2) or (M1+M2)/2
Once this SWI related background phase is calculated from MRE data, mask functions5 are calculated for diamagnetic structures and paramagnetic structures. These masks are then multiplied on to the original magnitude image to obtain the final SWI weighted magnitude images
MR imaging parameters
All the data were acquired on a 1.5T
scanner (Multiva, Philips Healthcare, the Netherlands) and the volunteers had
provided informed written consent. Other
relevant parameters of acquisition TR/TE/MRE frequency are listed below: Phantom:
56ms/15ms/90Hz, Brain: 60ms/24ms/50Hz and Liver: 50ms/19ms/60Hz; . Since MRE is typically obtained with 4 different phase offsets, SWI
contrast is obtained from these offsets individually and the final image is calculated as the mean of these offsets.
Results
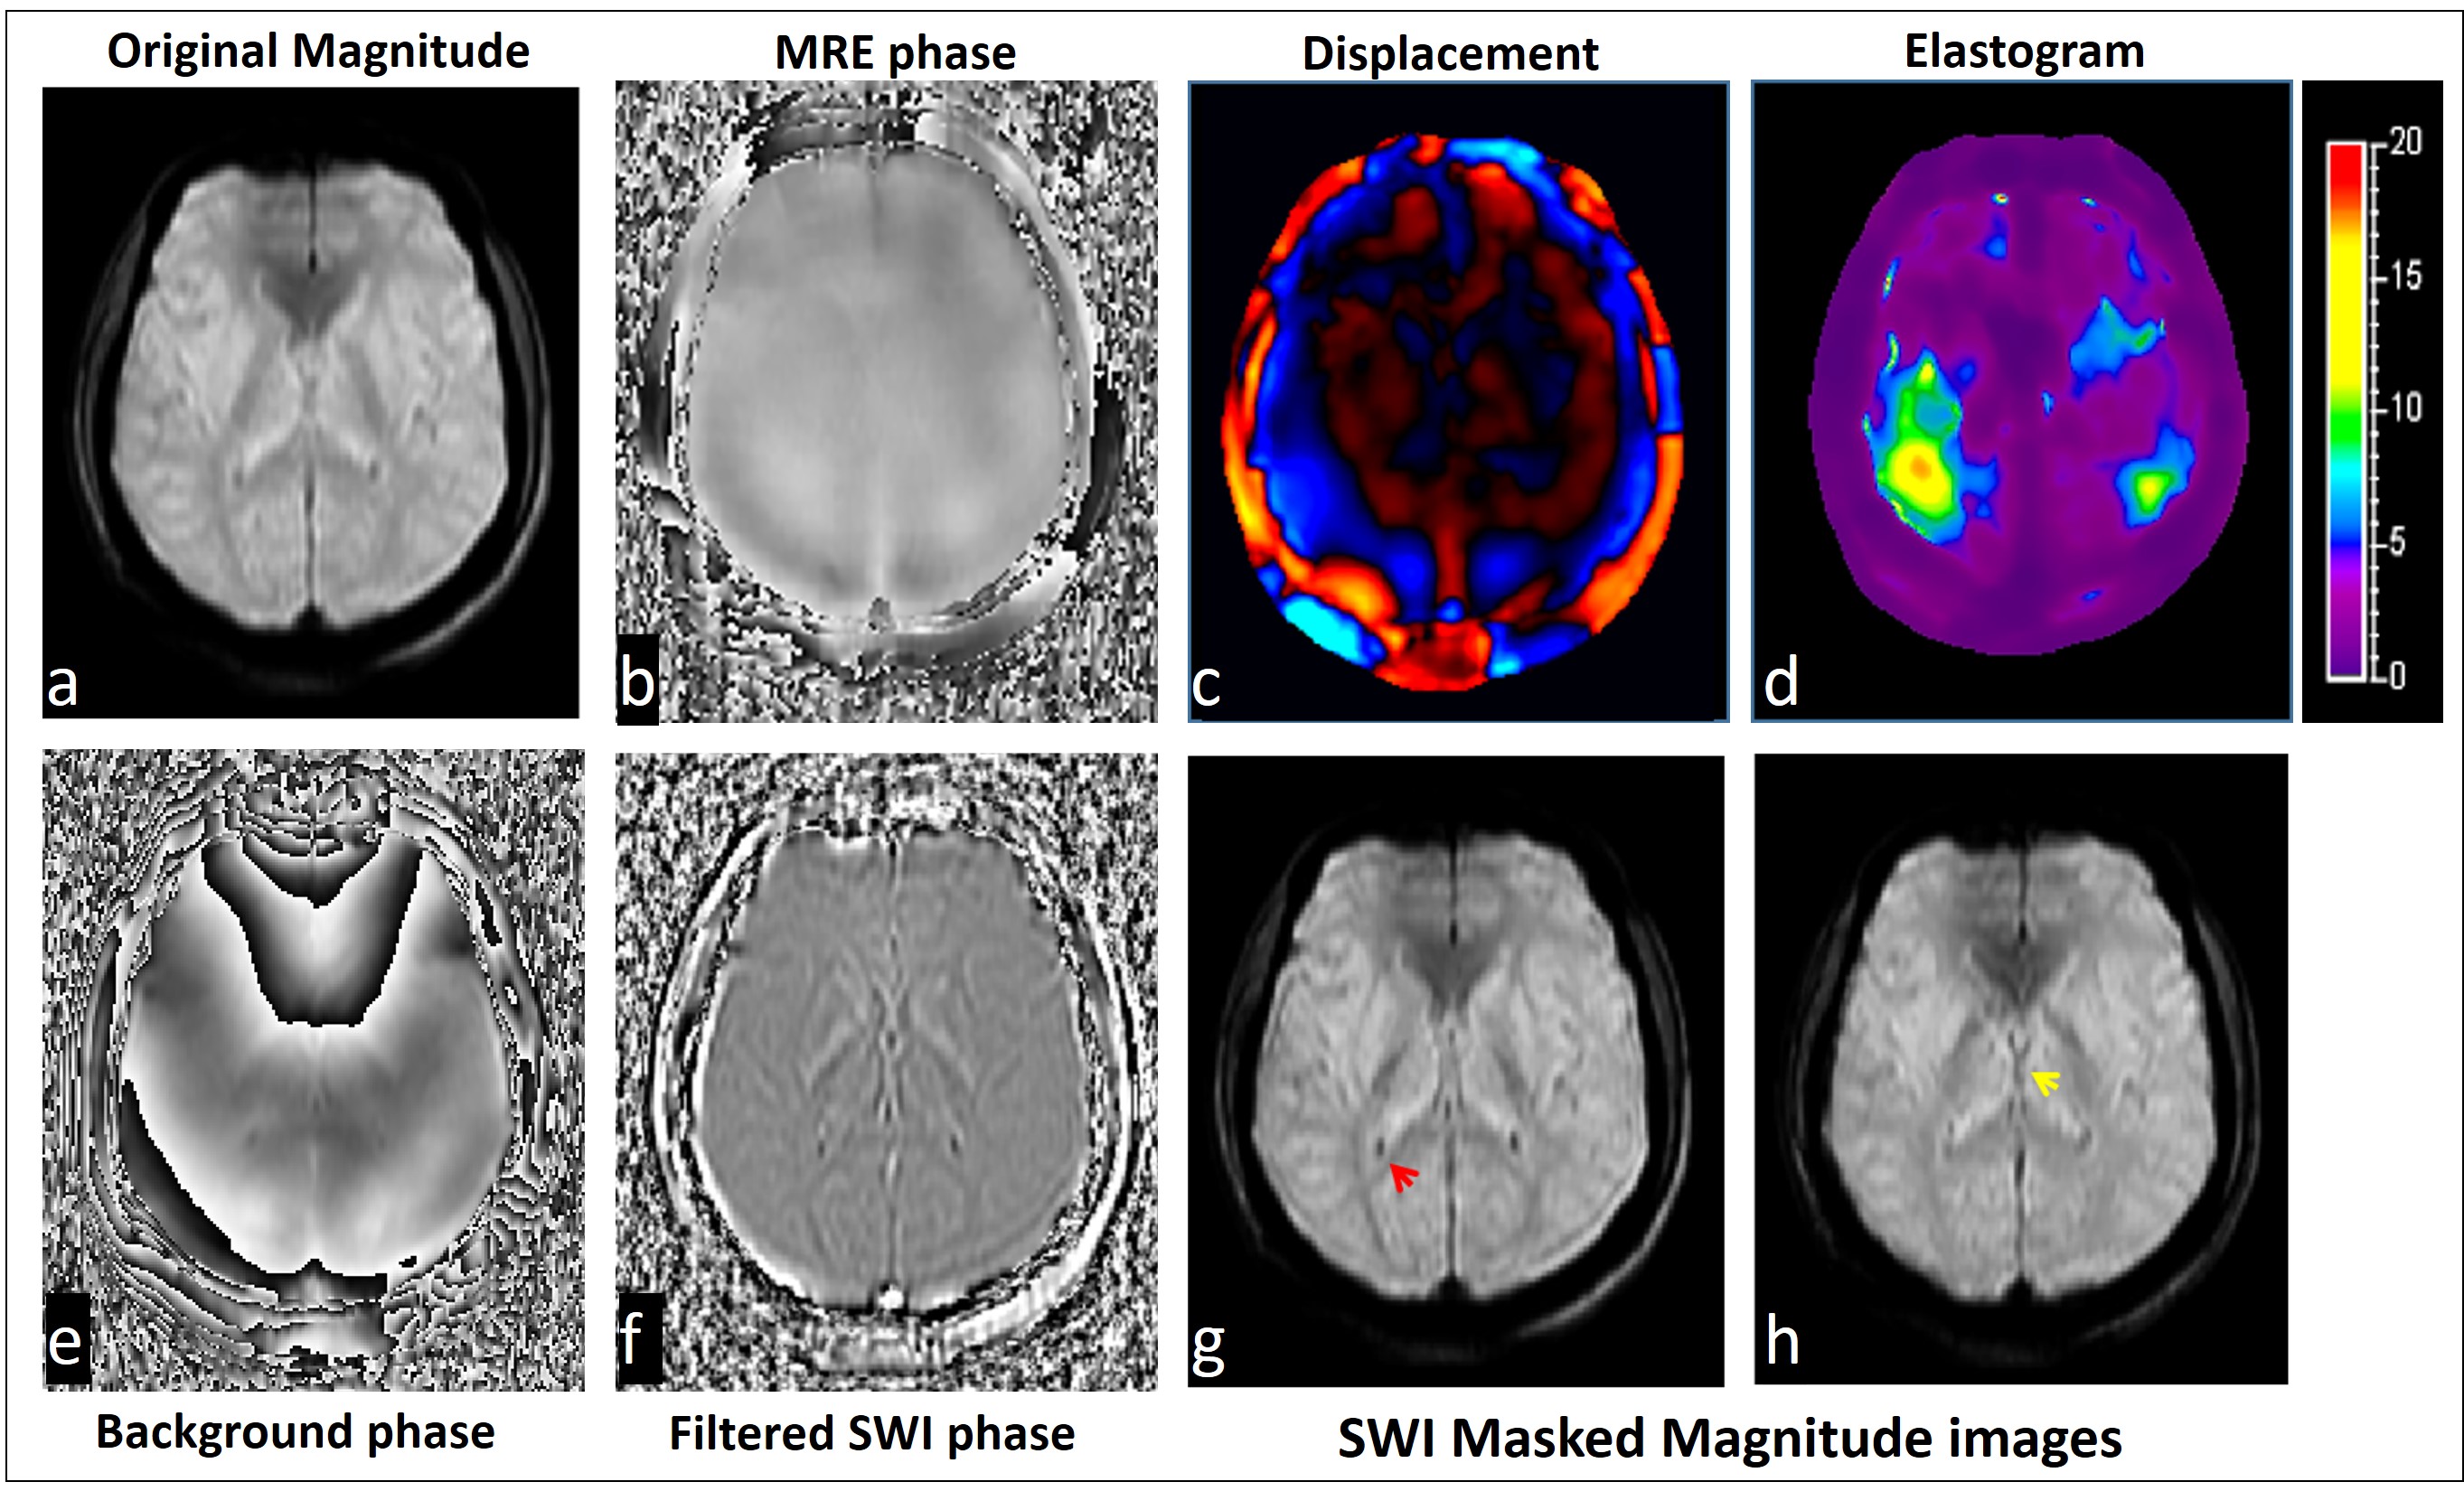
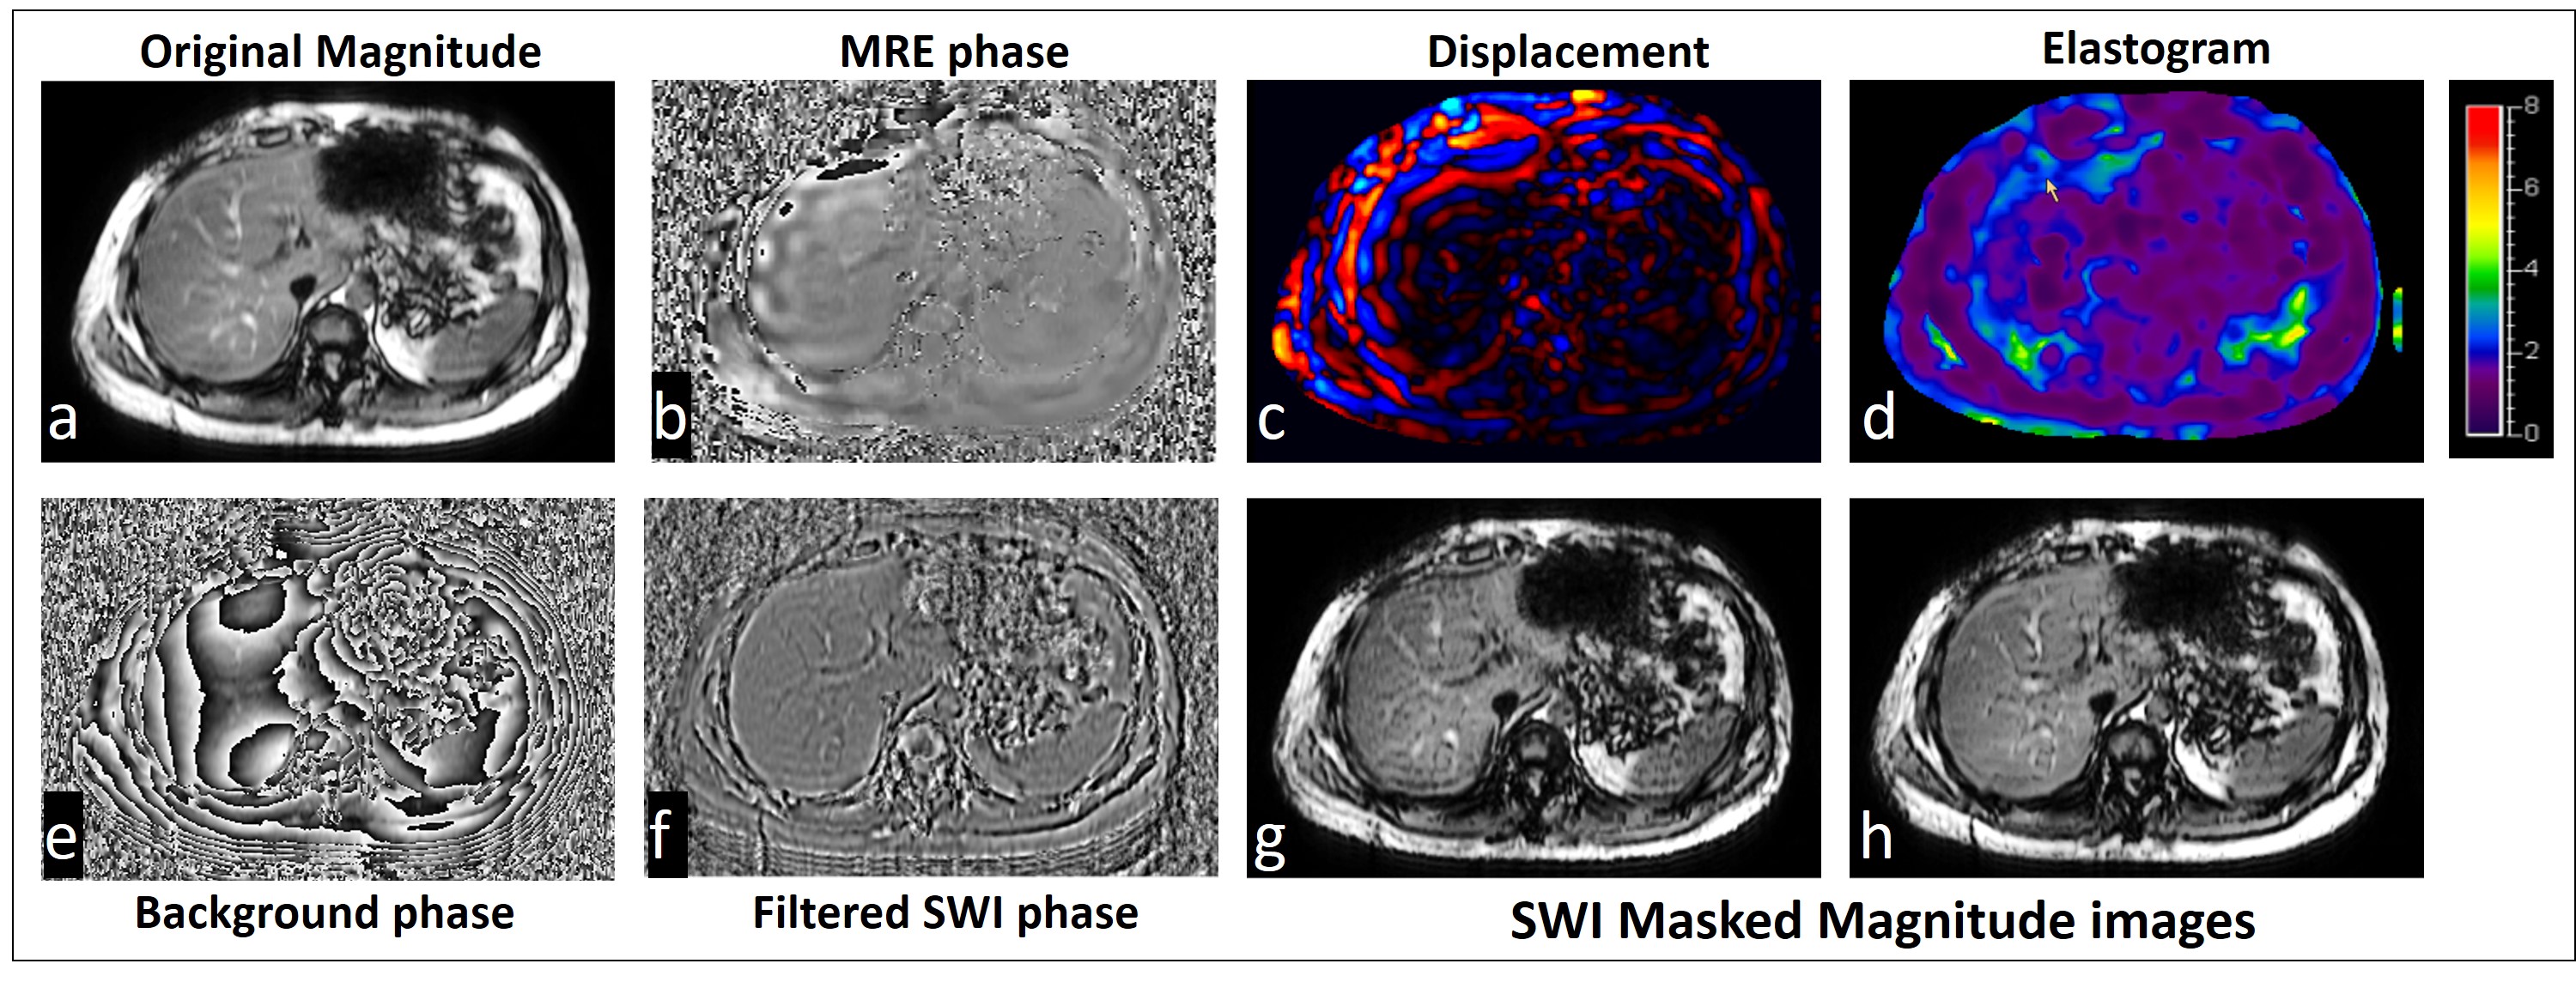
Figure 1 shows example images from an Agar-Agar phantom with stone and air-bubble inclusions, where the SWI and MRE processing results are shown from the same source data. While the presence of the stones themselves are emphasized, it can be seen that presence of air bubbles that are not visualized in the original magnitude images, also become visible. Figures 2 and 3 show the corresponding data obtained from brain and liver studies respectively. Contrast of the diamagnetic choroid plexus and the paramagnetic internal cerebral veins are clearly seen in the respectively masked images. Similarly, enhancement of the contrast between the liver vasculature and the parenchyma is visible in the SWI masked images.Discussion
We were able to obtain SWI contrast from MRE data, which improved the contrast of MR images especially in the brain and enabled the visualization of smaller structures not visible in the original magnitude images. Since both MRE and SWI contrasts are obtained from the same data, these images are naturally co-registered; Hence, a multi parametric analysis becomes possible for the radiologist without the need for any additional post-processing. This technique can potentially be advantageous in applications where both SWI and MRE contrasts are useful, for example in the assessment of fibrosis, tumors, Alzheimer’s6–11 etc. One limitation of this study is that data was not obtained with conventional SWI scans to compare the SWI images obtained in this work, which is subject of current ongoing research.
Conclusion
The results obtained in this work indicate that SWI contrast can be obtained from data obtained for MRE. This provides motivation for further research to compare such data to true SWI images, and to perform studies on a patient cohort.Acknowledgements
References
1. Muthupillai, R. et al. Magnetic resonance elastography by direct visualization of propagating acoustic strain waves. Science 269, 1854–1857; 1995.
2. Mariappan, Y. K., Glaser, K. J. & Ehman, R. L. Magnetic resonance elastography: a review. Clin. Anat. N. Y. N 23, 497–511; 2010.
3. Haacke, E. M., Xu, Y., Cheng, Y.-C. N. & Reichenbach, J. R. Susceptibility weighted imaging (SWI). Magn. Reson. Med. Off. J. Int. Soc. Magn. Reson. Med. 52, 612–618; 2004.
4. Pelc, N. J., Bernstein, M. A., Shimakawa, A. & Glover, G. H. Encoding strategies for three‐direction phase‐contrast MR imaging of flow. J. Magn. Reson. Imaging 1, 405–413; 1991.
5. Yoneda, T. & Hiai, Y. Phase difference enhanced imaging method (PADRE), functional image creating method, phase difference enhanced imaging program, phase difference enhanced imaging apparatus, functional image creating apparatus, and magnetic resonance imaging (MRI) apparatus. US8829902B2; 2014.
6. Murphy, M. C. et al. Decreased brain stiffness in Alzheimer’s disease determined by magnetic resonance elastography. J. Magn. Reson. Imaging 34, 494–498; 2011.
7. Murphy, M. C. et al. Preoperative assessment of meningioma stiffness using magnetic resonance elastography. J. Neurosurg. 118, 643–648; 2013.
8. Balassy, C. et al. Susceptibility-weighted MR Imaging in the Grading of Liver Fibrosis: A Feasibility Study. Radiology 270, 149–158; 2014.
9. Liu, C., Li, W., Tong, K. A., Yeom, K. W. & Kuzminski, S. Susceptibility‐weighted imaging and quantitative susceptibility mapping in the brain. J. Magn. Reson. Imaging 42, 23–41; 2015.
10. Wuerfel, J. et al. MR-elastography reveals degradation of tissue integrity in multiple sclerosis. NeuroImage 49, 2520–2525; 2010.
11. Haacke, E. M. et al. Characterizing iron deposition in multiple sclerosis lesions using susceptibility weighted imaging. J. Magn. Reson. Imaging Off. J. Int. Soc. Magn. Reson. Med. 29, 537–544; 2009.
Figures