0318
Separating intra- and extra-axonal susceptibility effects using a Diffusion-Filtered Asymmetric Spin Echo (D-FASE) sequence1Cardiff University Brain Research Imaging Centre (CUBRIC), School of Psychology, Cardiff, UK, Cardiff, United Kingdom, 2School of Psychology, Faculty of Health Sciences, Australian Catholic University, Melbourne, Australia, 3Sir Peter Mansfield Imaging Centre, School of Physiscs and Astronomy, University of Nottingham, Nottingham, UK, Nottingham, United Kingdom
Synopsis
The investigation of brain white matter is a key area of application of MRI, with much effort focused on using MR techniques to quantify tissue microstructure. Here, we bring together two complementary approaches that are commonly used to probe tissue microstructure (signal dephasing due to: (i) diffusion and (ii) microscopic susceptibility effects) using a novel Diffusion-Filtered Asymmetric Spin Echo (D-FASE) technique. Using D-FASE we can separately assess the evolution of the intra- and extra-axonal signals under the action of susceptibility effects, revealing differences in the behaviour in fibres that are parallel and perpendicular to B0.
Introduction
Recent work has shown that the magnetic susceptibility properties of the myelin sheath produce fibre-orientation-dependent differences in the NMR frequencies and $$$T_2^*$$$ relaxation times of the intra- and extra-axonal signals in white matter1,2,3. Experimental evidence for this behaviour is based on analysis of subtle effects on the evolution of multi-echo gradient-echo signals at late echo-times, when the myelin water signal has decayed away1,2,4,5,6. It is well known that strong diffusion-weighting applied with the gradient direction perpendicular to the fibre orientation can provide strong attenuation of the signal from the extra-axonal space (where diffusion is assumed to be largely hindered), while relatively preserving signal in the intra-axonal space (where the apparent diffusivity is considerably lower)7.
Here, we have implemented a diffusion-filtered asymmetric spin echo (D-FASE) EPI sequence and measured the white matter signal evolution under the simultaneous action of diffusion-filtering and dephasing due to local frequency variations. By exploiting the strong gradients of the Connectom scanner8,9, it was possible to produce the level of filtering needed to selectively suppress the extra-axonal signal, while maintaining a relatively short spin-echo time, thus providing sufficient signal-to-noise ratio to separately assess the evolution of the signals from the intra- and extra-axonal compartments in white matter tracts.
Data acquisition
The D-FASE sequence was produced by combining an asymmetric spin echo EPI acquisition10 with diffusion gradients (Figure$$$\,$$$1(a)), yielding images that are sensitive to dephasing due to both diffusion and microscopic susceptibility effects. Data were collected from four healthy subjects on a Siemens Connectom $$$3\,\mathrm{T}$$$ system using $$$6$$$ acquisition delay times $$$\Delta{}t=[0,~10,~20,~30,~40,~50]~\text{ms}$$$ and $$$4~b$$$-values$$$~=[0,~1200,~2400,~4800]~$$$s/mm$$$^2$$$ with diffusion gradients applied along the superior-inferior, anterior-posterior and left-right directions. Other acquisition parameters remained constant throughout the scanning session (Figure$$$\,$$$1).Data acquisition
Theory
The dependence of the white matter D-FASE signal on the diffusion-weighting $$$b$$$, applied perpendicular to the main fibre direction, and acquisition delay $$$\Delta{}t$$$ is:
$$S(b,\Delta t)\sim{}S_\text{i}(b,\Delta{}t)+S_\text{e}(b,\Delta{}t)\qquad\qquad\qquad\qquad\qquad\qquad\qquad\qquad\qquad\qquad\qquad\qquad\\=\left(f\cdot{}e^{i\omega\Delta{}t}\cdot{}e^{-bD_\text{slow}}+(1-f)\cdot{}e^{-\Delta{}R_2^*\Delta{}t}\cdot{}e^{-bD_\text{fast}}\right)\cdot{}e^{-R_2^*\Delta{}t}\,\,,\quad\qquad\qquad\qquad(1)$$
where $$$\text{i}$$$ and $$$\text{e}$$$ indicate the intra- and extra-axonal compartments, $$$R_2^*$$$ is the transverse rate of decay of the intra-axonal signal, $$$\Delta{}R_2^*$$$ is the difference in the decay rate and $$$\omega$$$ is the angular frequency offset between the two compartments. $$$D_\text{slow/fast}$$$ are the radial apparent diffusivities of the intra- and extra-axonal components, respectively. Diffusion-weighting applied perpendicular to the main fibre direction acts as a $$$D_\text{slow}$$$-pass-filter, and thus allows us to separate out the intra-axonal signal evolution under the action of $$$\Delta{}t$$$.
Data processing
The data were corrected for misalignment due to subject motion and eddy currents11,12 and Gibbs ringing13. A mono-exponential function was fitted to the data for each $$$b$$$-value to visualise the signal evolution with acquisition delay $$$\Delta{}t$$$ and estimate the average $$$R_2^*$$$. The absolute value of the signal from the two-compartment model (Eq.(1)) was fitted to the magnitude data from the corpus callosum for all $$$\Delta{}t$$$ and $$$b$$$-values for AP and SI diffusion directions, simultaneously.Results
Figure$$$\,$$$2 shows the variation of the logarithmically scaled D-FASE signal intensity with acquisition delay $$$\Delta{}t$$$ and $$$b$$$-value. The plots in Figure$$$\,$$$3a,b show signal evolution with $$$\Delta{}t$$$, along with corresponding mono-exponential fitting curves, at each $$$b$$$-value for ROIs in the corpus callosum and corticospinal tract. The boxplots in Figure$$$\,$$$3c demonstrate the distribution of the mean $$$R_2^*$$$ values for both ROIs across subjects. A significant decrease of decay rate with increasing $$$b$$$-values in the fibres perpendicular to $$$\vec{B}_0$$$ (corpus callosum) is seen in contrast to the insignificant change in $$$R_2^*$$$ when the fibres are predominantly parallel to $$$\vec{B}_0$$$ (corticospinal tract). This behaviour, which results from the stronger magnetic susceptibility effects in nerve fibres that are perpendicular to $$$\vec{B}_0$$$ is evident in data from all subjects. Figure$$$\,$$$4 shows the consistency of the mean $$$R_2^*$$$ distribution over the corpus callosum in all subjects at each $$$b$$$-value. Table$$$\,$$$1 shows the results of fitting Eq.(1) to the D-FASE signal evolution in the whole corpus callosum.Discussion
We have shown that the evolution of the extra- and intra-axonal signals under the effect of microscopic field inhomogeneities can be separately probed by using the D-FASE sequence in conjunction with strong gradients. Achieving an absolute perpendicularity of the applied diffusion filter was not necessary to significantly suppress the extra-axonal component, but in future work the effect of fibre dispersion on Eq.(1) could be taken into account. The separation of intra- and extra-axonal susceptibility effects would also benefit from use of the complex signal in the analysis, as the effects of $$$\omega$$$ and $$$\Delta{}R_2^*$$$ on the evolution of the magnitude signal are similar.
Conclusion
We have demonstrated that the additional dimension of signal evolution in the D-FASE sequence, introduced as acquisition delay, is sensitive to differences in the microscopic susceptibility effects on the intra- and extra-axonal compartments. This behaviour has the potential to increase the precision of multi-compartment diffusion models without compromising their accuracy14.Acknowledgements
The data were acquired at the UK National Facility for In Vivo MR Imaging of Human Tissue Microstructure funded by the EPSRC (grant EP/M029778/1), and The Wolfson Foundation. CMWT is supported by a Rubicon grant from NWO. DKJ is supported by a Wellcome Trust Investigator Award (096646/Z/11/Z) and a Wellcome Trust Strategic Award (104943/Z/14/Z).
References
1. Samuel Wharton and Richard Bowtell. Fiber orientation-dependent white matter contrast in gradient echo MRI. Proceedings of the National Academy of Sciences, 109(45):18559– 18564, 2012.
2. Pascal Sati, Peter van Gelderen, Afonso C Silva, Daniel S Reich, Hellmut Merkle, Jacco A de Zwart, and Jeff H Duyn. Micro-compartment specific $$$T_2^∗$$$ relaxation in the brain.NeuroImage, 77:268–278, 2013.
3. Peter van Gelderen, Jacco A de Zwart, Jongho Lee, Pascal Sati, Daniel S Reich, and Jeff H Duyn. Nonexponential $$$T_2^∗$$$ decay in white matter. Magnetic Resonance in Medicine, 67(1):110–117, 2012.
4. Yoonho Nam, Jongho Lee, Dosik Hwang, and Dong-Hyun Kim. Improved estimation of myelin water fraction using complex model fitting. NeuroImage, 116:214 – 221, 2015.
5. Benjamin Tendler and Richard Bowtell. Using frequency difference mapping to assess white matter microstructure in the human corpus callosum. ISMRM 24th Annual Meeting & Exhibition, 2016.
6. Kiran Thapaliya, Viktor Vegh, Steffen Bollmann, and Markus Barth. Assessment of mi- crostructural signal compartments across the corpus callosum using multi-echo gradient recalled echo at $$$7\,\mathrm{T}$$$. NeuroImage, 2017.
7. Yaniv Assaf, Adi Mayk, and Yoram Cohen. Displacement imaging of spinal cord using $$$q$$$-space diffusion-weighted mri. Magnetic Resonance in Medicine, 44(5):713–722.
8. K. Setsompop, R. Kimmlingen, E. Eberlein, T. Witzel, J. Cohen-Adad, J.A. McNab, B. Keil, M.D. Tisdall, P. Hoecht, P. Dietz, S.F. Cauley, V. Tountcheva, V. Matschl, V.H. Lenz, K. Heberlein, A. Potthast, H. Thein, J. Van Horn, A. Toga, F. Schmitt, D. Lehne, B.R. Rosen, V. Wedeen, and L.L. Wald. Pushing the limits of in vivo diffusion mri for the human connectome project. NeuroImage, 80:220 – 233, 2013. Mapping the Connectome.
9. Derek K. Jones, Daniel C. Alexander, Richard Bowtell, Mara Cercignani, Flavio Dell’Acqua, Damien J. McHugh, Karla L. Miller, Marco Palombo, Greg J.M. Parker, Umesh S. Rudrapatna, and Chantal M.W. Tax. Microstructural imaging of the human brain with a ‘super-scanner’: 10 key advantages of ultra-strong gradients for diffusion MRI. NeuroImage, 182:8 – 38, 2018. Microstructural Imaging.
10. Markus N. Streicher, Andreas Schäfer, Dimo Ivanov, Dirk K. Müller, Alexis Amadon, Enrico Reimer, Laurentius Huber, Bibek Dhital, Debra Rivera, Carsten Kögler, Robert Trampel, André Pampel, and Robert Turner. Fast accurate MR thermometry using phase referenced asymmetric spin-echo EPI at high field. Magnetic Resonance in Medicine, 71(2):524–533, 2014.
11. Markus Nilsson, Filip Szczepankiewicz, Danielle van Westen, and Oskar Hansson. Extrapolation-Based References Improve Motion and Eddy-Current Correction of Highb-Value DWI Data: Application in Parkinson’s Disease Dementia. PLOS ONE, 10(11):1– 22, 11 2015.
12. Stefan Klein, Marius Staring, Keelin Murphy, Max A. Viergever, and Josien P. W. Pluim.elastix: A Toolbox for Intensity-Based Medical Image Registration. IEEE Transactions on Medical Imaging, 29(1):196–205, 2010.
13. Elias Kellner, Bibek Dhital, Valerij G. Kiselev, and Marco Reisert. Gibbs-ringing artifact removal based on local subvoxel-shifts. Magnetic Resonance in Medicine, 76(5):1574– 1581, 2016.
14. Dmitry S Novikov, Valerij G Kiselev, Sune N Jespersen. On modeling. Magn Reson Med. 2018;79:3172–3193.
Figures
Figure 1
Data acquision: (a) Diffusion-filtered asymmetric spin echo (D-FASE). In a diffusion-weighted spin echo sequence, acquisition is delayed by $$$\Delta t$$$ relative to RF spin echo to explore dephasing due to both diffusion and susceptibility effects. (b) Scanning parameters. For each $$$\Delta t$$$, diffusion gradients were applied along each of the main radiological axes.
Figure 2
D-FASE data example on a logarithmic scale for the mid-sagittal slice acquired with diffusion weighting applied along anterior-posterior (AP) direction.
Figure 3
Mono-exponential fit to the signal from the ROIs in (a) corpus callosum and (b) corticospinal tract to obtain mean $$$R_2^*$$$ at each $$$b$$$-value. (c) Distribution of mean $$$R_2^*$$$ values across subjects at each $$$b$$$-value is compared between both ROIs. The dependence of mean $$$R_2^*$$$ on fibre orientation and diffusion gradient strength is evident.
Figure 4
Mean $$$R_2^*(b)$$$ distribution in the corpus callosum obtained from the mono-exponential fit to the data at each $$$b$$$-value is shown for all subjects. The reduction of the mean $$$R_2^*$$$ with increasing $$$b$$$ hints at there being a slower decaying intra-axonal $$$R_2^*$$$ component. Mean $$$R_2^*(b)$$$ distribution in the corpus callosum obtained from the mono-exponential fit to the data at each $$$b$$$-value is shown for all subjects. The reduction of the mean $$$R_2^*$$$ with increasing $$$b$$$ hints at there being a slower decaying intra-axonal $$$R_2^*$$$ component.
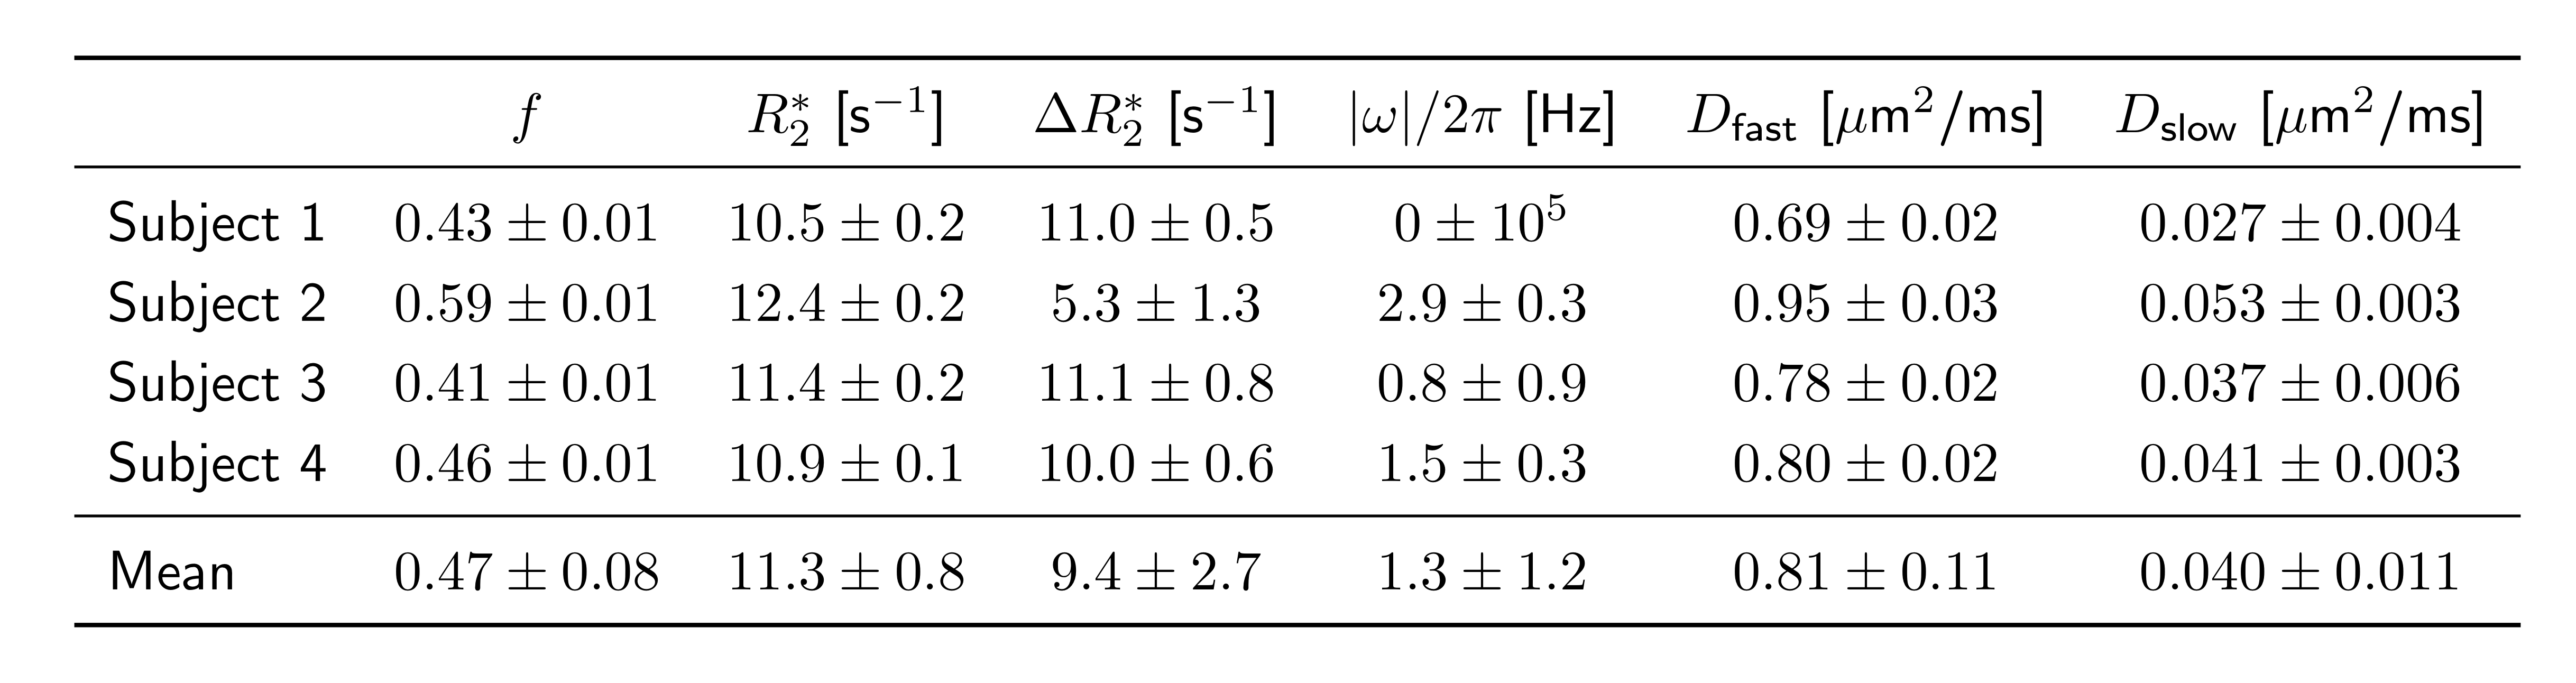
Table 1
Fitting results for the free parameters in Eq.(1): intra-axonal signal fraction $$$f$$$; intra-axonal relaxation rate $$$R_2^*$$$; apparent diffusivities $$$D_\text{slow}$$$ and $$$D_\text{fast}$$$ correspond to diffusivities of intra- and extra-axonal compartments, respectively; relaxation rate difference $$$\Delta R_2^*$$$ and frequency offset $$$\omega$$$ between intra- and extra-axonal compartments.