0317
On the linearity of deep neural network trained QSM1Department of Electrical and Computer Engineering, Seoul National University, Seoul, Korea, Republic of, 2Department of Radiology, Gachon University, Incheon, Korea, Republic of
Synopsis
In this work, the linearity property of a recently proposed neural network-based QSM is explored. The QSMnet, which was trained using healthy volunteers, was quantitatively evaluated for patients with hemorrhage whose susceptibility values were outside of the trained range. The results showed that the QSMnet underestimated the susceptibility in hemorrhage, breaking linearity between true susceptibility and QSMnet-generated susceptibility. To overcome this limitation, we developed a linear scaling method that generalized the network for a wider range of susceptibility. The new network successfully reconstructed the patient data with good linearity results.
Introduction
Quantitative susceptibility mapping (QSM) is a quantitative approach to measure magnetic susceptibility.1 Recently, dipole inversion in the QSM reconstruction was implemented using a deep neural network, generating a gold standard COSMOS-quality QSM map.2 This network, QSMnet, was trained by healthy volunteers and, therefore, may suffer from generalization when applying it to patients. To address this issue, we explored the scaling or linearity property of the QSMnet. Furthermore, we proposed a new data augmentation method to improve the linearity of the network. The method was evaluated by hemorrhage patients.Methods
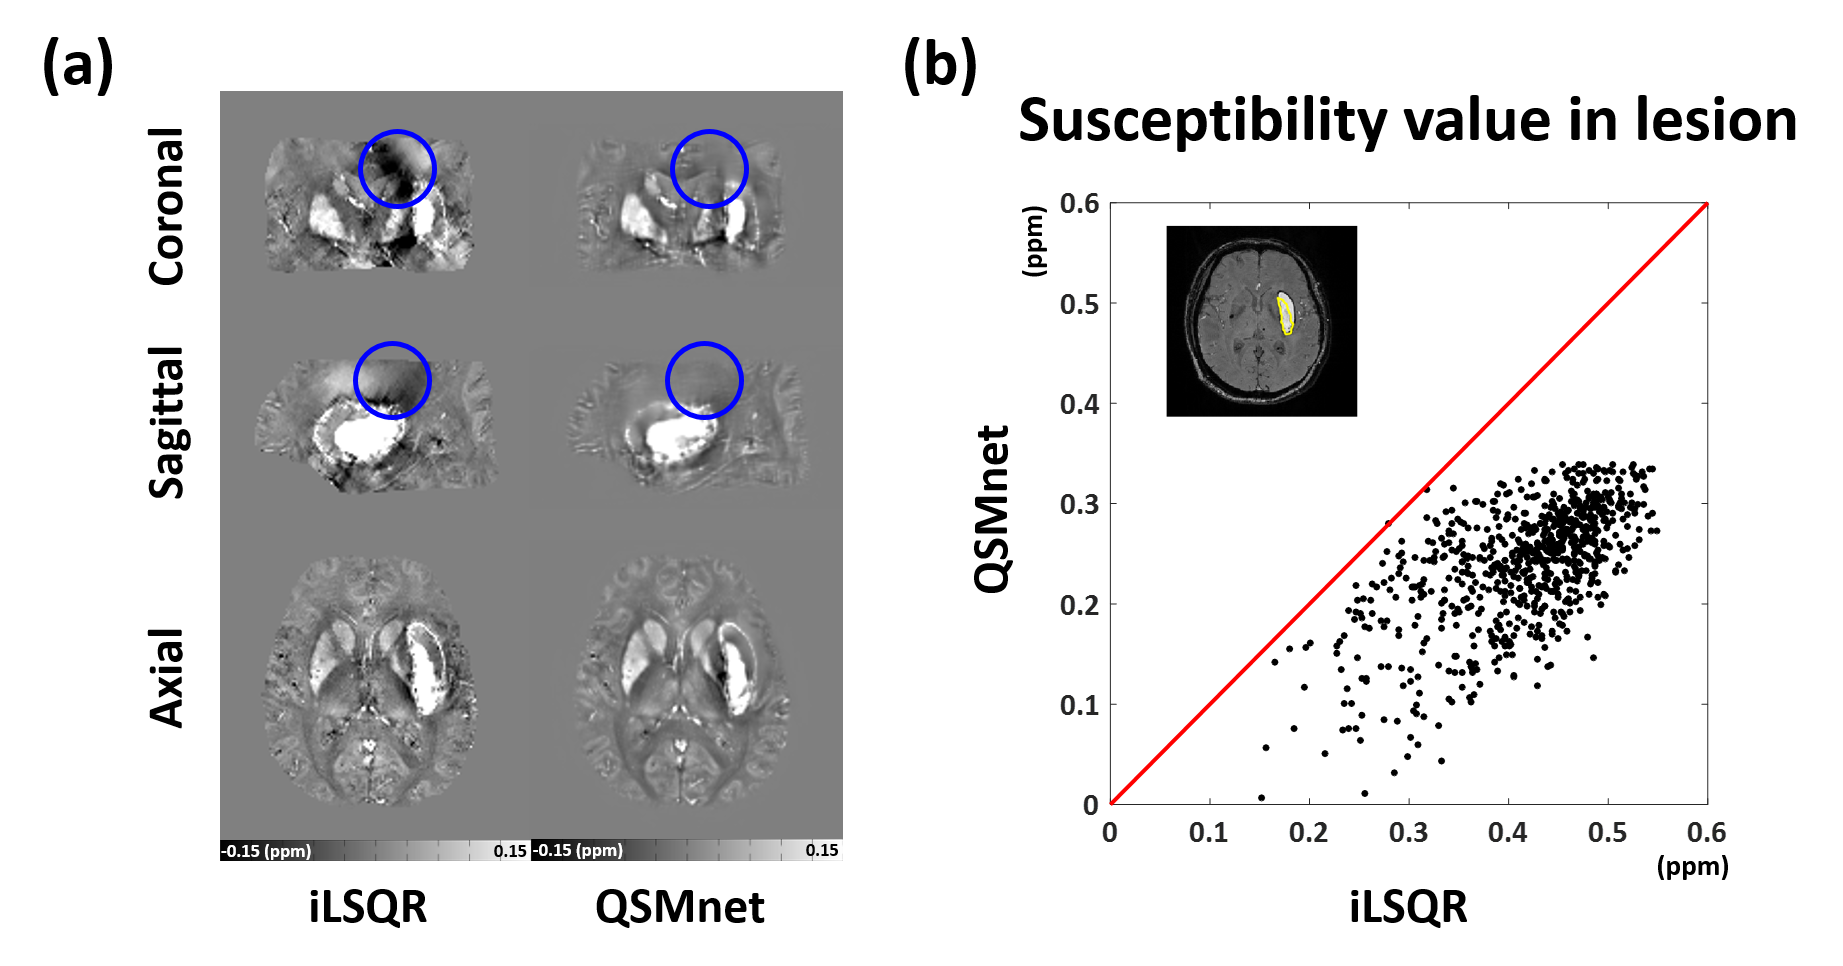
[Linearity of QSMnet] To explore the linearity of the QSMnet, a patient with a large hemorrhage, which was expected to have a larger range of susceptibility than healthy tissues, was scanned. The data were reconstructed by iLSQR and QSMnet. An ROI was drawn for the lesion. The susceptibility measurements were compared assuming the iLSQR results as true susceptibility.
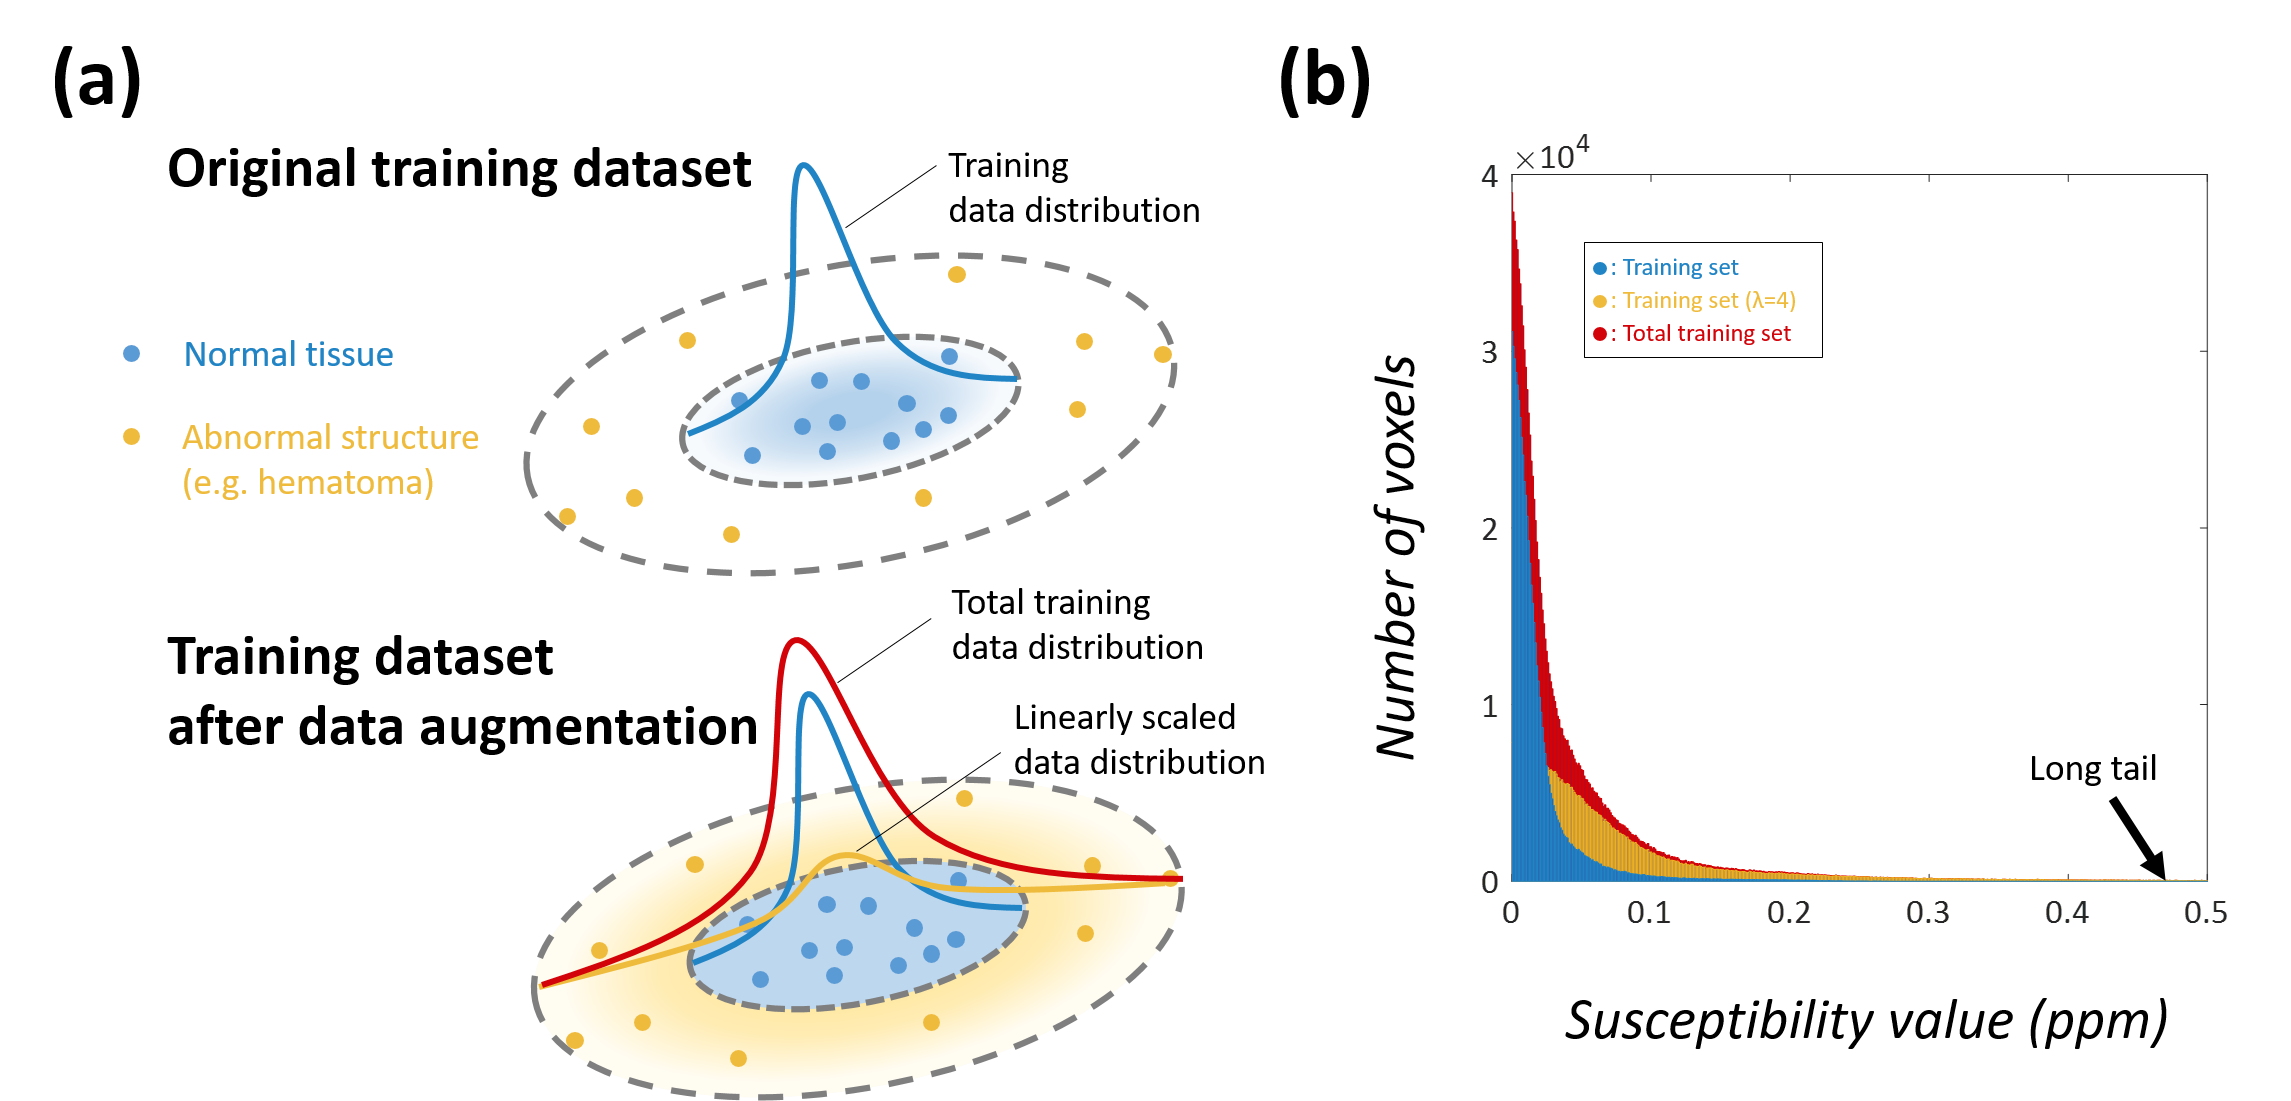
[Data augmentation for generalization] In deep learning, data augmentation improves generalization of the network if the augmented data is in the vicinity of the original data distribution3,4. To expand the linearity of the network, we defined a vicinal distribution (ν) as follows
$$\nu(\widetilde{x},\widetilde{y}|x_{i},y_{i})=\delta(\widetilde{x}=\lambda x_{i},\widetilde{y}=\lambda y_{i})$$
where $$$(x_{i},y_{i})$$$ is a training pair, $$$(\widetilde{x},\widetilde{y})$$$ is a augmentation pair, $$$\delta(\widetilde{x}=x,\widetilde{y}=y)$$$ is a Dirac mass centered at $$$(x,y)$$$ and a linear scaling factor $$$\lambda$$$ (Fig. 1a).
[QSMnet augmentation] To explore the effect of the linear scaling, three different augmentation datasets ($$$\lambda$$$ = 2, 3, and 4) were generated using the training datasets of the QSMnet. Then, three new QSM networks (refer to as QSMnet×λ) were generated by training both original training dataset and one of the linearly scaled augmentation dataset.
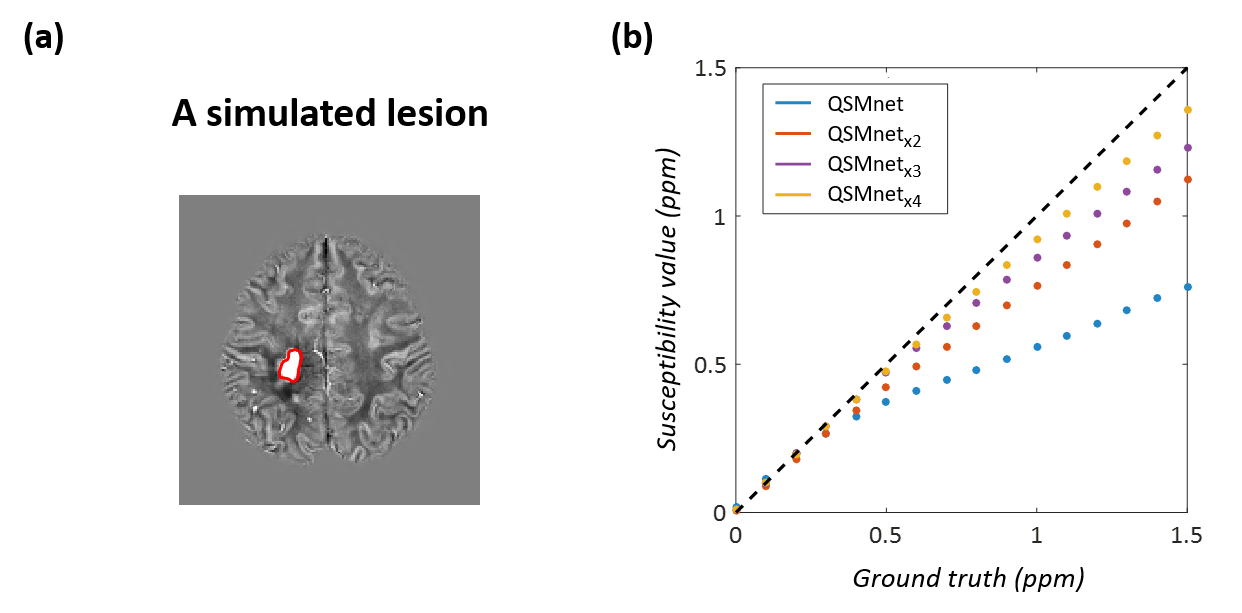
[Simulation] To evaluate the augmentation results, a simulated lesion with uniform susceptibility was introduced in a QSM map. From this map, a local field map was generated and susceptibility maps were reconstructed using the QSMnet and its variants (i.e. QSMnet×2, …). The simulation was repeated 16 times for the lesion susceptibility value from 0 to 1.5ppm (step: 0.1ppm).
[Experiments] Thirteen hemorrhage patients were scanned at 3T. The GRE data were acquired (voxel size=1x1x1mm3, and TR/TE=33/25ms). The data were reconstructed using MEDI5, iLSQR6, QSMnet and its variants. In each patient, the lesion was segmented for an ROI analysis. To demonstrate that the linear scaling did not undermine the healthy volunteer results, five healthy volunteer datasets in [2] were processed using the new networks. The quantitative metrics were measured and ROI analysis was performed as described in [2].
Results
When the patient with a large hemorrhage is reconstructed using iLSQR and QSMnet, the QSMnet map shows superior image quality with little streaking artifacts (Fig. 2a). In the lesion, however, the susceptibility values of the QSMnet are lower than those of the iLSQR (Fig. 2b), suggesting limited linearity of the QSMnet for untrained susceptibility values.
This issue of the linearity and improvement using the data augmentation are demonstrated in the simulated lesion study shown in Fig. 3. When the susceptibility values of the simulated lesion are compared with the ground truth (Fig. 3b), the data-augmented networks with the wider range of augmentations (e.g. QSMnet×4) show better linearity than the original QSMnet, confirming the need for the proposed data augmentation to improve the linearity of the QSMnet.
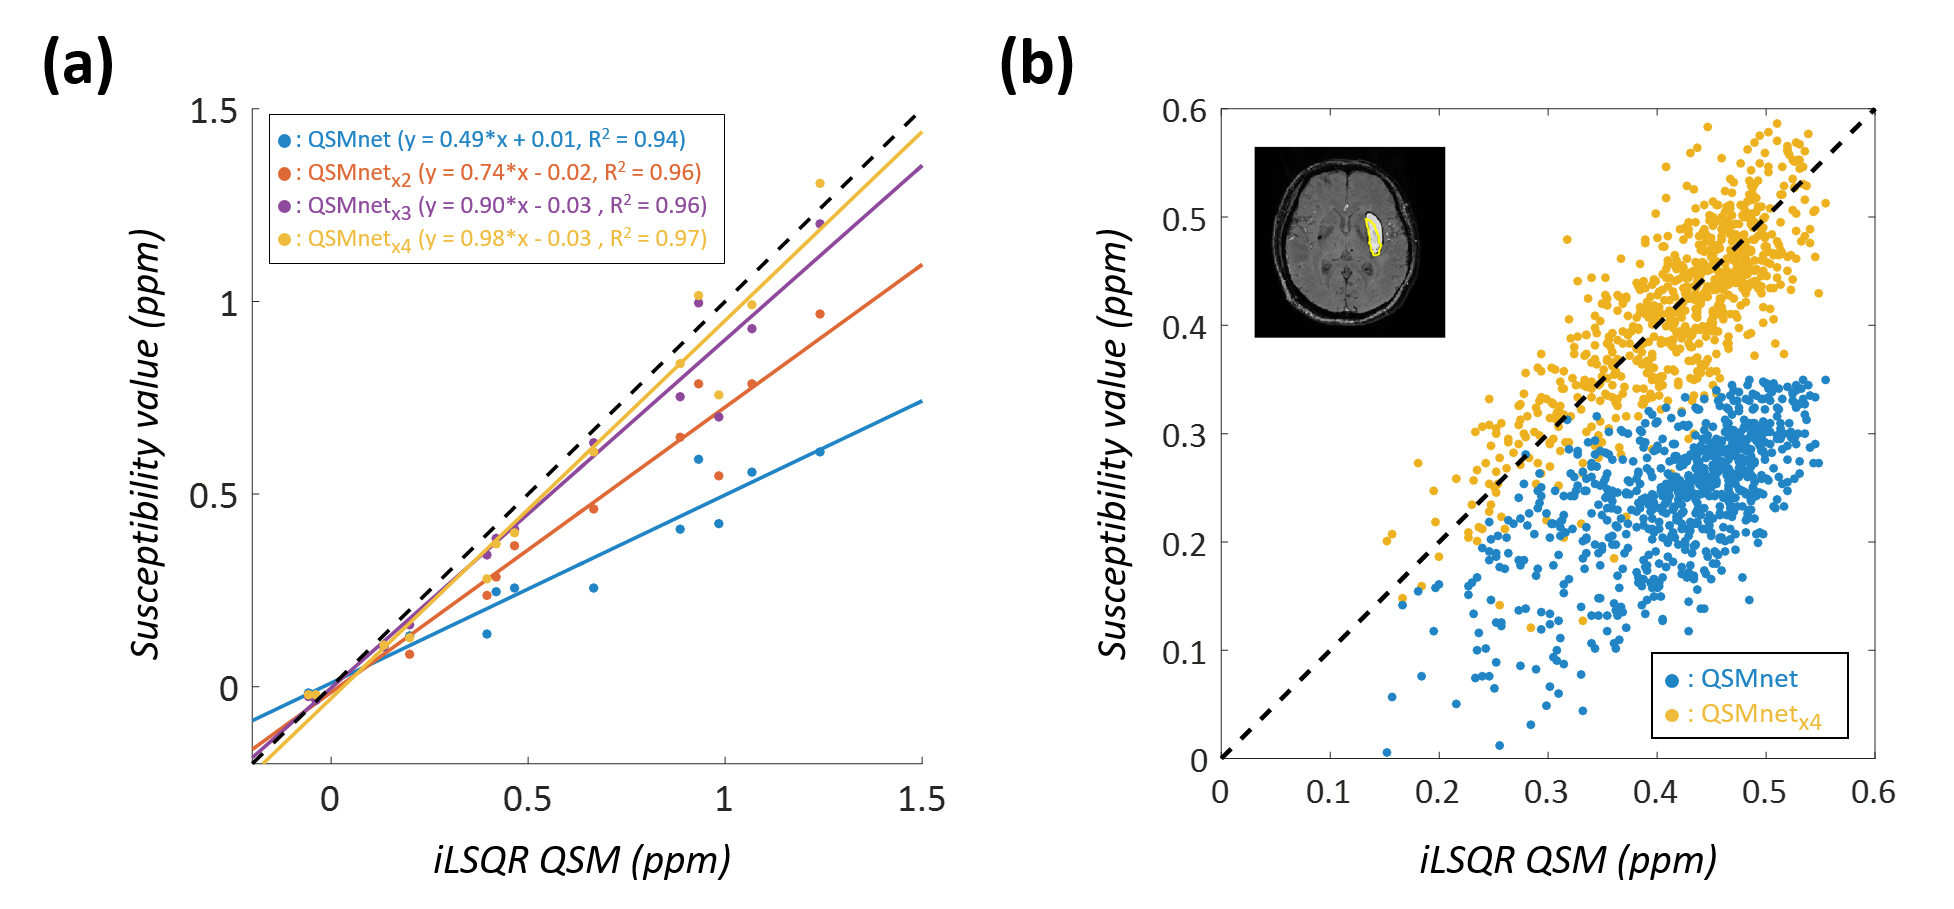
When the networks are applied to the hemorrhage patients, the same trends as in the simulated results are observed, revealing the best linearity result for the QSMnet×4 (Fig. 4). The underestimated lesion susceptibility values from the QSMnet (shown in Fig. 2b) are successfully corrected when the QSMnet×4 is applied (Figure 4b).
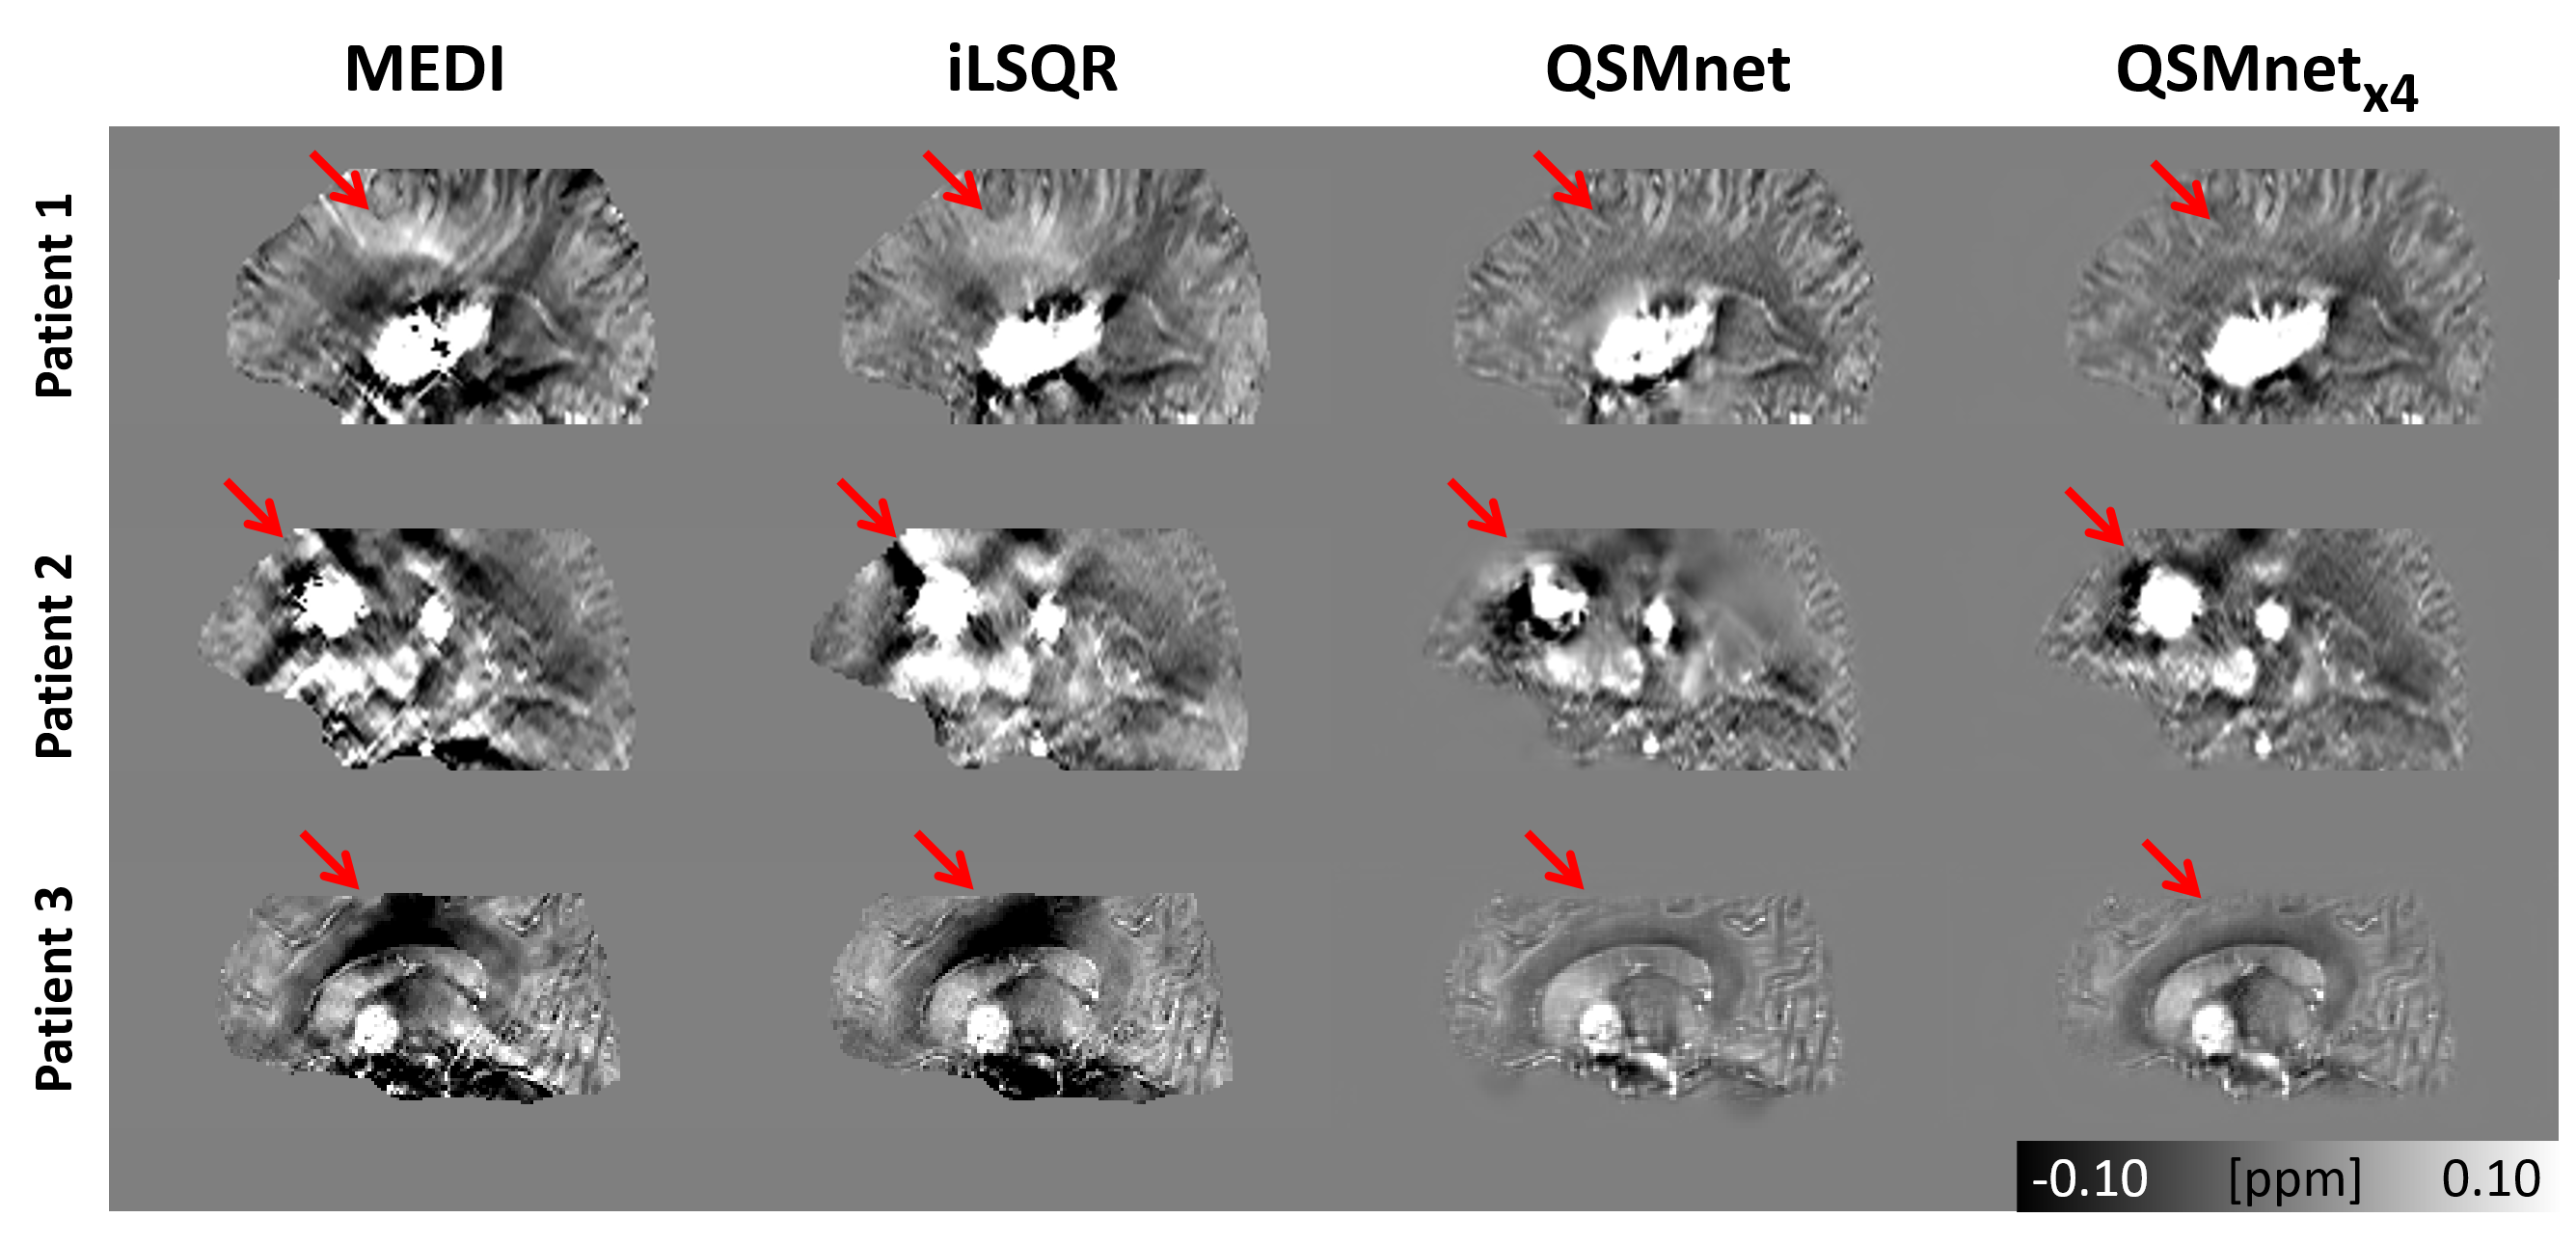
Figure 5 shows the QSM maps from three hemorrhage patients reconstructed by MEDI, iLSQR, QSMnet and QSMnet×4. As shown in the red arrows, streaking artifacts are clearly observed in the MEDI and iLSQR maps but are less obvious in the QSMnet and QSMnet×4 maps.
When the healthy subjects are reconstructed by the QSMnet and its variants, the quantitative metrics and ROI analysis show consistent results across the networks (results are not shown due to word/figure limits). These results confirm that the proposed data augmentation did not deteriorate the healthy subject results.
Discussion and Conclusion
In this study, we proposed a linear scaling method for data augmentation to improve the linearity of the QSMnet. The method generalized the network to work for a wider range of susceptibility values, covering both healthy subjects and hemorrhage patients. Moreover, the QSMnet×4 covered the susceptibility range of 1.5 ppm, which is the susceptibility of fully deoxygenated blood.7 Hence, the network may provide an accurate estimation of susceptibility for most of the hemorrhage patients.Acknowledgements
This research was supported by NRF- 2018R1A2B3008445 and Brain Korea 21 Plus Project in 2018References
[1] Wang, Yi, and Tian Liu. "Quantitative susceptibility mapping (QSM): decoding MRI data for a tissue magnetic biomarker." Magnetic resonance in medicine 73.1 (2015): 82-101.
[2] Yoon, Jaeyeon, et al. "Quantitative susceptibility mapping using deep neural network: QSMnet." NeuroImage (2018).
[3] Chapelle, Olivier, et al. "Vicinal risk minimization." Advances in neural information processing systems. 2001.
[4] Zhang, Hongyi, et al. "mixup: Beyond empirical risk minimization." arXiv preprint arXiv:1710.09412 (2017).
[5] Liu, Jing, et al. "Morphology enabled dipole inversion for quantitative susceptibility mapping using structural consistency between the magnitude image and the susceptibility map." Neuroimage 59.3 (2012): 2560-2568.
[6] Li, Wei, et al. "Integrated Laplacian‐based phase unwrapping and background phase removal for quantitative susceptibility mapping." NMR in Biomedicine 27.2 (2014): 219-227.
[7] Jain, Varsha, et al. "Investigating the magnetic susceptibility properties of fresh human blood for noninvasive oxygen saturation quantification." Magnetic resonance in medicine 68.3 (2012): 863-867.
Figures