0313
Towards robust – and accurate – QSM in cortical and sub-cortical regions of the human brain at 9.4T: the influence of masking1Biomedical Magnetic Resonance, University Hospital Tübingen, Tübingen, Germany, 2High Field Magnetic Resonance, Max Planck Institute for Biological Cybernetics, Tübingen, Germany, 3Psychiatry and Psychotherapy, University Hospital Tübingen, Tübingen, Germany, 4Max Planck Institute for Biological Cybernetics, Tübingen, Germany, 5Neurology and Epileptology, Hertie Institute for Clinical Brain Research, Tübingen, Germany, 6Neuropsychology, Hertie Institute for Clinical Brain Research, Tübingen, Germany
Synopsis
Quantitative susceptibility mapping (QSM) targets a fundamental MR-parameter but is problematic due to the presence of a strong background and local field variations. These may cause multiple phase wraps which are particularly prominent at high fields and long echo-times. We propose automated tissue masking excluding brain areas with excessive phase wraps and show how this approach can improve the quality of QSM. Performance was evaluated with regard to iron quantification in subcortical and cortical areas, and was compared with R2* maps in the same 21 subjects aged 19-56y and literature values.
Introduction
Quantitative susceptibility mapping (QSM) is hampered due to strong background field variations, therefore the product of the echo time and field is usually kept below 70ms·Tesla1. To achieve the high resolution at ultra-high fields, it may be difficult to remain within this limit. Here we investigate the quality of QSM in terms of accuracy and precision that could be achieved with multi-echo data at 9.4T, in comparison with literature data and R2* mapping of the same subjects to evaluate iron quantification.Subjects and Methods
Subjects (19-56y N=21) volunteering to participate
in the ERB approved study were scanned at 9.4T (Siemens Germany) with a 16ch
transmit/31ch receive array2.
The transmit field was mapped with AFI3
to acertain nominal flip angle in sub-cortical areas. Mono-polar
multi-echo-GRE-images (TE=6:6:30ms; TR=35ms; nominal
FA=11°; voxel=400x400x800μm; GRAPPA=2; PF=6/8; BW=240Hz) were used for QSM and MP2RAGE images (TI1/TI2=900/3500ms; FA=4/6°; TRGRE=6ms; TR=8894ms,
0.8mm isotropic voxels) for tissue segmentation and DARTEL–based
adaptation (SPM12) of the Automatic Anatomical Labelling (AAL) and the Harvard-Oxford
region-of-interest atlases in MNI space brought to native space images.
Single-channel GRE-images were adaptively combined
after phase offset correcting the third echo (TE=18ms) using the first two echo-images4.
Laplacian phase unwrapping5 and background subtraction using RESHARP6,
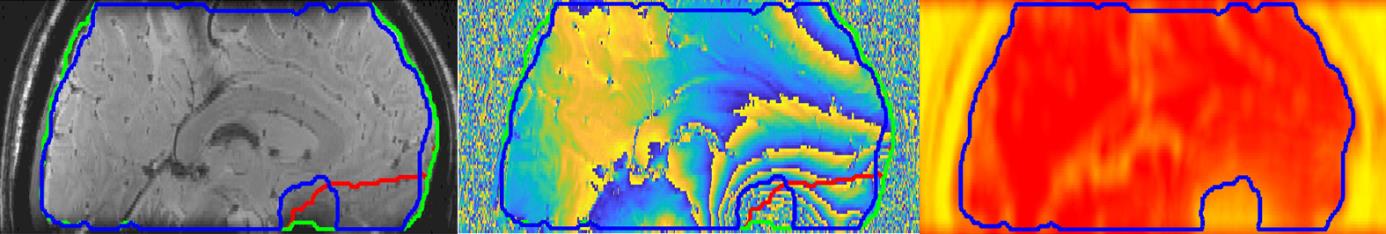
Tikhonov regularization of 10-3-10-12; or V-SHARP5 (SMV2-20 mm) were used. Three different masks
(Fig1) based on the signal in magnitude images only (MM); or after additionally
removing either all voxels with excessive phase wrapping (PB) or voxels in the region-of-interest
‘Rectus’ from AAL (noR) were generated. MM was obtained using BET in FSL, cut-off=0.1
followed by smoothing with a Gaussian filter with a FWHM 4 times the voxel-size.
For PB, the absolute value of the Laplacian of the sign function was convolved
with a sphere of size 5, and only voxels with values < 500 were retained. For
noR the rectus AAL region was expanded and removed from the mask. The QSM maps
were generated by the iterative least squares approach7.
This pipeline was tested on the QSM challenge data set8
but including background correction which yielded RSME values of 80.5(Tk-12MM) 80.4(Tk-12PB), and 82.6(SMV12MM) and HFEN of 74.9, 75.0, and 74.8,
respectively. QSM values in different Harvard-Oxford atlas regions were
extracted from cortical voxels with a GM probability >98% while no such
additional condition was used for the subcortical regions. Expected iron
concentrations were calculated from Ref9.Results and Discussion
The PB masks identified regions with excessive
phase variations in the frontal region (Fig1). For QSM, the typical L-curve
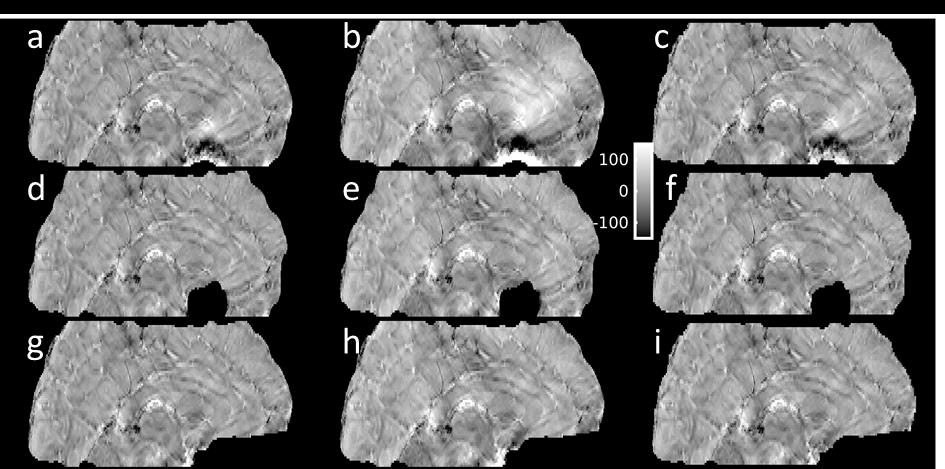
was observed with optimal settings at Tk-12 and SMV12. The traditional MM mask worked
well in case of high regularization and small SMV filters, (Fig2 a-c), while
lower regularization relied on adequate masking using PB or noR (Fig2 b,e,h).
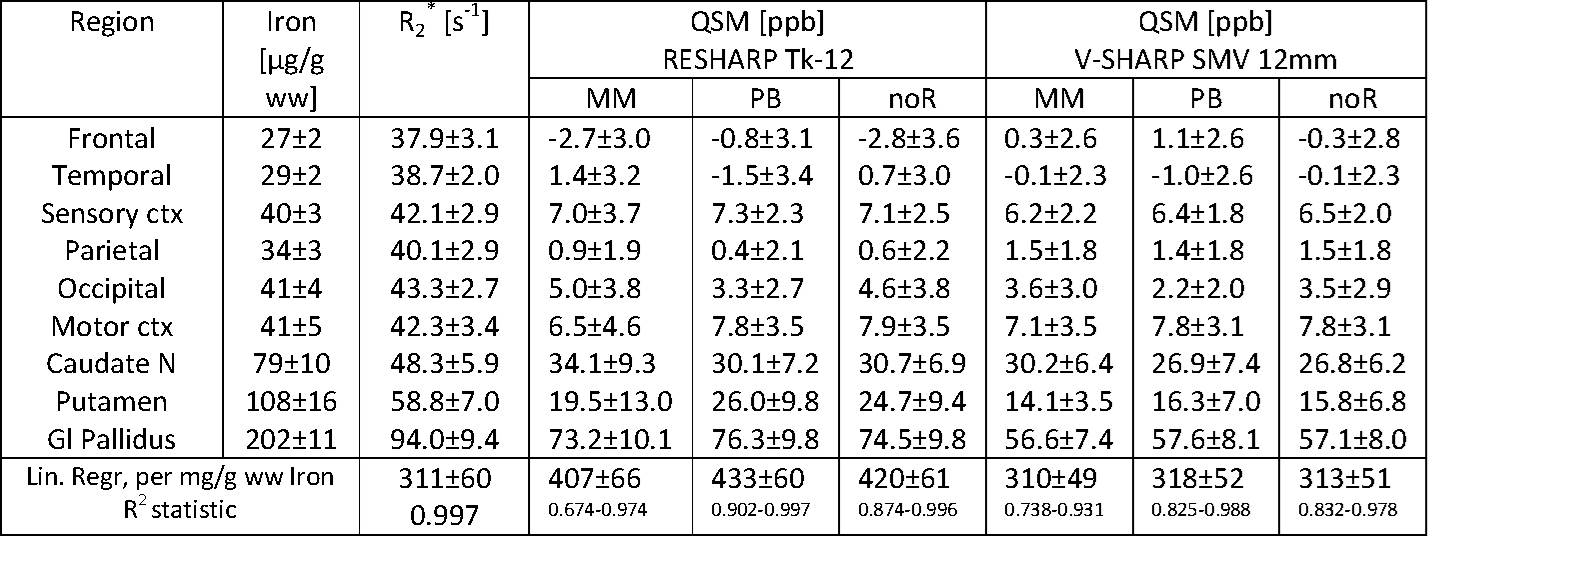
The lowest coefficient of variation (standard deviation divided by the average
across subjects) was found using Tk-12PB in the Globus Pallidus (13%) while in
the cortex this figure was at least more than twice as high (28%) obtained by
SMV12PB in S1. QSM
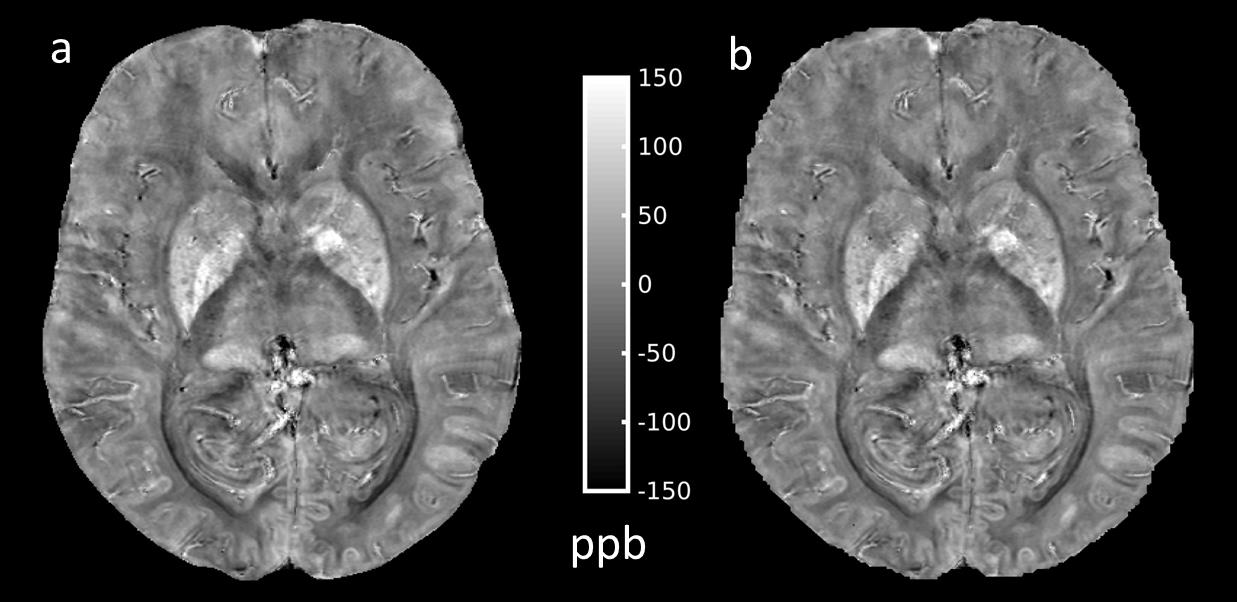
at the level of the basal ganglia was similar across all masks and for both background removal methods,
although RESHARP retained more voxels on the brain surface than V-SHARP(Fig3),
as expected for regions close to the border of the mask10.
RESHARP was more robust than V-SHARP in this respect yielding a smaller
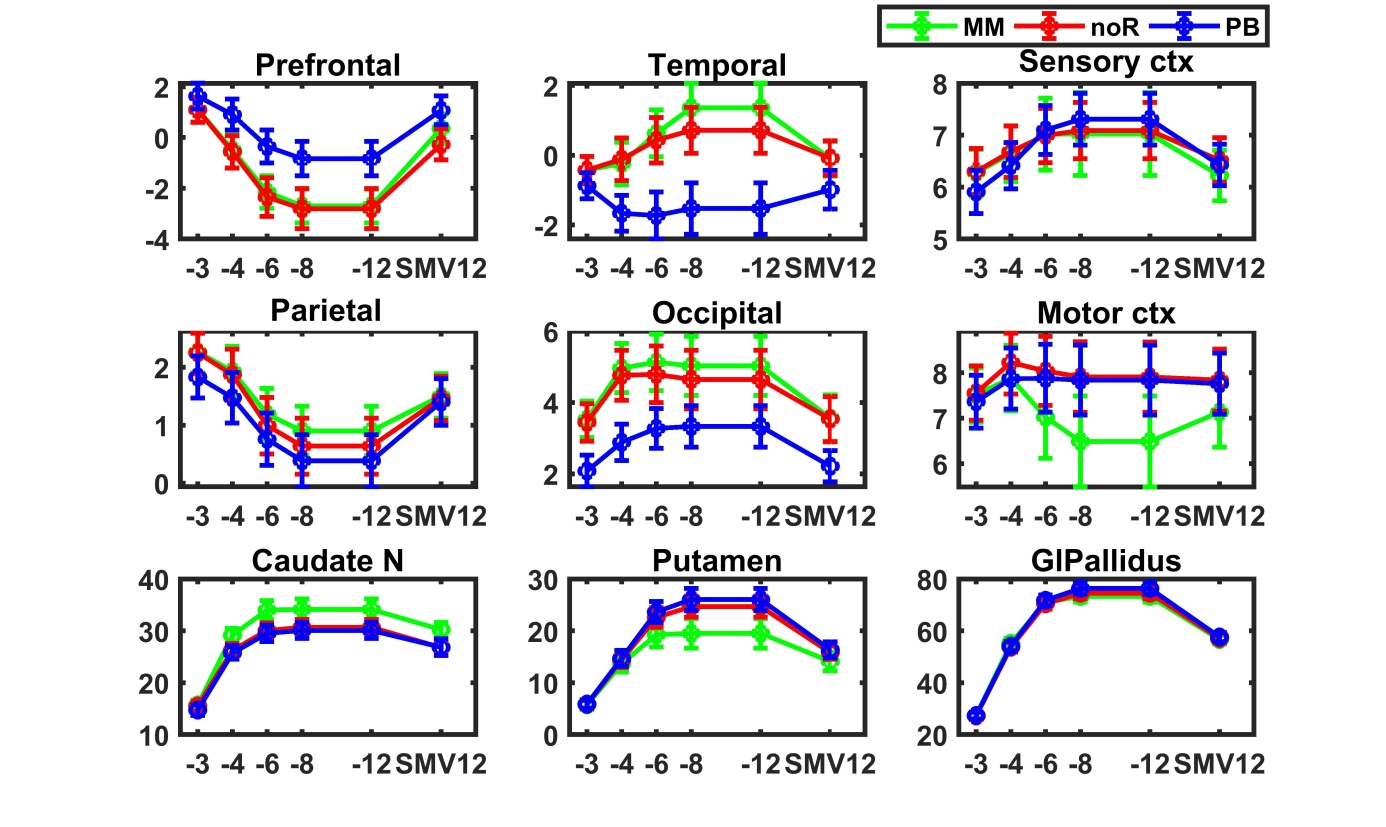
discrepancy between the different masks (Table1), except for the motor cortex
where the MM failed to yield plausible values in view of its relatively high
iron content (Fig4).
The
relation between estimated iron and QSM values differed between RESHARP and
V-SHARP and also slightly between masks. The highest regression coefficient
was found for Tk-12PB, yielding 0.430 ppb per µg/kg iron,
which also had the best goodness-of-fit performance. Nevertheless, this value
is at the low end of previous observations11.
We explain this result by our long echo time and high magnetic field, causing a
diffusion averaging similar to what is usually observed for R2*. Indeed our
change in R2* with increasing iron corresponds to previous studies11
as well as our iron-induced change in QSM.Conclusion
We found a substantial improvement in accuracy and precision of QSM in high-field applications at long echo times through masking, targeting brain areas with excessive phase evolution.Acknowledgements
Funding from EULAC-HEALTH T01-0118 is gratefully acknowledgedReferences
[1] Haacke EM et al., Magn reson Imag 33 1-25 (2015)
[2] Shajan G, Kozlov M, Hoffmann J, Turner R, Scheffler K, Pohmann R. A 16-channel dual-row transmit array in combination with a 31-element receive array for human brain imaging at 9.4 T Magn Reson Med. 2014;71(2):870-9.
[3] Yarnykh, V.L., 2007. Actual flip‐angle imaging in the pulsed steady state: a method for rapid three‐dimensional mapping of the transmitted radiofrequency field. Magnetic resonance in medicine 57, 192-200.
[4]Robinson SD, Bredies K, Khabipova D, Dymerska B, Marques JP, Schweser F. An illustrated comparison of processing methods for MR phase imaging and QSM: combining array coil signals and phase unwrapping. NMR Biomed. 2017;30(4).
[5] Li W, Wu B, Liu C. Quantitative susceptibility mapping of human brain reflects spatial variation in tissue composition, NeuroImage. 2011; 15; 55:1645
[6] Sun, H., Wilman, A.H., 2014. Background field removal using spherical mean value filtering and Tikhonov regularization. Magnetic resonance in medicine 71, 1151-1157
[7] Li W, Wu B, Liu C. Quantitative susceptibility mapping of human brain reflects spatial variation in tissue composition, NeuroImage. 2011; 15; 55:1645
[8] Langkammer C, Schweser F, Shmueli K, Kames C, Li X, Guo L, Milovic C, Kim J, Wei H, Bredies K, Buch S, Guo Y, Liu Z, Meineke J, Rauscher A, Marques JP, Bilgic B. Quantitative susceptibility mapping: Report from the 2016 reconstruction challenge.Magn Reson Med. 2018;79(3):1661-1673.
[19 Hallgren B and Sourander P. J Neurochem. 1958;3(1):41-51
[10] Schweser F, Robinson SD, de Rochefort L, Li W, Bredies K. An illustrated comparison of processing methods for phase MRI and QSM: removal of background field contributions from sources outside the region of interest. NMR Biomed. 2017;30(4).
[11] Duyn JH, Schenck J. Contributions to magnetic susceptibility of brain tissue. NMR Biomed. 2017;30(4):e3546
Figures