0309
Magnetization transfer (MT) of human brain at 7T in the context of a 3D multi-parameter mapping protocol1Clinical Sciences Lund, Medical Radiation Physics, Lund University, Lund, Sweden, 2Philips Danmark A/S, Philips Healthcare, Copenhagen, Denmark, 3National 7T Facility, Lund University, Lund, Sweden, 4Centre for Medical Imaging and Physiology, Skåne University Hospital, Lund, Sweden, 5Clinical Sciences Lund, Department of Radiology, Lund University, Lund, Sweden
Synopsis
3D multi-gradient echo MRI can be used to estimate T1, T2*, PD and the magnetization transfer (MT), which is increasingly used for multi-parametric mapping (MPM) of human brain. The increased polarization at 7T compared to lower B0 allows for increased spatial resolution or reduced scan times. However, SAR restrictions imposed on the MT pulse and B1 inhomogeneity pose challenges. In this work, we propose a protocol for MPM of human brain at 7T with special attention paid to eliminating bias when mapping MTsat while obtaining submillimeter isotropic spatial resolution in under 12 minutes with acceptable SNR.
Introduction
3D multi-gradient echo MRI is a versatile and quick method to estimate maps of tissue parameters such as T1, T2*, proton density (PD) and magnetic susceptibility. At clinical field strengths, B0, the method is also used to quantify magnetization transfer (MT)1 or to calculate the MT saturation, MTsat, using a dual flip angle (DFA) experiment2. MT contrast is evoked by applying a high-energy off-resonance saturation pulse prior to excitation. The average RF power may be curtailed by SAR limits, especially at 7T.
At 3T, gradient-echo (GRE) multi-parametric mapping (MPM) for quantitative structural MRI of the human brain takes about 20 mins3, but requires accurate flip angle mapping to account for B1+ inhomogeneity. The higher polarization at 7T will allow for increased spatial resolution or reduction of the scan time by parallel imaging. In addition, the T2* contrast increases with B0.
Based on an established 3T protocol, we optimized MPM of human brain at 7T with special attention paid to elimination of bias in MTsat.
Methods
Healthy adult subjects were scanned on a 7T Philips Achieva MR system (Philips Healthcare, Best, NL), using a dual-channel transmit head coil with 32 receive elements (Nova Medical, Wilmington, MA) after giving informed written consent. Eight sagittal non-selective volumes were acquired from bipolar gradient echoes at 670 Hz/px bandwidth. The minimum TE=1.97 ms and maximum TE=15.76 ms (equidistant, fat water in-phase) yielded TR=18 ms without the MT pulse, and 2x SENSE4 was applied in both phase encoding directions. The optimization procedure followed the following main steps:
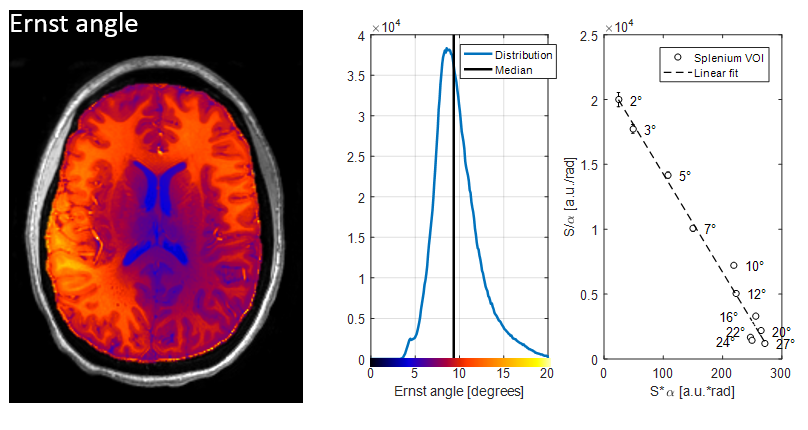
1. The “block” excitation RF pulse was replaced by an asymmetric sinc pulse to reduce the sensitivity to the increased B0-inhomogeneity at 7T. To determine the flip angles used in DFA, the flip angle, α, was varied from 2° to 27° (Figure 1).
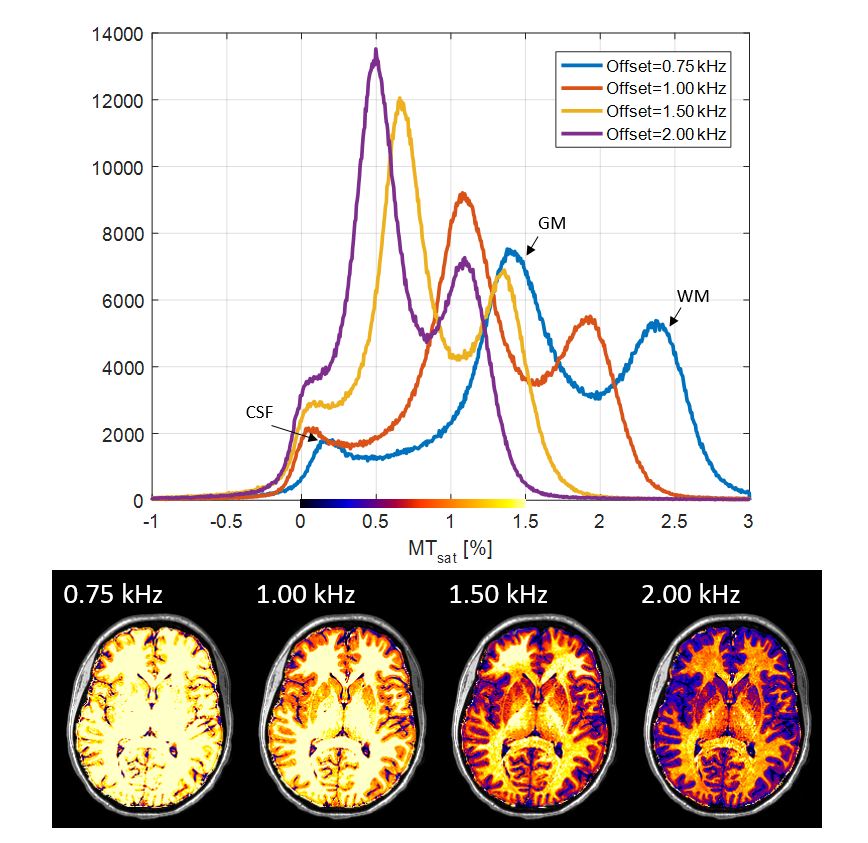
2. A main-lobe sinc pulse of 4 ms duration was used for MT saturation. The SAR limit was reached at a saturation α of about 180° at TR=28 ms. The frequency offset was varied from 0.75 kHz to 2.00 kHz (Figure 2).
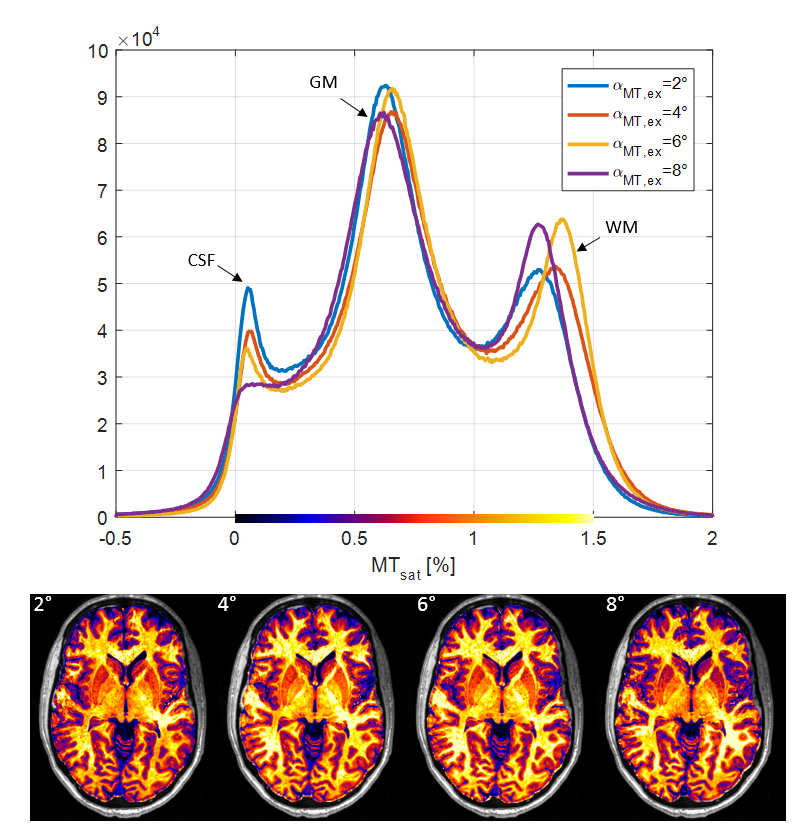
3. The excitation α of the MT-weighted (MT-w) sequence was varied from 2° to 8° (Figure 3).
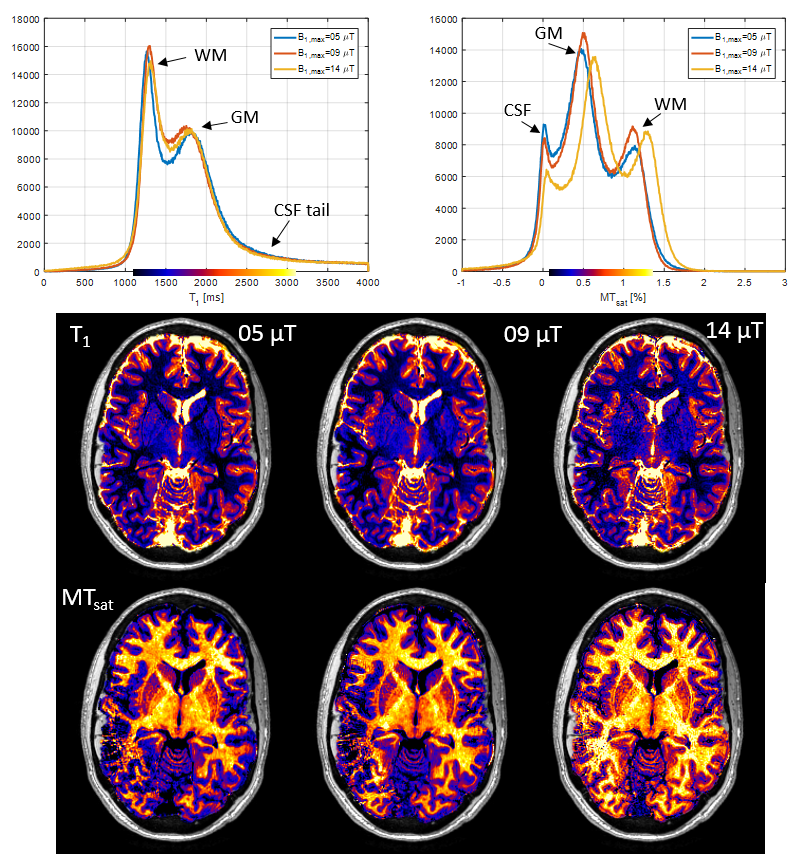
4. The maximum B1+ amplitude of the excitation pulse was varied, using 5, 9, and 14 μT (Figure 4).
Flip angle mapping was performed using DREAM5 and B1+ bias in the PD, T1, and MT maps were corrected for post-hoc3. Pixel intensities were scaled to physical signal (in [a.u.]). Post-processing and evaluation were performed in MATLAB R2016a using the hMRI toolbox6.
Results
1. A linear plot of the VFA signal revealed the Ernst angle and incomplete spoiling at α>20° (Figure 1). Thus, α for DFA was chosen as 4° (PD-w) based on the median Ernst angle and 18° (T1-w) to avoid spoiling bias7,8.
2. Direct saturation was seen with MT pulses of lower frequency offsets below 2.00 kHz and the offset were thus set to 2.00 kHz (Figure 2).
3. Consistent MT maps were observed at flip angles below 8°, except for broadening of the CSF peak (Figure 3). The excitation flip angle was set to 4° to keep the free water saturation smaller than MTsat analogous to ref., 2, while still attaining acceptable SNR.
4. Peak B1+ amplitude affected T1 and MTsat, with increasing inhomogeneity of T1 and overestimation of MTsat (Figure 4). Hence, a maximum B1+ of 5 μT was chosen.
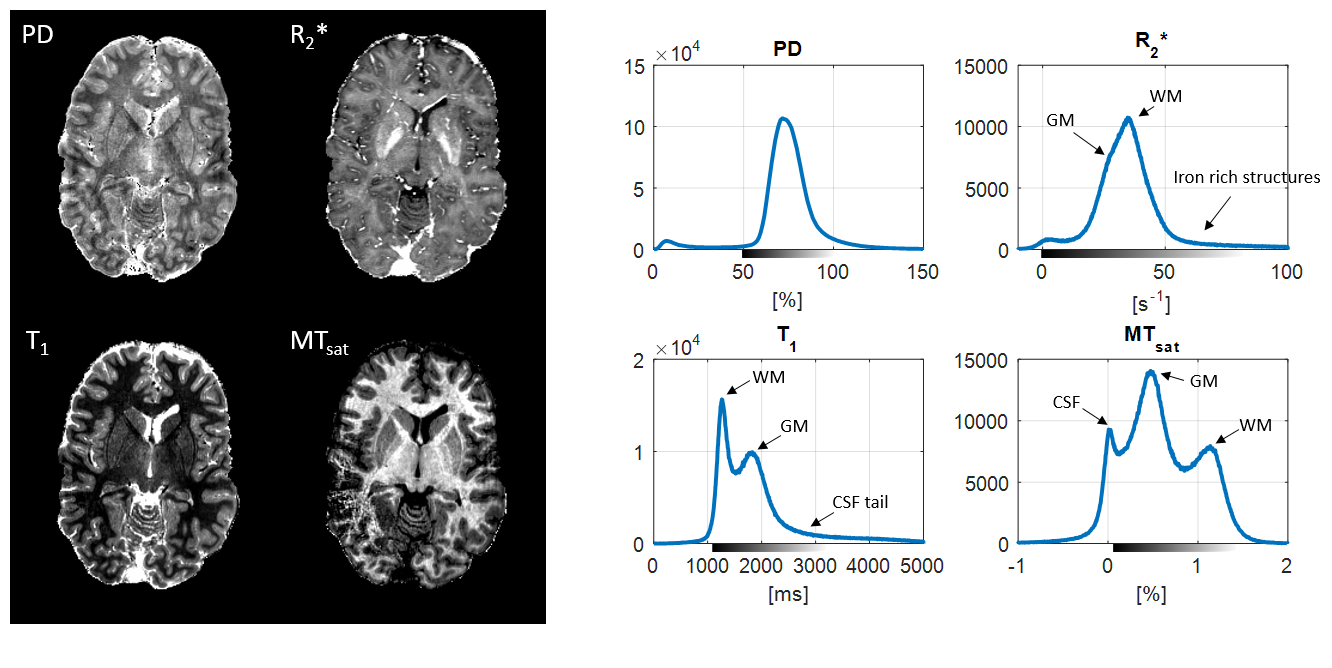
With this optimized 7T protocol, multi-parameter maps of 0.9 mm isotropic resolution are obtained in 10-12 mins depending on FoV ( Figure 5). MTsat exhibits a high GM-WM contrast, especially in deep brain, but requires correction of residual B1+ inhomogeneities2.
Discussion
Aiming at reducing bias in the semi-quantitative MTsat maps, we optimized a GRE-based MPM protocol at 7T. Limitations of average power by SAR were met by reducing the energy of the MT pulse and a moderately longer TR3. This led to lower semi-quantitative MTsat values, despite being corrected for T1. Contrary to 3T2, the calculated MTsat at 7T deviated distinctly at high and low B1+ (data not shown) and this was corrected post hoc using a B1+ map3. T1 values agreed with literature9 but suffered from unwanted MT effects at high peak B1+ amplitudes10. The scan time was about 50 % compared to 3T. The gain in SNR per time is under investigation. In addition, the multi-echo phase images can be used for quantitative susceptibility mapping (QSM).Conclusion
MT mapping within an MPM protocol at 7T is feasible but requires B1+ correction and control of inherent MT effects by the excitation pulses.Acknowledgements
Dr. Burkhardt Maedler, Philips Healthcare, for advice on MT pulse implementation.References
1. Sled, J.G. and G.B. Pike, Quantitative imaging of magnetization transfer exchange and relaxation properties in vivo using MRI. Magn Reson Med, 2001. 46(5): p. 923-31.
2. Helms, G., et al., High-resolution maps of magnetization transfer with inherent correction for RF inhomogeneity and T1 relaxation obtained from 3D FLASH MRI. Magn Reson Med, 2008. 60(6): p. 1396-407.
3. Weiskopf, N., et al., Quantitative multi-parameter mapping of R1, PD(*), MT, and R2(*) at 3T: a multi-center validation. Front Neurosci, 2013. 7: p. 95.
4. Pruessmann, K.P., et al., SENSE: sensitivity encoding for fast MRI. Magn Reson Med, 1999. 42(5): p. 952-62.
5. Nehrke, K. and P. Bornert, DREAM--a novel approach for robust, ultrafast, multislice B(1) mapping. Magn Reson Med, 2012. 68(5): p. 1517-26.
6. Balteau, E., et al., hMRI – A toolbox for using quantitative MRI in neuroscience and clinical research. Neuroimage (under revision).
7. Dathe, H. and G. Helms, Exact algebraization of the signal equation of spoiled gradient echo MRI. Phys Med Biol, 2010. 55(15): p. 4231-45.
8. Helms, G., et al., Identification of signal bias in the variable flip angle method by linear display of the algebraic Ernst equation. Magn Reson Med, 2011. 66(3): p. 669-77.
9. Rooney, W.D., et al., Magnetic field and tissue dependencies of human brain longitudinal 1H2O relaxation in vivo. Magn Reson Med, 2007. 57(2): p. 308-18.
10. Al-Abasse, Y. and G. Helms. Influence of pulse length and shape on variable flip angle T1 mapping of human brain. in Proc ISMRM. 2016. 24: p. 614.
Figures