0306
Construction of a quantifiable rat spinal cord atlas and tract delineation using agglomerative clustering1NeuroPoly Lab, Institute of Biomedical Engineering, Polytechnique Montreal, Montreal, QC, Canada, 2Institute of Biomedical Engineering, University of Montreal, Montreal, QC, Canada, 3UMR 1214 Toulouse Neuroimaging Center, Institut national de la santé et de la recherche médicale, Toulouse, France, 4Montreal Heart Institute, Montreal, QC, Canada, 5Functional Neuroimaging Unit, CRIUGM, Université de Montréal, Montreal, QC, Canada
Synopsis
With qMRI becoming the norm in obtaining quantitative values for most MRI studies, there is still a need for its validation as new techniques are constantly being implemented. With this in mind, we propose a matter microstructure atlas of the rat spinal cord based on high-resolution histology. This atlas contains morphometric data such as axon density, axon diameter and g-ratio. Furthermore, a clustering algorithm was implemented to generate white matter tracts delineation based on axon morphometry, possibly leading to an improvement on outdated atlases. The proposed atlas is open access and can be used for quantitative comparisons with qMRI studies.
Introduction
As qMRI gains more traction in studies of the central nervous system, the question arises as to how these metrics can be validated. With the rat being an often used model for qMRI studies, the need arises for a quantitative rat atlas that outputs information such as axon density, axon diameter, and g-ratio as a means of validation. Atlases already in existence are often incomplete, based only on a single specimen and do not yield any form of microstructural data(1). Furthermore, the tracts that are delineated are based off of old staining techniques and a lot of guesswork. The proposed freely available rat atlas of healthy spinal cords for this study is based on full slice scanning electron microscopy (SEM) images and is coupled with an agglomerative clustering algorithm to outline the tracts. This clustering method would allow for the recognition of tracts based purely on a data-driven methodology. The creation of such an atlas that would be openly available to the scientific community would be a beneficial tool to allow for comparisons of histopathological studies of the spinal cord as well as for MRI studies of the same nature.Methods
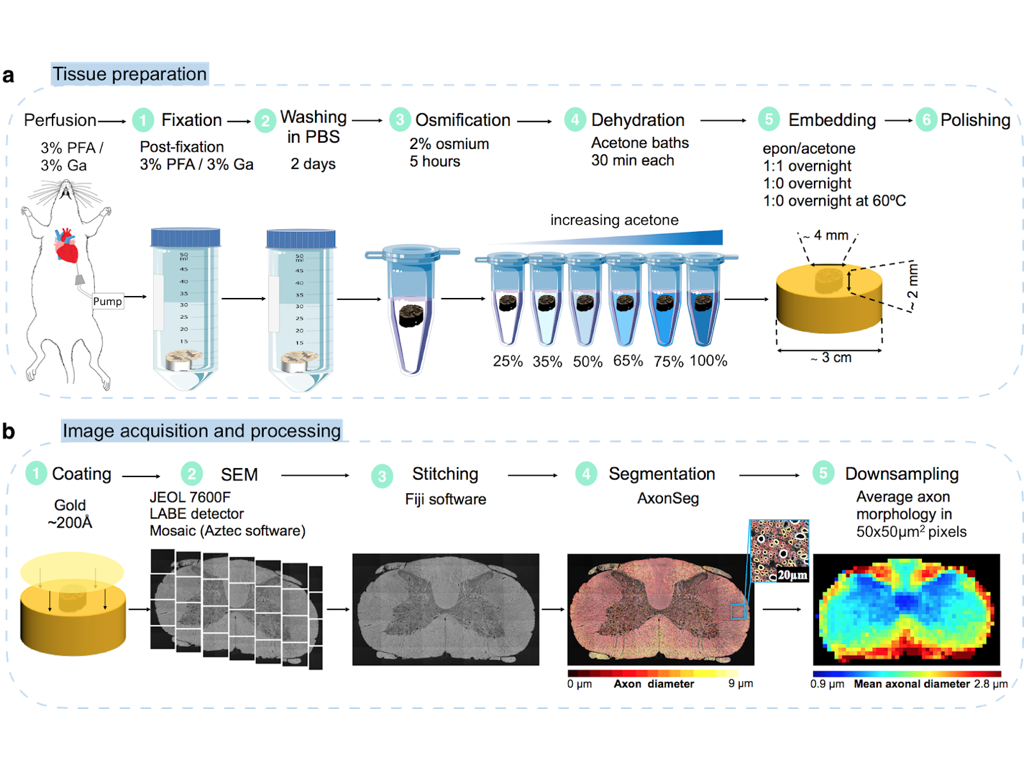
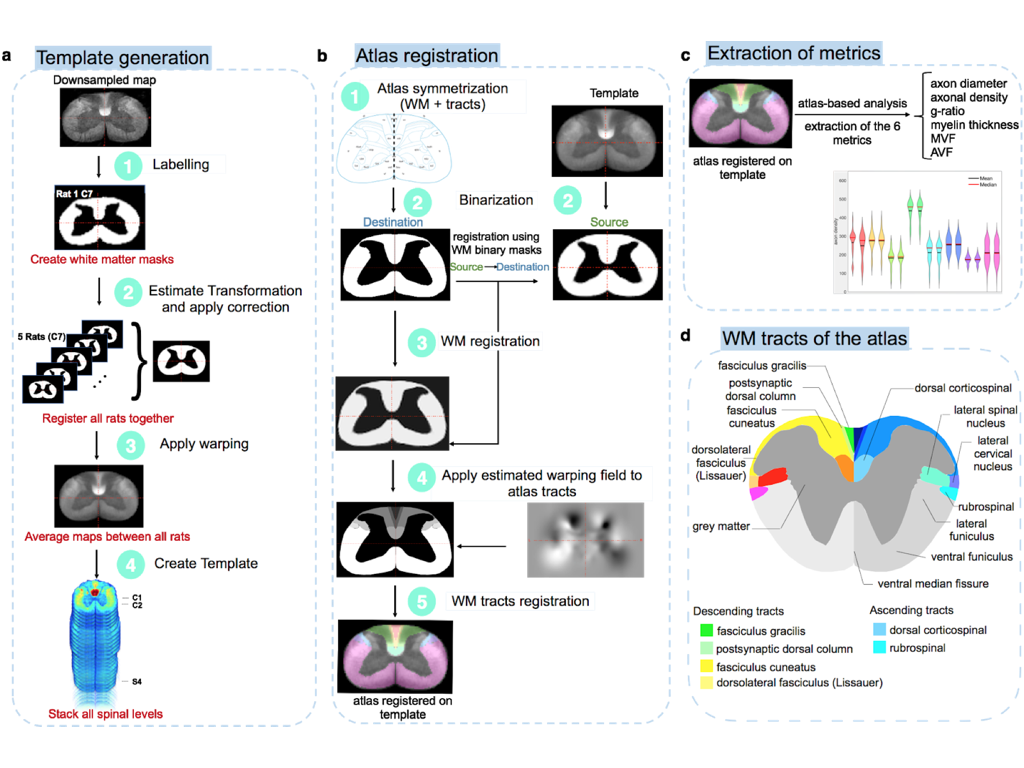
The atlas was created using full slice SEM images by scanning five ex vivo rat spinal cords through scanning electron microscopy. The rats (aged between 2-5 months and weighing 300-400 grams) were fixed by perfusion using a 3% paraformaldehyde and 3% glutaraldehyde solution after which the spinal cord was extracted. The spinal cord, was cut into 31 sections representing each spinal level, stained with osmium (2%), and then embedded in a resin for scanning (Figure 1). After scanning, the samples were segmented using an automated software (AxonSeg)(2). The template was then generated using the ANTs template construction algorithm(3) (Figure 2) and then a data-driven agglomerative clustering algorithm was applied to investigate the organization of the tracts. The algorithm used quantitative features such as axon density, axon diameter, g-ratio, myelin thickness, myelin volume fraction and axon volume fraction as well as the voxel spatial connectivity.Results
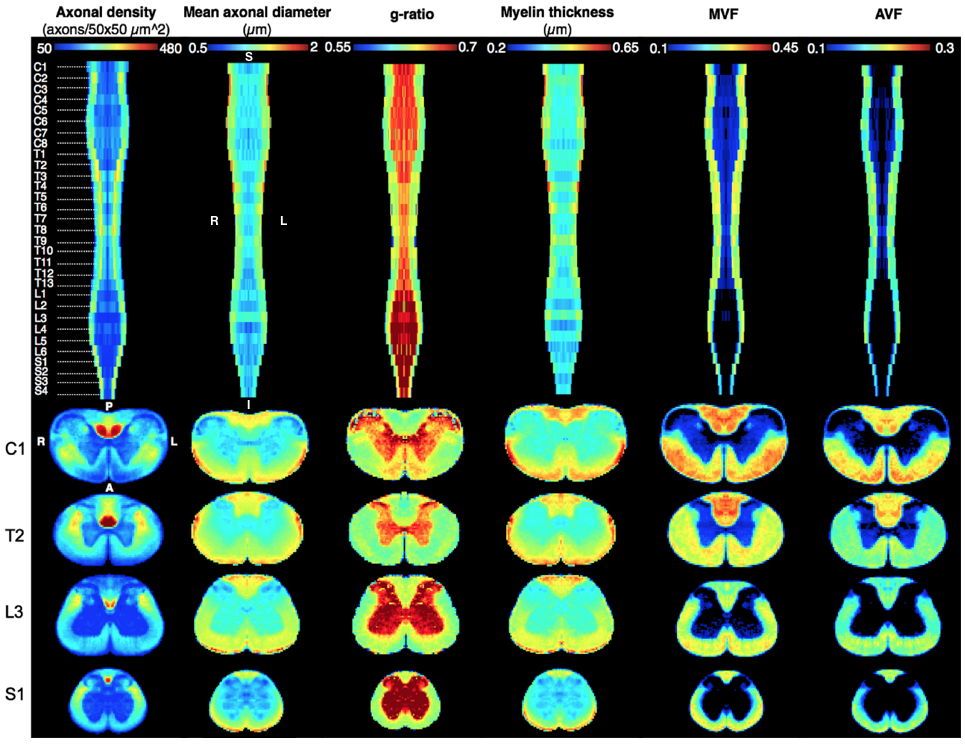
The microstructural 4D template of the spinal cord is shown in Figure 3. This template is the result of averaging the metrics across the five rats. and then concatenating the averaged metrics from each level (from C1 to S4) into a single volume. Figure 4 shows examples of some of the results. Axon density seemed to show the same trend throughout the spinal cord of having an average around 200-300 axons per 50x50 μm2 area when comparing between levels, with an increase of almost double that for the dorsal column tract. The overall g-ratio also seemed consistent, with averages between 0.59-0.63, which was very similar on a per tract basis as well (0.60-0.63). The axon diameters also seemed to be consistently ranging between 1.1-1.3 μm on average per level as well as per tract, with some tracts reaching a maximum average of 1.5 μm.
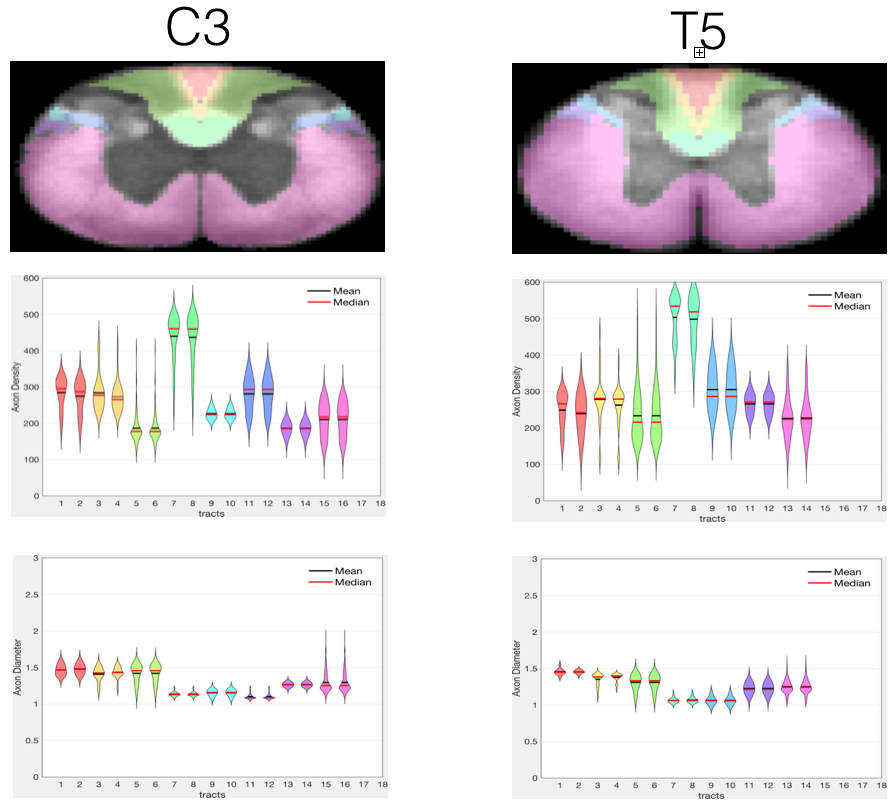
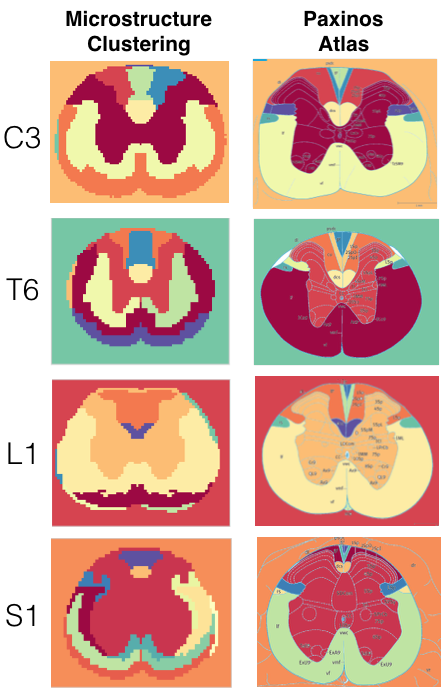
An agglomerative clustering algorithm was used to try and obtain the white matter tracts based on the extracted metrics and the voxel spatial connectivity. The preliminary results for this are presented in Figure 4 along with a comparison of the existing Paxinos atlas tracts. Left-right symmetry was enforced on the samples by using the flips of the samples and averaging them.
Discussion
The morphometric features generated from the template offer a lot of insight into the composition of the rat spinal cord which is consistent with the literature. This is evident by the fact that the dorsal column has been documented to be more densely populated with axons of a smaller size (ref). Furthermore, the measured g-ratio was very close to what the standard g-ratio should be (5,6).
This also ties into the fact that the white matter tracts generated from the clustering algorithm were quite similar to the Paxinos atlas. It can be further seen that tracts not apparent in the Paxinos atlas are evident in the results presented, suggesting that there are in fact other tracts that may exist. As these are only preliminary results more work needs to go into optimizing the algorithm to take into account more features, regularization between levels and smaller tract delineation.
Conclusion
This work proposes a white matter rat atlas that provides morphometric features. This can be an important tool for the validation of qMRI metrics as well as for the comparison with other studies. Furthermore, the investigative nature of the tracts clustering shows promise in potentially redefining the white matter tracts, substantiated by morphometric data. The code and generated atlas are freely available at: https://github.com/neuropoly/atlas_rat.Acknowledgements
We would like to thank Micheline Fortin from the histology department of the Institute for research in immunology and Cancer from the University of Montreal for their help and advice on the tissue preparation along with Diane Gingras from the pathology and cellular biology department of the University of Montreal. We would also like to thank the Center for Characterization and Microscopy of Materials (CM)² for their help with the electron microscopy scanning. This research was funded by the Canada Research Chair in Quantitative Magnetic Resonance Imaging [950-230815], the Canadian Institute of Health Research [CIHR FDN-143263], the Canada Foundation for Innovation [32454, 34824], the Fonds de Recherche du Québec - Santé [28826], the Fonds de Recherche du Québec - Nature et Technologies [2015-PR-182754], the Natural Sciences and Engineering Research Council of Canada [435897-2013], the Canada First Research Excellence Fund (IVADO and TransMedTech) and the Quebec BioImaging Network [5886].References
1. Saliani A, Perraud B, Duval T, Stikov N, Rossignol S, Cohen-Adad J. Axon and Myelin Morphology in Animal and Human Spinal Cord. Front. Neuroanat. 2017;11:129.
2. Zaimi A, Duval T, Gasecka A, Côté D, Stikov N, Cohen-Adad J. AxonSeg: Open Source Software for Axon and Myelin Segmentation and Morphometric Analysis. Front. Neuroinform. 2016;10:37.
3. Avants BB, Tustison NJ, Song G, Cook PA, Klein A, Gee JC. A reproducible evaluation of ANTs similarity metric performance in brain image registration. Neuroimage 2011;54:2033–2044.
4. Paxinos G, Ashwell KWS, Tork I. Atlas of the Developing Rat Nervous System. Academic Press; 2013.
5. Chomiak T, Hu - PloS one B, 2009. What is the optimal value of the g-ratio for myelinated fibers in the rat CNS? A theoretical approach. journals.plos.org 2009.
6. Stikov N, Campbell JSW, Stroh T, et al. Quantitative analysis of the myelin g-ratio from electron microscopy images of the macaque corpus callosum. Data Brief 2015;4:368–373.
Figures