0304
Column-specific microstructural changes in patients with non-myelopathic degenerative compression of the cervical spinal cord revealed by diffusion MRI1Department of Neurology, University Hospital Olomouc, Olomouc, Czech Republic, 2Department of Biomedical Engineering, University Hospital Olomouc, Olomouc, Czech Republic, 3Department of Pediatrics, University of Minnesota, Minneapolis, MN, United States, 4Central European Institute of Technology, Masaryk University, Brno, Czech Republic, 5Department of Neurology, University Hospital Brno, Brno, Czech Republic, 6Department of Medicine III, Clinical Division of Endocrinology and Metabolism, Medical University of Vienna, Vienna, Austria, 7Center for Magnetic Resonance Research, Minneapolis, MN, United States, 8High Field MR Centre, Medical University of Vienna, Vienna, Austria
Synopsis
While delineation of microstructural changes in white matter (WM) columns of cervical spinal cord (CSC) in patients with non-myelopathic degenerative CSC compression (NMDCSCC) remains a challenge for most current MRI techniques, High Angular Resolution Diffusion Imaging (HARDI) protocols promise to overcome this issue. Thus, our group utilized novel HARDI-ZOOMit protocol to extract metrics from diffusion tensor and ball-and-stick models in three major CSC columns. HARDI-ZOOMit protocol was able to detect column-specific significant differences between healthy controls and patients with NMDCSCC with more complex abnormalities in ventral CSC columns in C3-C6 levels.
INTRODUCTION
While degenerative changes of the spine almost ubiquitously occur in elderly, the relative resilience of the cervical spinal cord (CSC) often leads to a mismatch between the severity of degenerative CSC compression and clinical myelopathic symptoms, i.e., non-myelopathic degenerative CSC compression (NMDCSCC). Limited ability of anatomical T2-weighted MRI to reliably discriminate between NMDCSCC and symptomatic degenerative cervical myelopathy (DCM) further highlights the urgent need to establish sensitive quantitative in vivo MR parameters for detection of early structural alterations in the CSC. Although previous research suggested diffusion MRI (dMRI) as a valuable tool for microstructural CSC measurements1,2, relatively large voxel size utilized in earlier studies prevented more specific automated analyses of relevant CSC columns. Therefore, we utilized optimized High Angular Resolution Diffusion Imaging (HARDI)-ZOOMit protocol3,4 with excellent spatial resolution and tested its ability to delineate column-specific changes in NMDCSCC patients.METHODS
Eighteen patients with NMDCSCC in C4-C6 levels
with cross-sectional area ≤ 88 mm2 and compression ratios ≤ 0.55 (10
males, 55.6 ± 17.0 y.o.) were scanned together with 14 age-matched healthy
controls (5 males, 50.4 ± 9.8 y.o.) on 3T Prisma MR (Siemens Healthcare) using
head/neck and spine coils with 64 and 32 receive-array channels, respectively.
dMRI data were acquired using optimized HARDI-ZOOMit protocol with 63 diffusion
directions (b = 550 smm-2 (21 directions) and 1000 smm‑2 (42
directions)), 7 b0 images with anterior-posterior and 5
posterior-anterior phase encoding, TR = 6700 ms, TE = 73 ms, voxel size 0.65⨯0.65⨯3 mm3 (after interpolation in
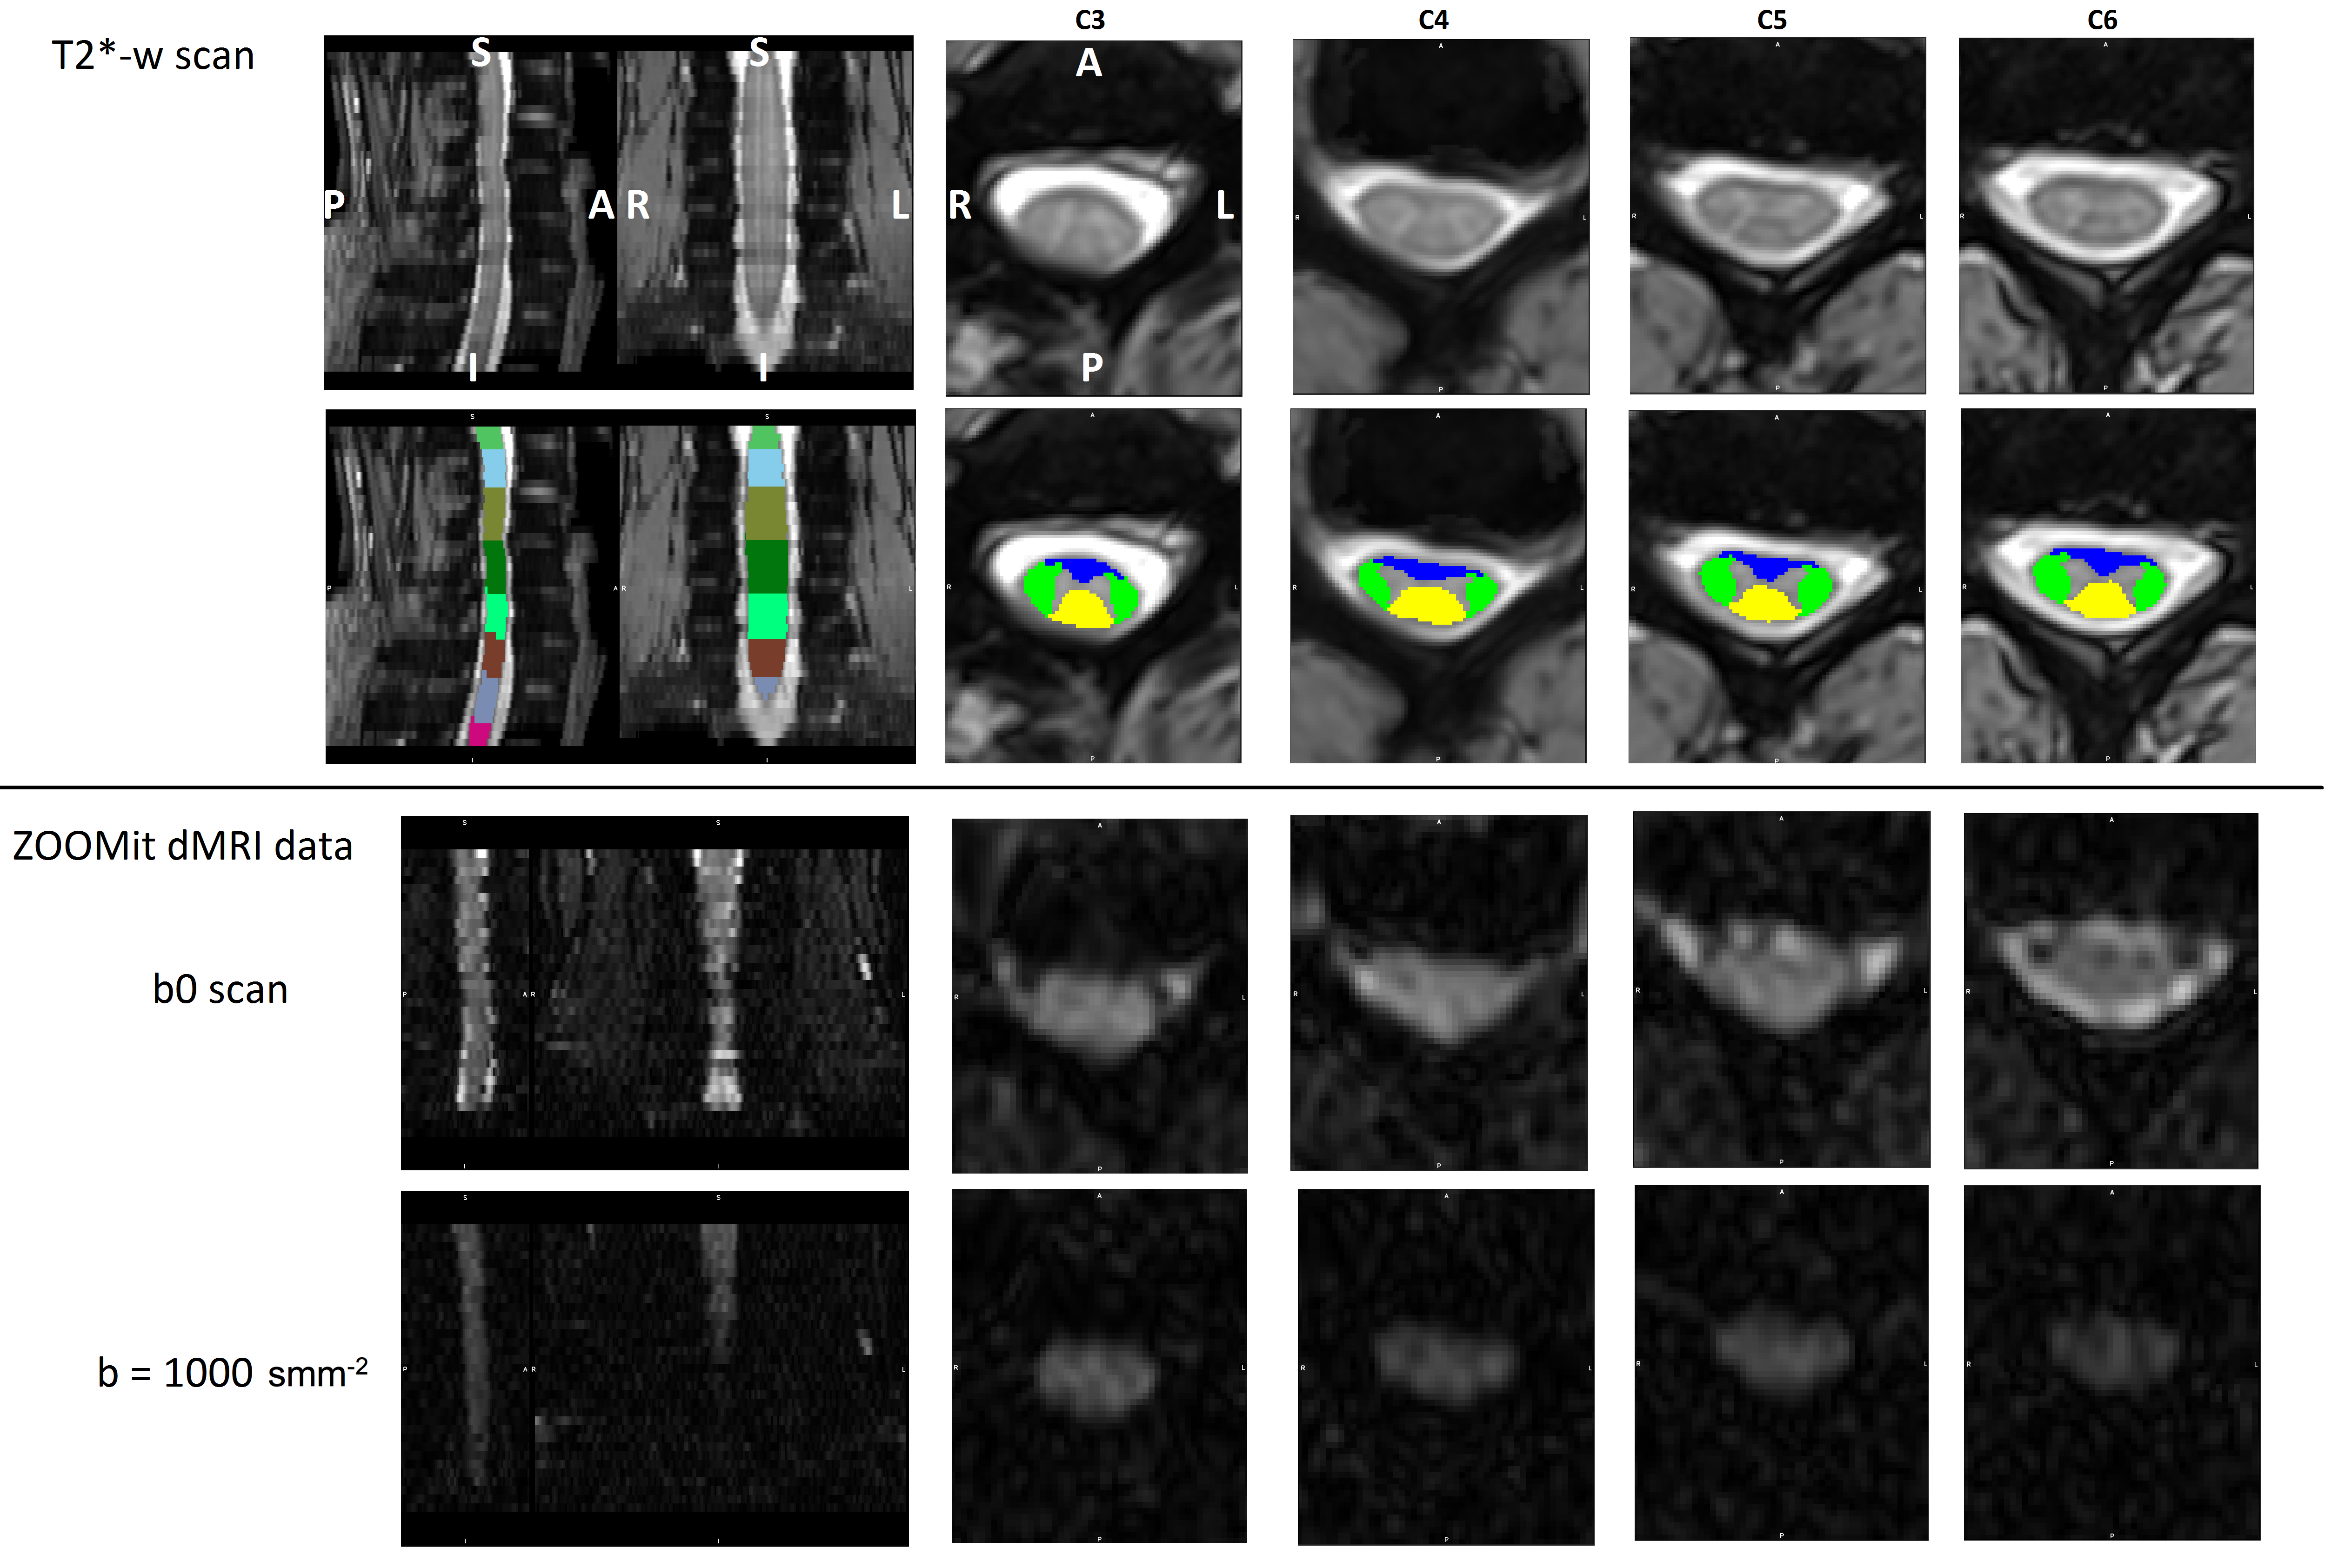
Fourier domain), TA = 12 min, 46 s. T2*-weighted axial scans were
obtained using a Multi-Echo Data Image Combination sequence with TR = 778 ms,
TE = 17 ms, voxel size 0.35⨯0.35⨯2.5 mm3 (after interpolation in
Fourier domain), TA = 7 min, 51 s. All data were scanned covering C3-C6 (Fig.
1). dMRI data were corrected for susceptibility, motion and eddy current
artifacts and diffusion tensor and ball-and-stick models were fitted to
quantify fractional anisotropy (FA), mean diffusivity (MD), axial diffusivity
(AD), radial diffusivity (RD), mean of diffusivity distribution (d), and
primary partial volume fraction (f1) using FSL5. SC segmentation and vertebrae labeling of T2*-weighted
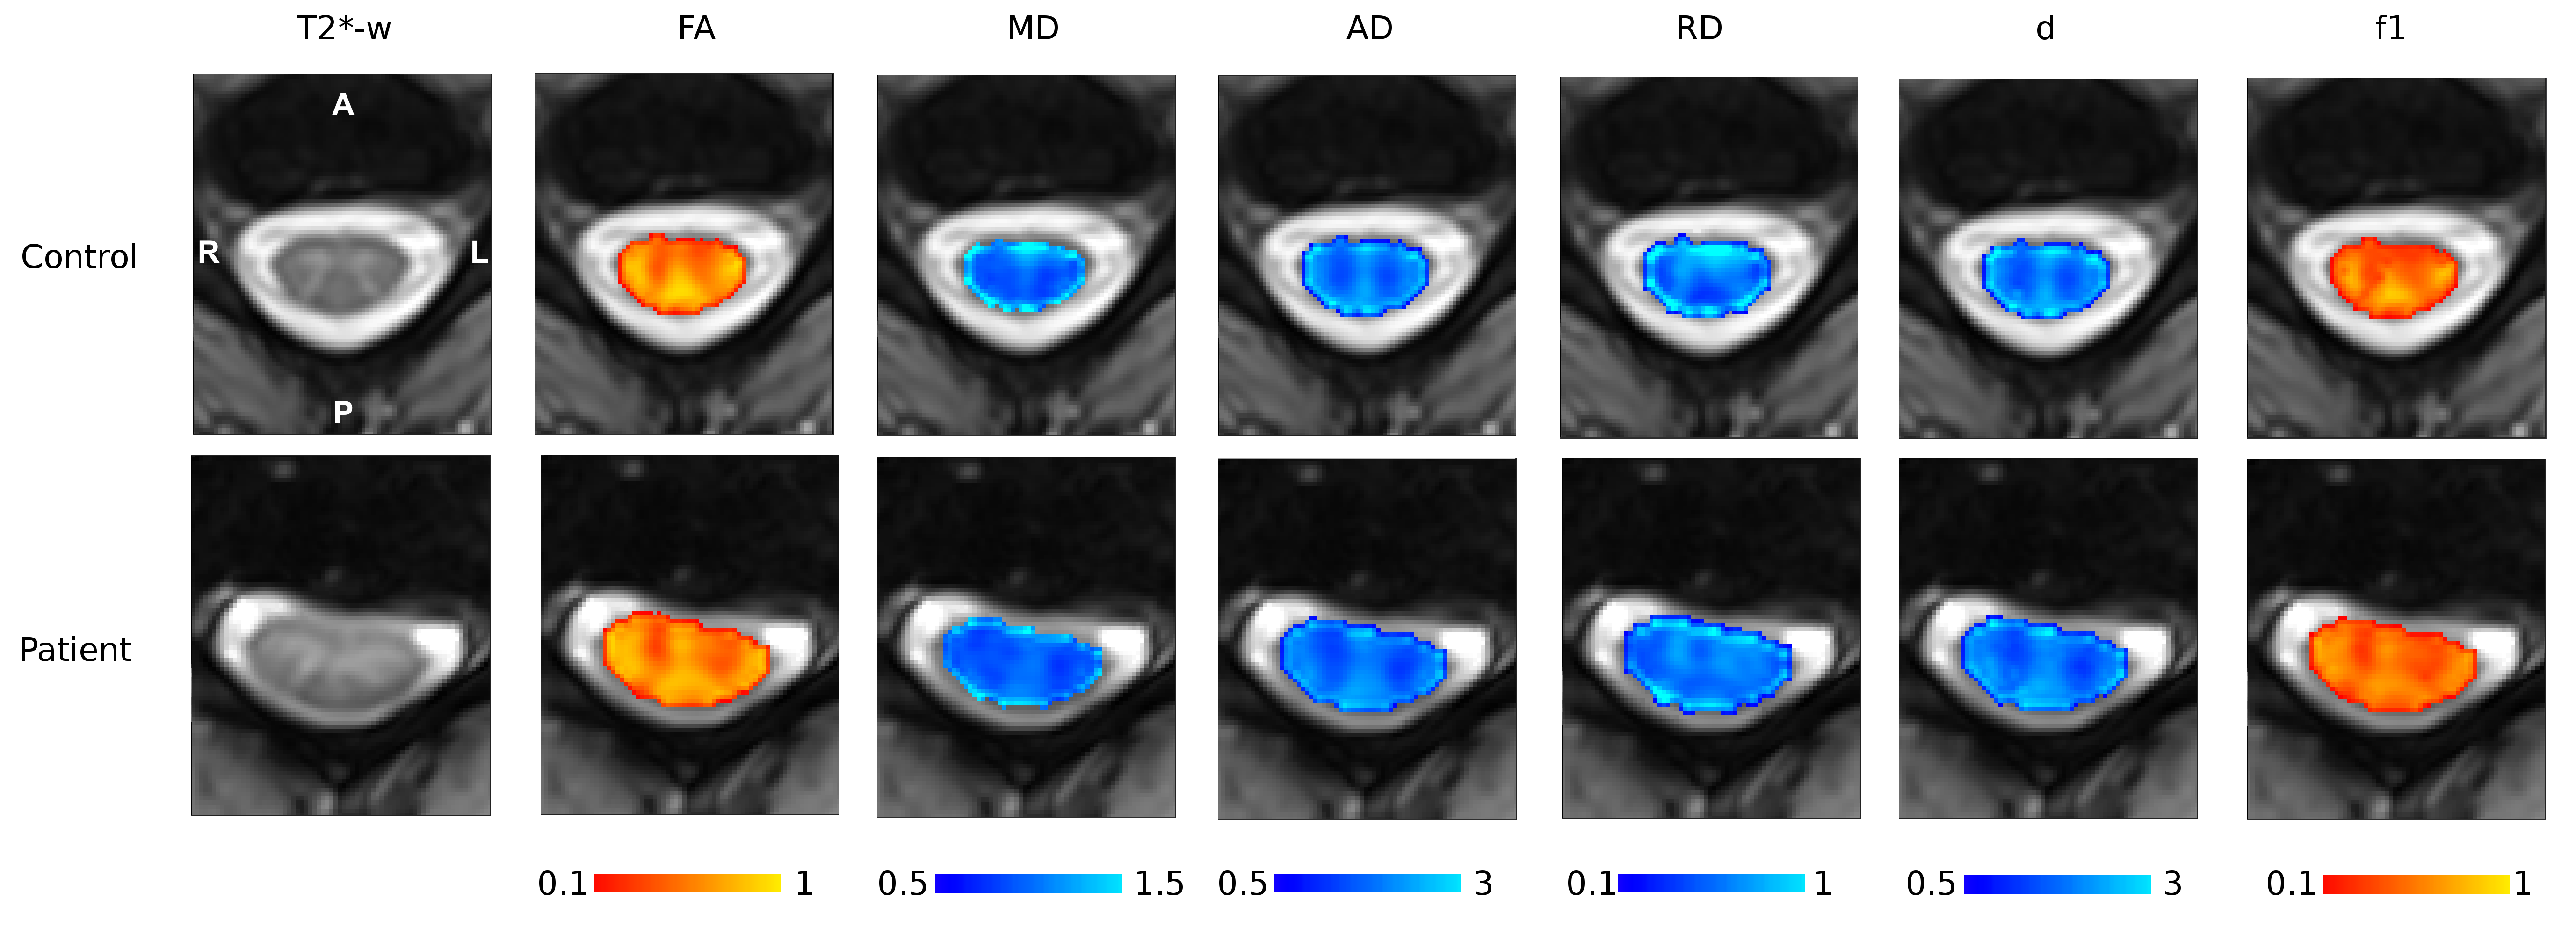
images were performed using Spinal Cord Toolbox6. dMRI maps and white matter (WM) SC atlas7 were registered to T2*-weighted space
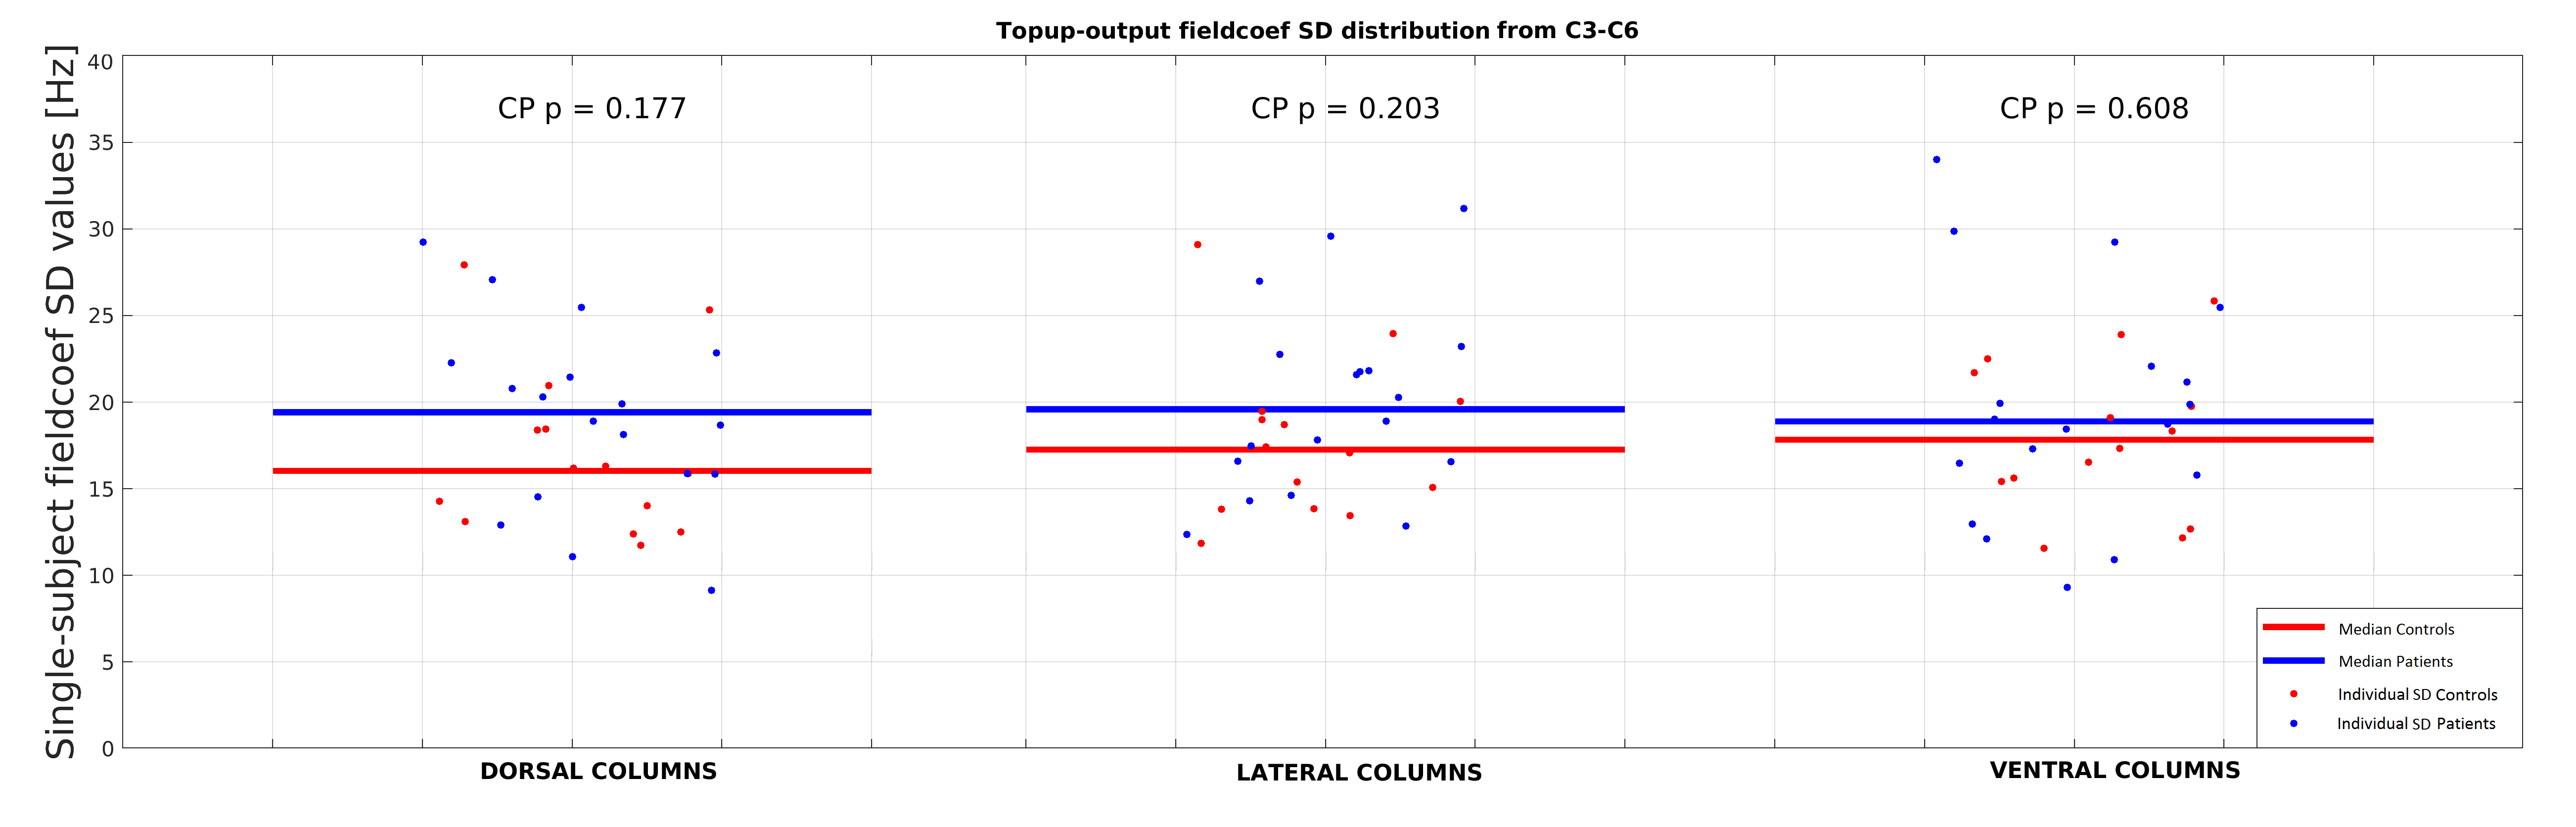
using non-linear registrations (Fig. 2). Absolute means (absMean) and standard
deviations of off-resonance field values (TOPUP output8) and means of dMRI metrics from major CSC WM columns
– ventral (VC), lateral (LC) and dorsal columns (DC) were extracted and
compared between groups using Wilcoxon Rank-Sum test. dMRI results were
corrected for multiple comparison using Bonferroni correction (pFWE<0.05/18).RESULTS
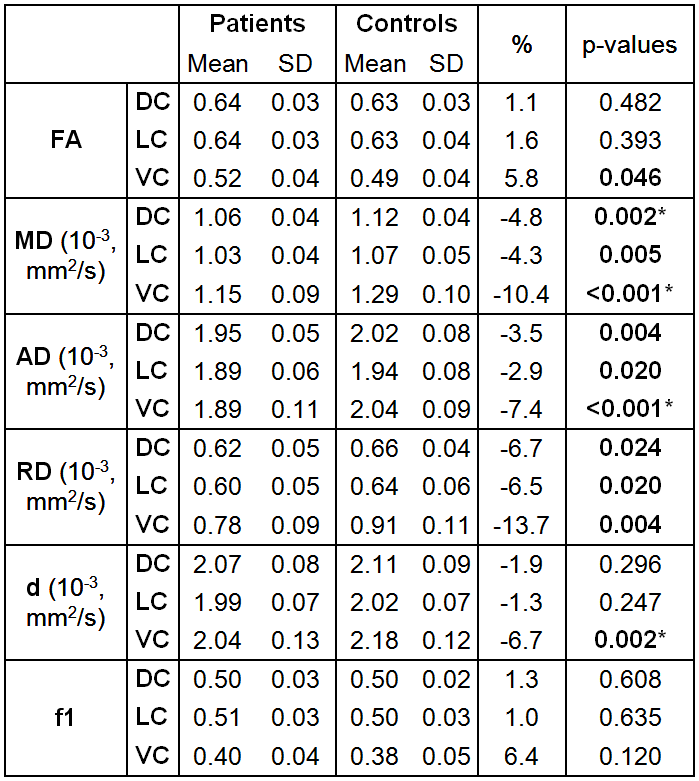
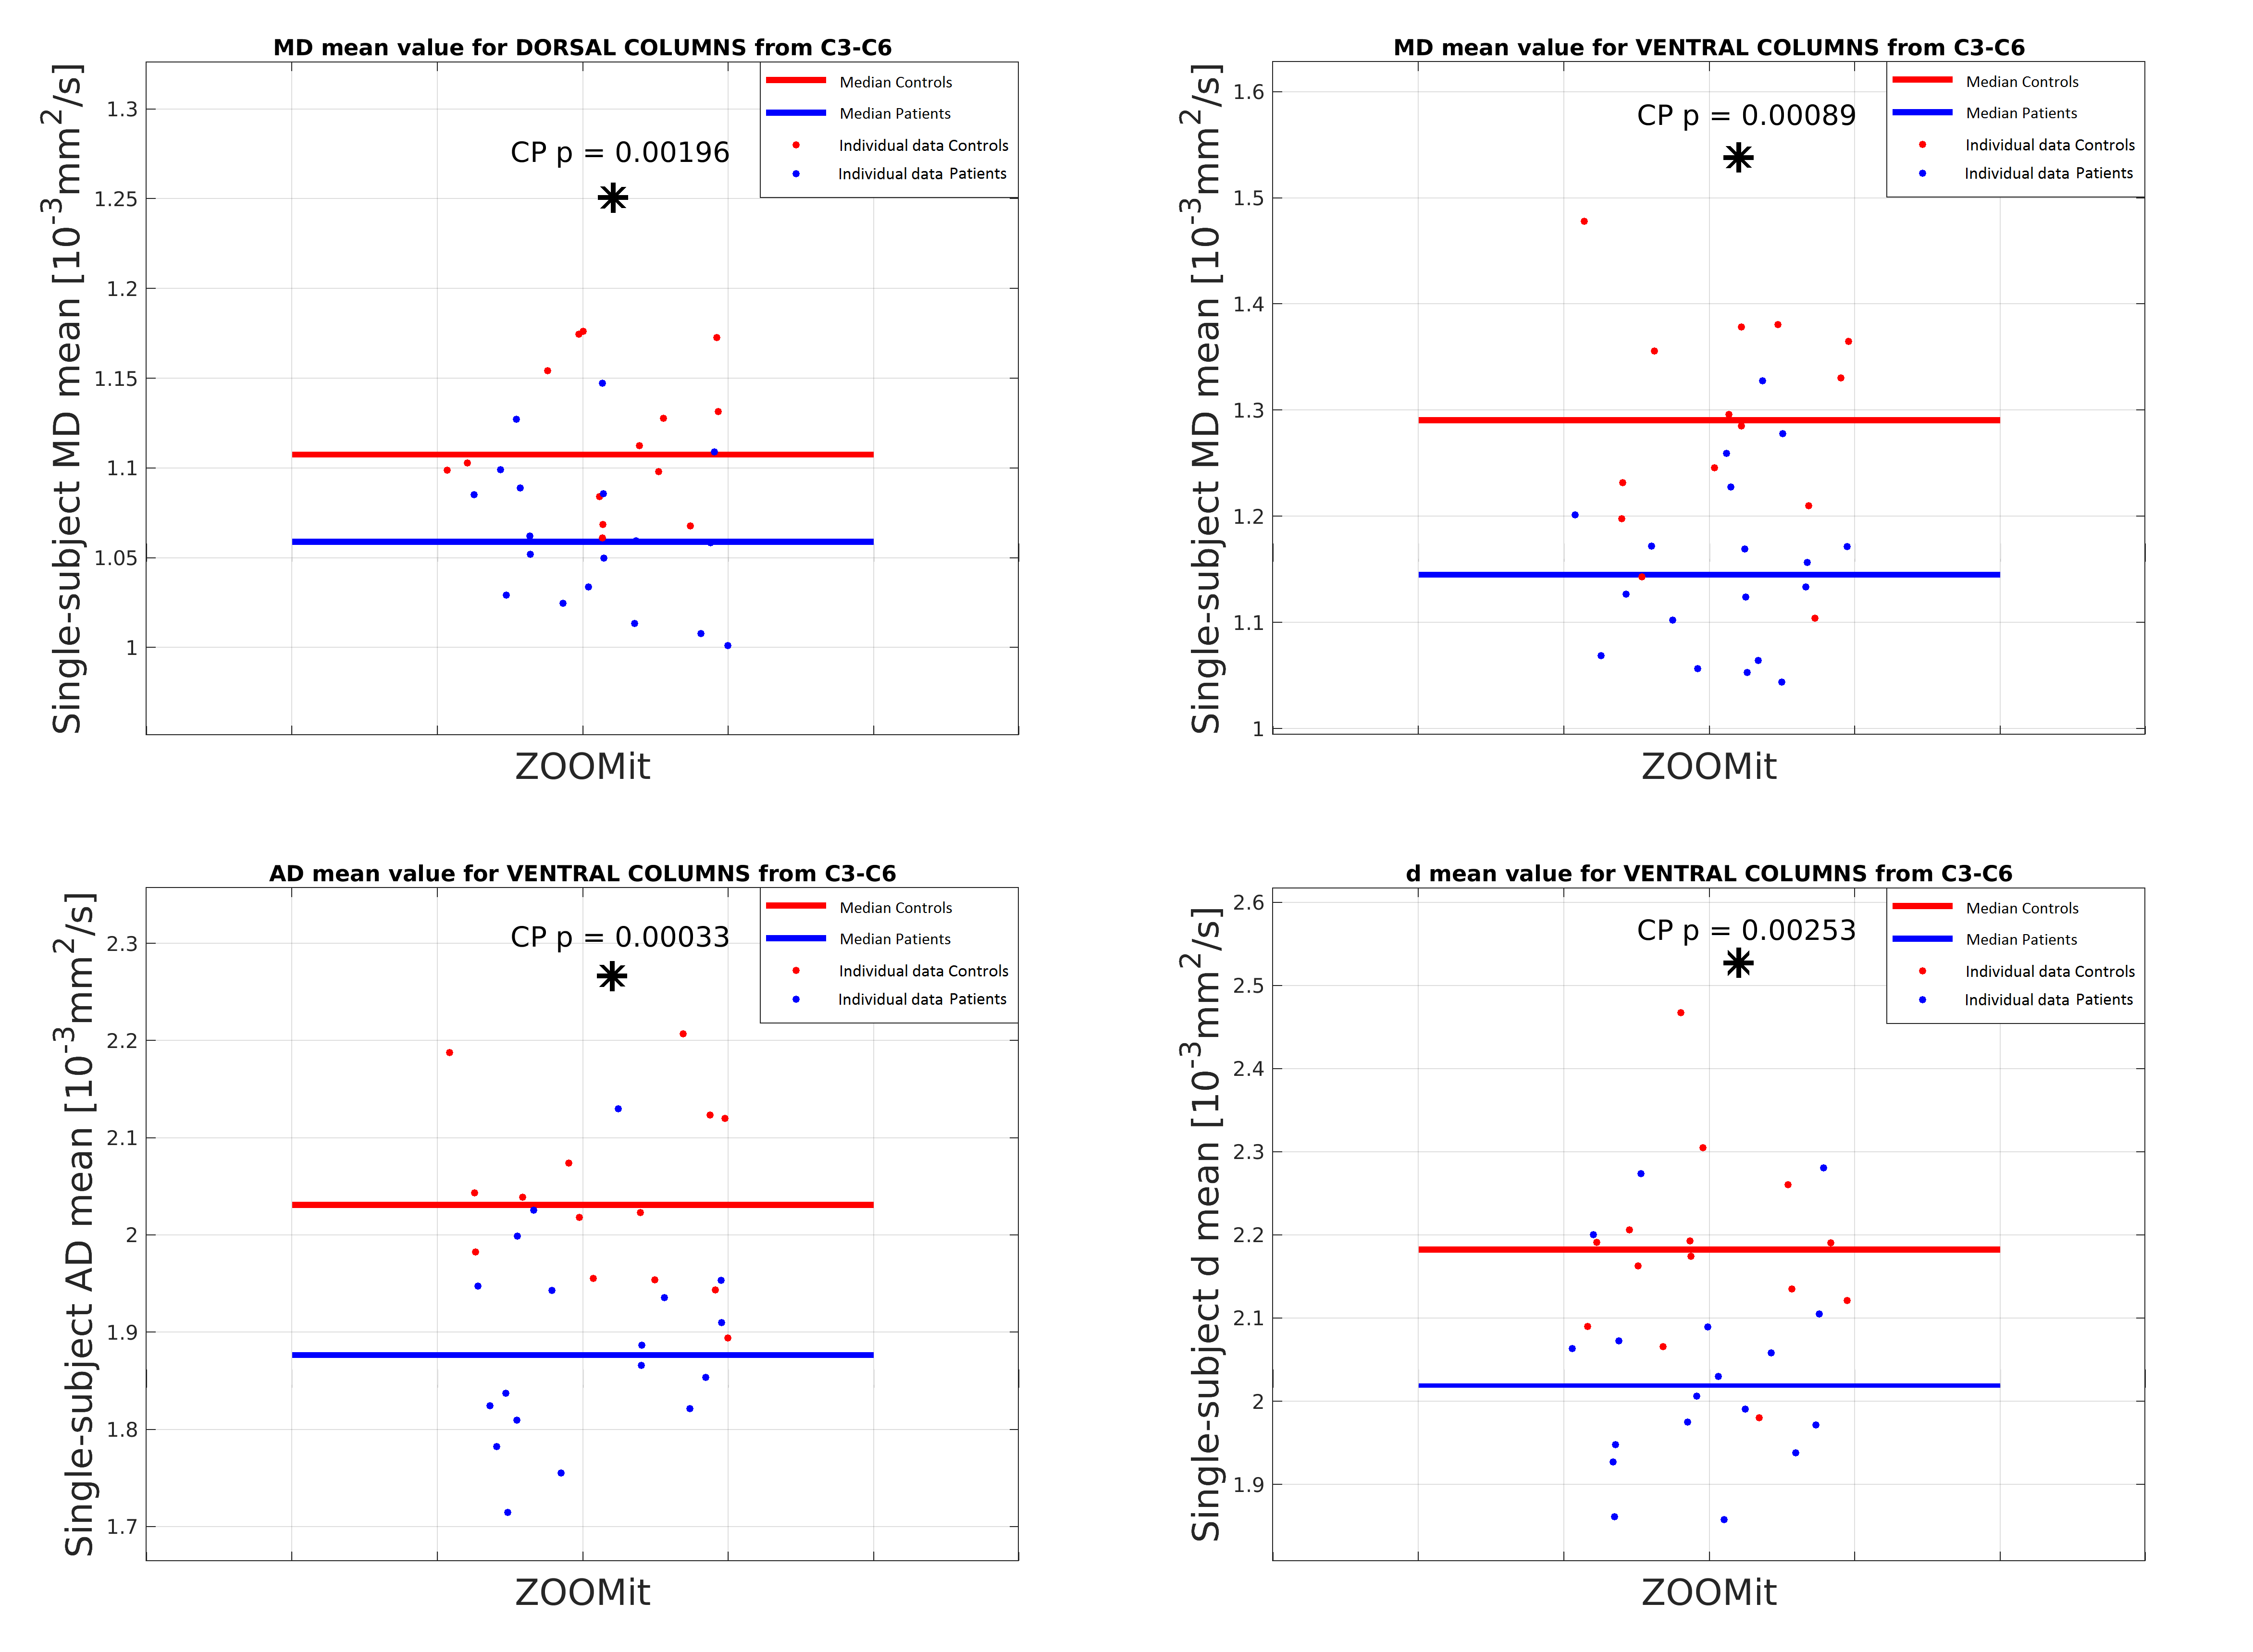
No significant between-group differences in off-resonance field caused by susceptibility artifacts were detected for VC (absMean Patients/Controls 21.41/15.76 Hz), DC (absMean Patients/Controls 21.82/16.56 Hz) and LC (absMean Patients/Controls 23.58/19.84 Hz)(Fig. 3). While analyses revealed significantly lower MD, RD and AD in VC, DC, and LC accompanied with lower d and higher FA in VC in patients compared to healthy individuals, only results for MD (10.4%), d (6.7%), AD (7.4%) in VC and for MD (4.8%) in DC survived multiple comparison correction (Fig. 4 and 5).DISCUSSION
Distinct severity of WM alterations with more complex changes in dMRI parameters in VC and limited MD abnormalities in DC suggest early column-specific microstructural deficits in NMDCSCC patients. Such alterations were hypothesized due to closeness to degenerative changes and major nutritive CSC vessels, i.e., anterior spinal artery in particular.9 Whereas studies in more advanced degenerative myelopathic CSC alterations reported lower FA and higher MD at the compression level in the whole CSC slice10, lower AD mirrored by decreased MD values in VC in NMDCSCC might suggest acute axonal alteration or gliosis.11,12 While tensor model accounts for all microstructural WM compartments within the voxel, more specific two-compartment ball-and-stick model implies deficits in unrestricted diffusivity outside axons and thus points to gliosis rather than axonal damage.12,13 This further emphasizes necessity for utilization of more specific WM models in early NMDCSCC. Absence of between-group differences in susceptibility artifacts suggests minimal bias of dMRI data by bulging intervertebral discs and confirms relevance of HARDI-ZOOMit for future clinical studies in NMDCSCC patients.CONCLUSION
Optimized HARDI-ZOOMit protocol allowed to acquire dMRI data in clinically acceptable time without significant corruption by susceptibility artifacts and depicted early column-specific microstructural WM alterations in NMDCSCC patients. Outcomes provide evidence of more pronounced early VC alterations, while pointing to incipient microstructural changes in DC. Thus, combination of an optimized HARDI-ZOOMit protocol and sophisticated column-based quantitative dMRI analysis could aid in the challenging diagnosis of early stages of CSC microstructural impairments.Acknowledgements
We acknowledge the core facility Multimodal and Functional Imaging Laboratory, Masaryk University, CEITEC supported by the MEYS CR (LM2015062 Czech-BioImaging). This research is funded by the Czech Health Research Council grants n. NV18-04-00159, and by the Ministry of Health of the Czech Republic project for conceptual development in research organizations, ref. 65269705 (University Hospital, Brno, Czech Republic). C.L. is partly supported by NIH grants P41 EB015894 and P30 NS076408. AS has received funding from the European Union’s Horizon 2020 research and innovation programme under the Marie Skłodowska-Curie grant agreement No 794986”.References
1. Stroman PW, Wheeler-Kingshott C, Bacon M, et al. The current state-of-the-art of spinal cord imaging: Methods. Neuroimage. 2014;84:1070-1081.
2. Wheeler-Kingshott CA, Stroman PW, Schwab JM, et al. The current state-of-the-art of spinal cord imaging: Applications. Neuroimage. 2014;84:1082-1093.
3. Samson RS, Lévy S, Schneider T, et al. ZOOM or Non-ZOOM? Assessing Spinal Cord Diffusion Tensor Imaging Protocols for Multi- Centre Studies. PLoS One. 2016.
4. Labounek R, Valošek J, Zimolka J, et al. Fast in vivo high-resolution diffusion MRI of the human cervical spinal cord microstructure. In: IFMBE Proceedings. Vol 68. ; 2019.
5. Jenkinson M, Beckmann CF, Behrens TEJ, Woolrich MW, Smith SM. FSL. Neuroimage. 2012;62(2):782-790.
6. De Leener B, Lévy S, Dupont SM, et al. SCT: Spinal Cord Toolbox, an open-source software for processing spinal cord MRI data. Neuroimage. 2017;145:24-43.
7. Lévy S, Benhamou M, Naaman C, Rainville P, Callot V, Cohen-Adad J. White matter atlas of the human spinal cord with estimation of partial volume effect. Neuroimage. 2015;119:262-271.
8. Andersson JLR, Skare S, Ashburner J. How to correct susceptibility distortions in spin-echo echo-planar images: application to diffusion tensor imaging. Neuroimage. 2003;20(2):870-888.
9. Cohen-Adad J, Wheeler-Kingshott C. Quantitative MRI of the Spinal Cord.; 2014.
10. Martin AR, Aleksanderek I, Cohen-Adad J, et al. Translating state-of-the-art spinal cord MRI techniques to clinical use: A systematic review of clinical studies utilizing DTI, MT, MWF, MRS, and fMRI. NeuroImage Clin. 2016;10:192-238.
11. Alexander AL, Lee JE, Lazar M, Field AS. Diffusion tensor imaging of the brain. Neurotherapeutics. 2007;4(3):316-329.
12. Madden DJ, Bennett IJ, Burzynska A, Potter GG, Chen N, Song AW. Diffusion tensor imaging of cerebral white matter integrity in cognitive aging. Biochim Biophys Acta. 2012;1822(3):386-400.
13. Behrens TEJ, Woolrich MW, Jenkinson M, et al. Characterization and Propagation of Uncertainty in Diffusion-Weighted MR Imaging. Magn Reson Med. 2003;50(5):1077-1088.
Figures