0303
A Multi-site/multi-scanner DTI study of the adult spinal cord1Thomas Jefferson University, Philadelphia, PA, United States, 2University of Pennsylvania, Philadelphia, PA, United States, 3Johns Hoplkins University, Baltimore, MD, United States
Synopsis
This study presents DTI data collected for the complete cervical and thoracic spinal cord in healthy adult subjects as part of a multi-site/multi-scanner study. Thirty adult subjects were imaged with four different scanners including 1.5T and 3T field strengths and variability in DTI metrics was examined.
Introduction
A major variable in DTI spinal cord studies is the diversity in MRI scanner hardware, field strength, and achievable sequence parameters. Examination of differences in DTI metrics in the cervical cord have been performed1, but to our knowledge no acquisition of full cord DTI data has been performed for inter-scanner comparison. The goal of this study was to collect DTI data for the entire cervical and thoracic spinal cord (C1-T12) in healthy adult subjects to examine differences and variability in results from different MR vendors and field strengths.Methods
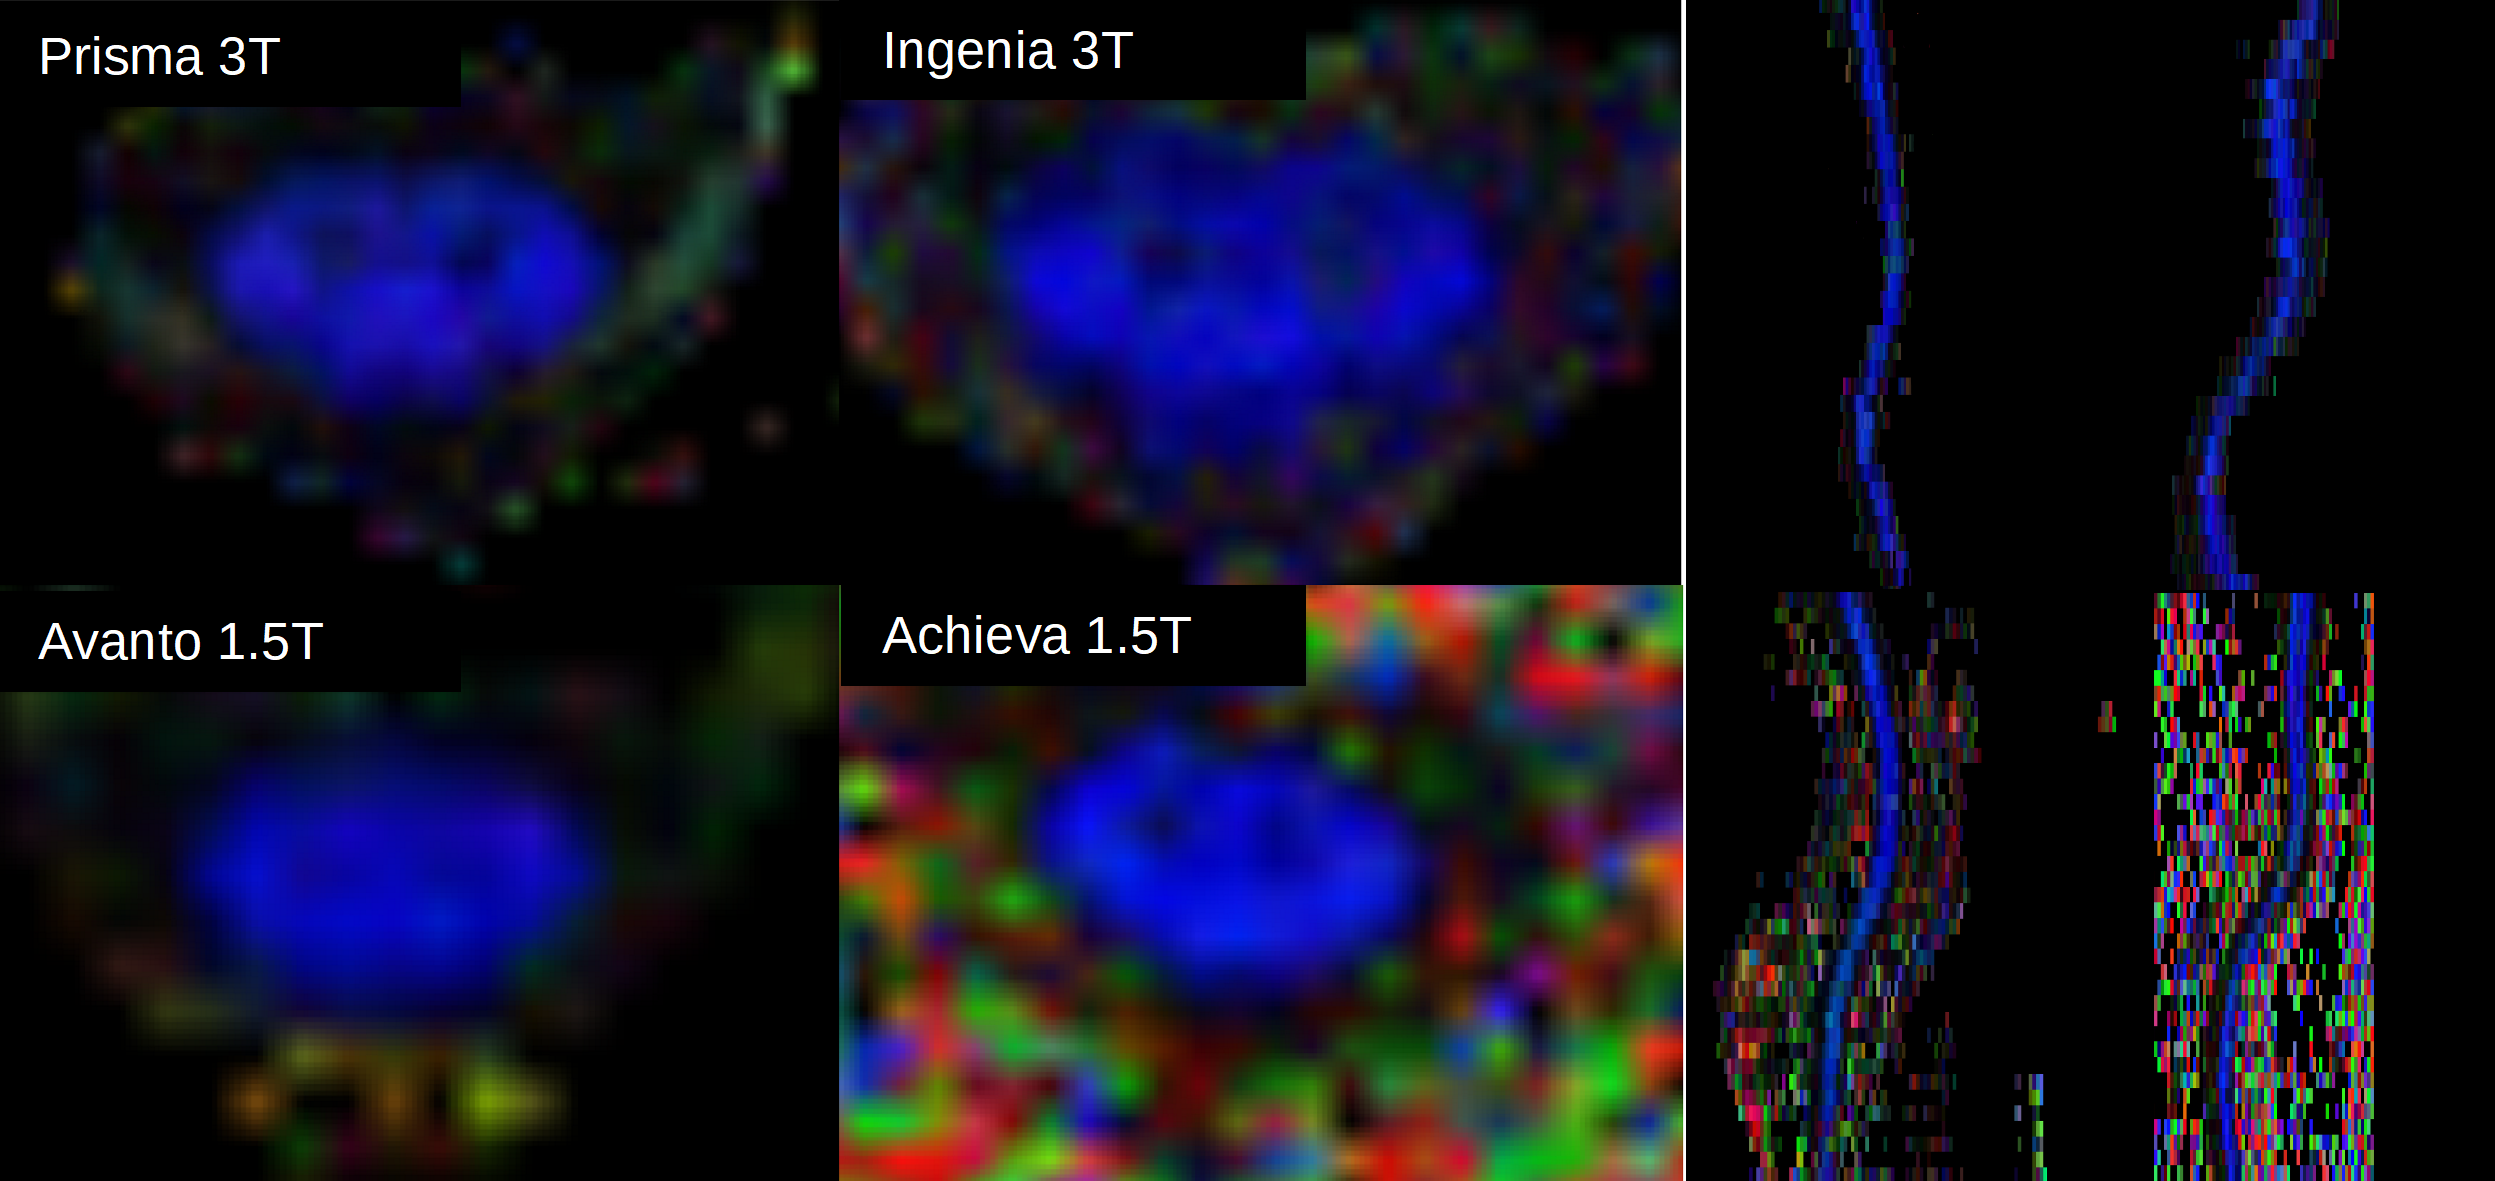
Thirty subjects (age range 20 to 30 years) were scanned with 20 direction DTI protocols on four different scanners for a total of 16 scans; Siemens 3T Prisma, Siemens 1.5T Avanto, Philips 3T Ingenia, and Philips 1.5T Achieva. All images were collected using a small field of view (outer volume suppression for Philips scanners, ZOOMit for Siemens) except the 1.5T Avanto where the feature was unavailable and a full field of view sequence was used. Full field of view DTI data was also collected on the 1.5T Achieva for comparison purposes. Where possible (Prisma and Avanto) pulse-ox cardiac gating was used. Diffusion weighted images of the full cervical and thoracic spinal cord were acquired on each scanner. Images were acquired axially with 6 mm slice thickness and in-plane resolutions ranging from 0.8mm2 to 1.5mm2 depending on scanner capability. T2 weighted sagittal and axial images were also acquired for anatomic localization. Motion and eddy current correction algorithms were applied using FSL2 to reduce distortion effects. Diffusion tensor maps fractional anisotropy (FA), mean diffusivity (MD), axial diffusivity (AD), and radial diffusivity (RD) maps were generated from the corrected images for the full cervical cord using a non-linear implementation of the RESTORE algorithm3 to reduce the effect of outlier data. Manual full cord ROIs were drawn on the axial maps to calculate the DTI parameters for the complete cervical cord and averaged for each vertebral level from C1-T12.Results
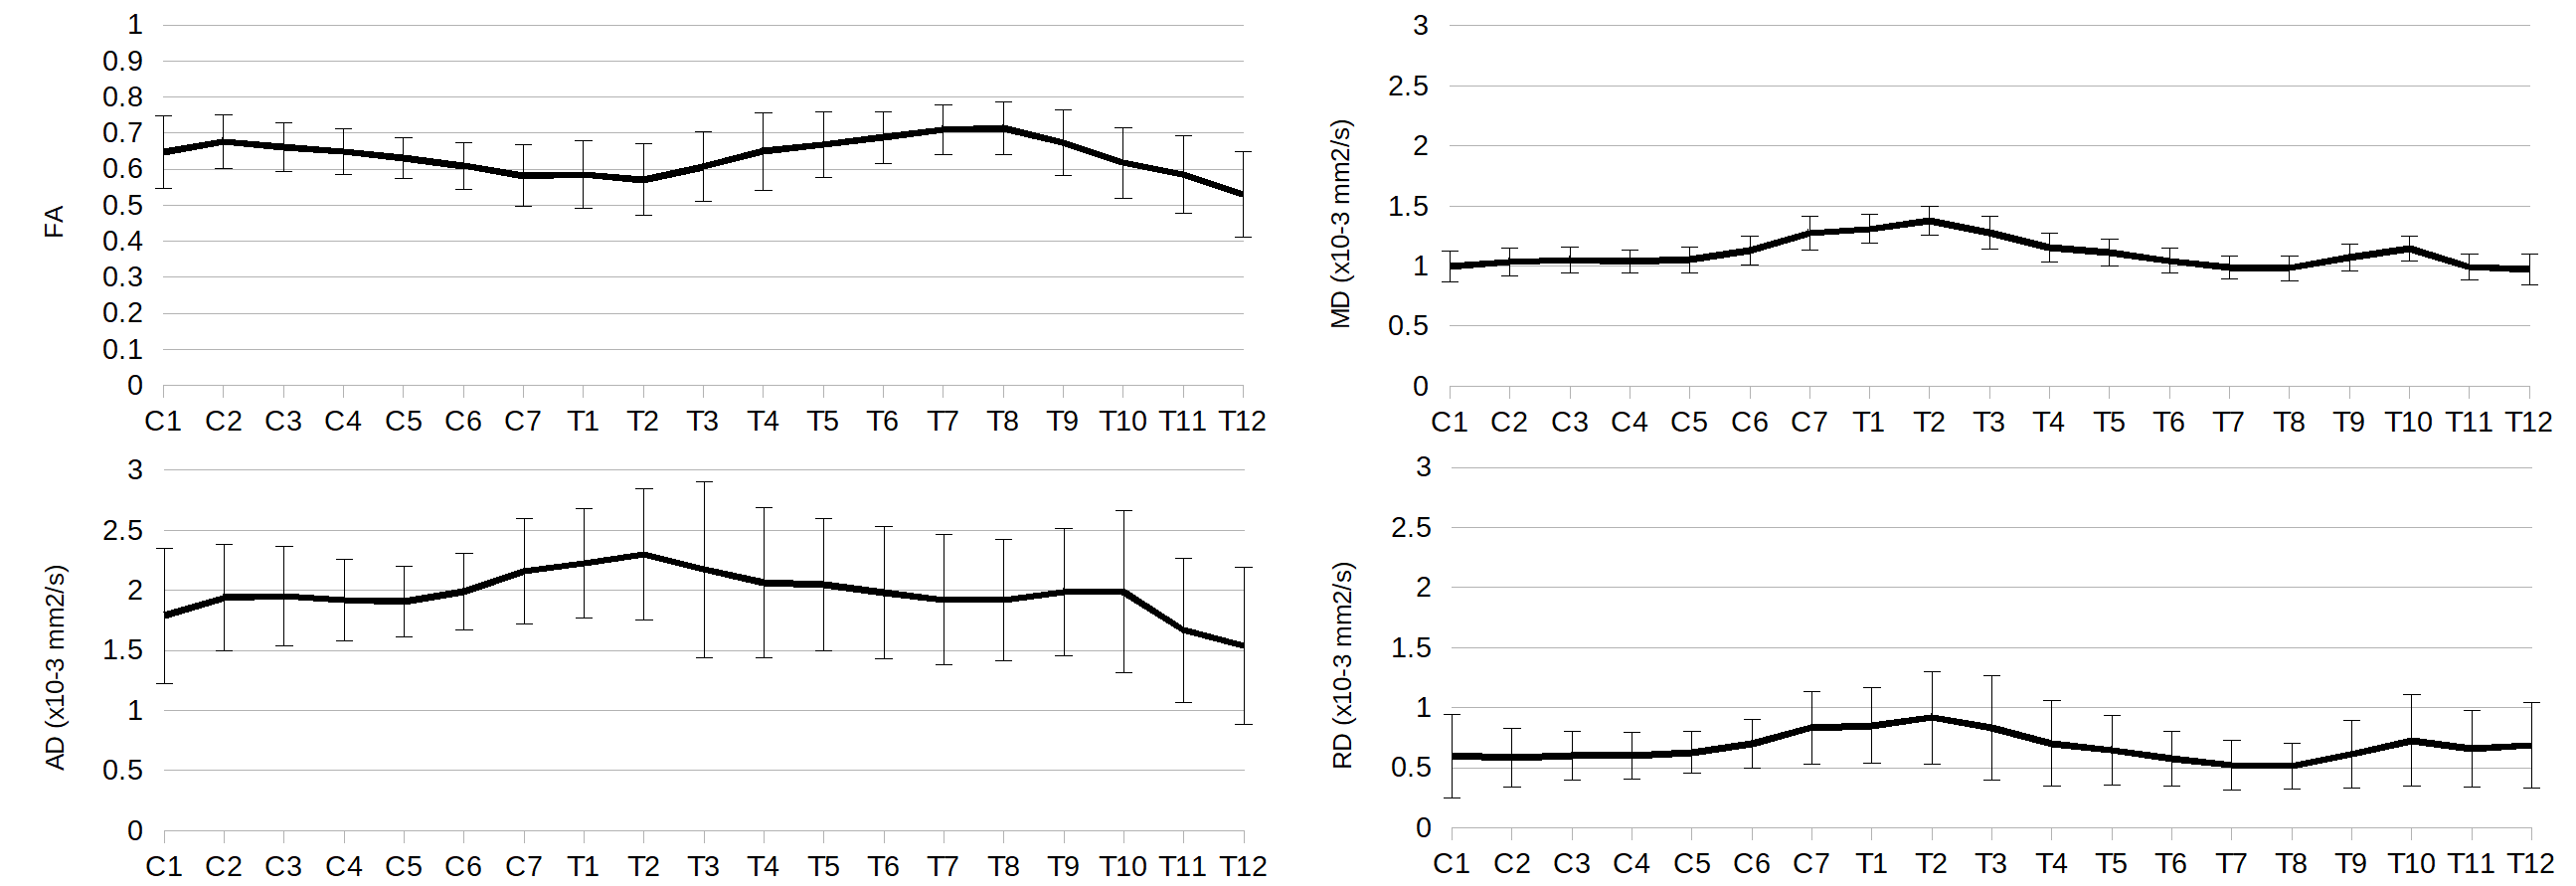
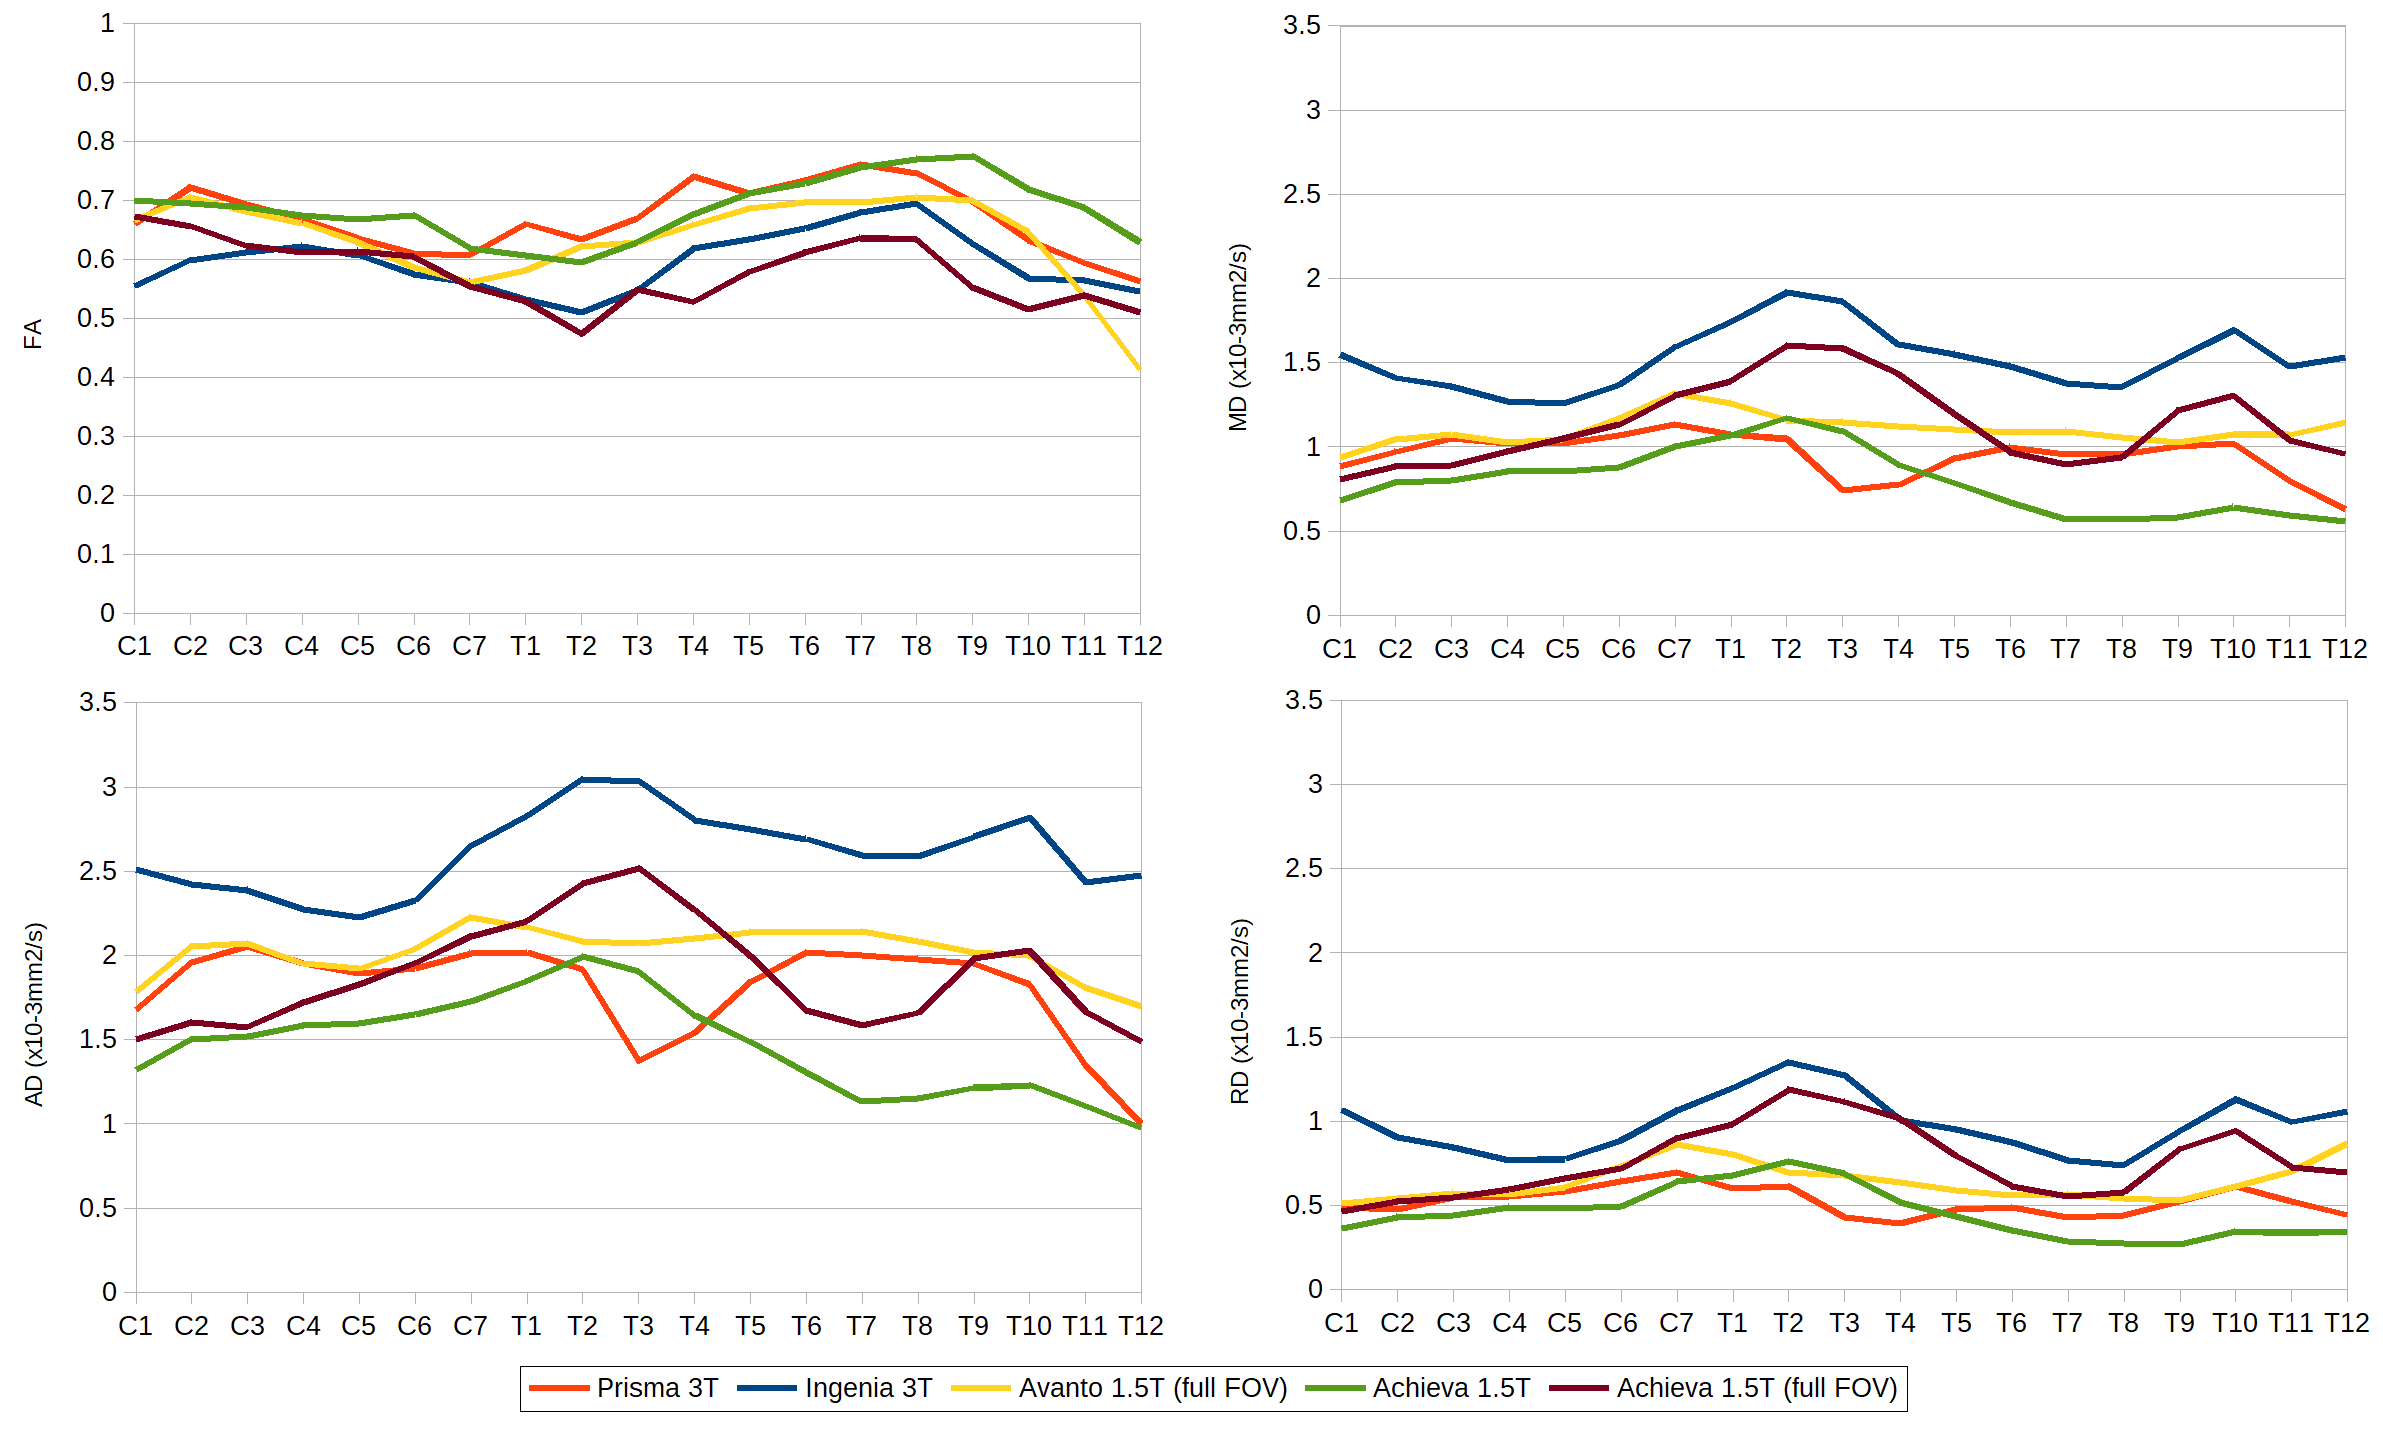
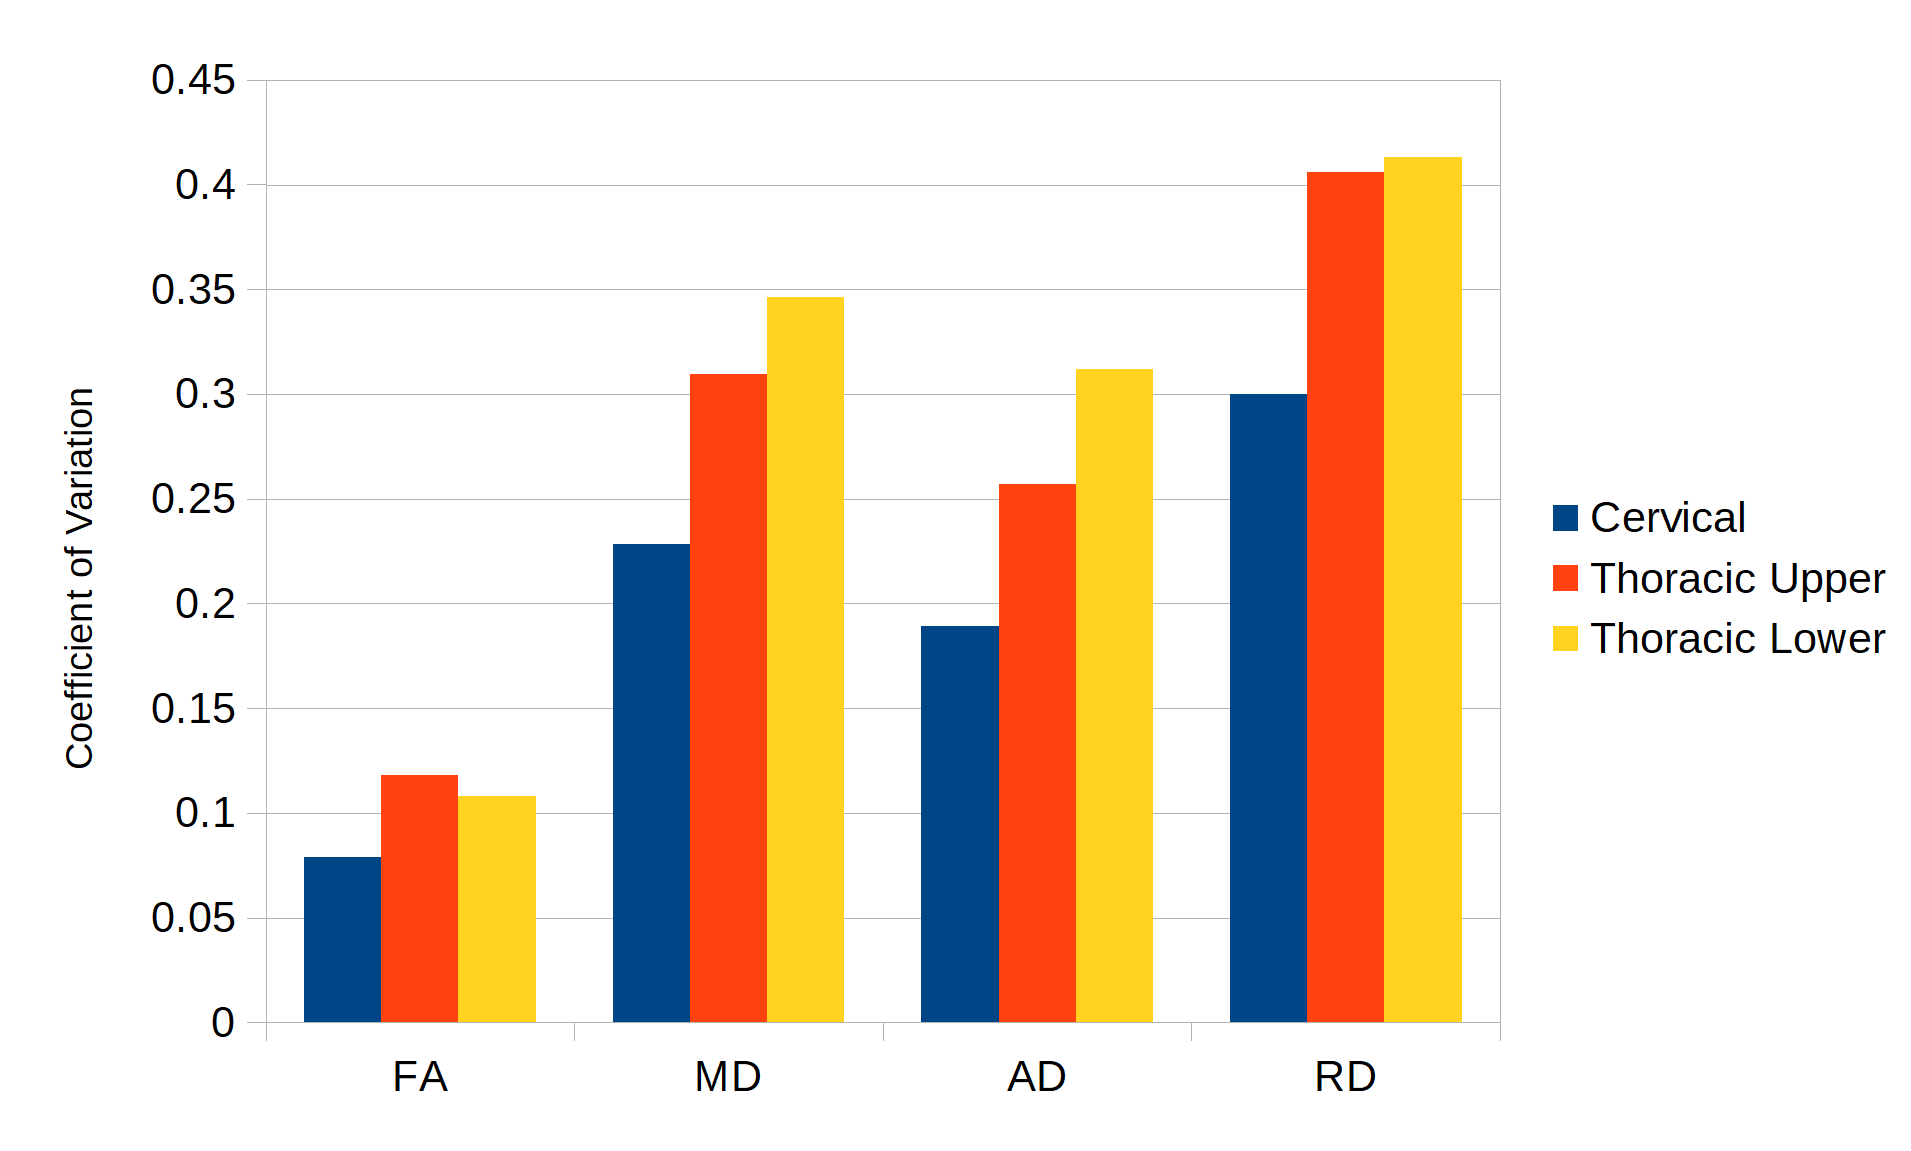
Average full cord values/standard deviation for all subjects and scanners were FA: 0.63, σ=0.10, MD: 1.11, σ=0.12, AD: 1.98, σ=0.55, RD: 0.67, σ=0.31; diffusivities given as x10-3 mm2/s. Average cord values for DTI metrics by vertebral level are shown in Figure 2. FA metrics averaged for all subjects by level were relatively consistent across scanners (Figure 3), but large variability was found in diffusivity measures, particularly in the upper thoracic region where cardiac pulsation can severely complicate imaging. In order to examine this further, each subject's DTI metric's coefficients of variation (CoV) were calculated for the cervical (C1-C7), upper thoracic (T1-T6) and lower thoracic (T7-T12) separately (Figure 4). CoVs were lowest in the cervical region, and relatively lower for FA than diffusivity measures.Discussion
Several issues complicate acquisition of DTI data for the spinal cord, including small size of the cord, physiological motion from cardiac and respiratory cycles, subject compliance, and variation in scanner hardware and pulse sequences. Variability was relatively high in this study, particularly for diffusivity metrics and the thoracic region. As a normalized metric, FA is more resistant to some of this variability where inter-scanner differences are somewhat mitigated if the differences in tensor eigenvalues are a function of an offset which propagates similarly across MD/AD/RD measurements. Further examination of scanner biases in diffusivity metrics is in progress which may allow for correction/harmonization, particularly in the cervical region where physiologic noise is less prevalent. Additionally, improved preprocessing steps to account for local signal dropout due to motion may improve concordance in the thoracic regions. Cardiac gating improves image quality in the thoracic region, but differences in diffusivity metrics are still pronounced near the heart/lungs between scanners using gating. There are several limitations with this study, including differences in sequence parameters due to scanner capabilities, differences in subject compliance, and differences in technicians operating the scanner. In clinical settings, many of these issues are unavoidable and this data may provide insights into reducing the impact of these problems in clinical applications.Conclusion
Variability in DTI of the full spinal cord arises from several sources, including scanner hardware differences, pulse sequence differences, physiological motion, and subject compliance. This variability is most pronounced in diffusivity metrics, and is strongest in the thoracic regions due to cardiac and respiratory motion. Further work on mitigation of scanner biases in DTI metrics and improved processing techniques to reduce impact of physiologic noise are important areas in efforts to make multi-center DTI of the full spinal cord more reliable.Acknowledgements
This work was funded by a grant from the Craig H. Neilsen Foundation.References
1. Samson RS, Levy S, Schneider T, et al. ZOOM or Non-ZOOM? Assessing Spinal Cord Diffusion Tensor Imaging Protocols for Multi-Centre Studies. PLoS One. 2016;11(5):e0155557
2. Andersson JLR, Sotiropoulos SN. An integrated approach to correction for off-resonance effects and subject movement in diffusion MR imaging. NeuroImage. 2016;125:1063-1078.
3. Chang LC, Jones DK, Pierpaoli C. RESTORE: robust estimation of tensors by outlier rejection. Magn Reson Med. 2005;53(5):1088-95.
Figures